This Forecast in-depth page has been updated with information available at the time of the March 2023 Economic and fiscal outlook.

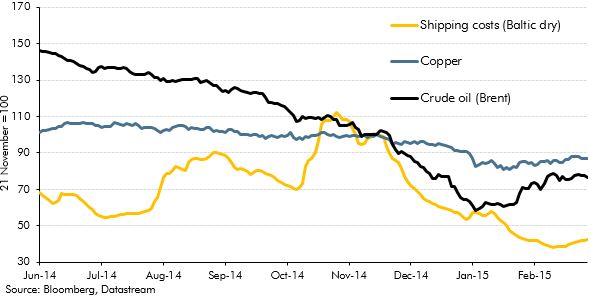
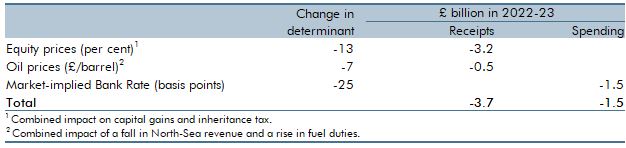
We forecast several variables by using the expected values that are implicit in the prices of financial market instruments. Since these reflect the collective views of the large number of investors in each market, it seems unlikely that our own forecasts could systematically outperform these values. We use this approach for oil prices, natural gas prices and interest rates. We also forecast equity prices by using the latest market values and projecting them to grow in line with our forecast for nominal GDP. The exchange rate is assumed to follow a ‘random walk’, meaning it is held flat over the forecast period. The rest of the economy forecast is then in effect conditioned on these implied financial market expectations of the likely future paths of these variables.

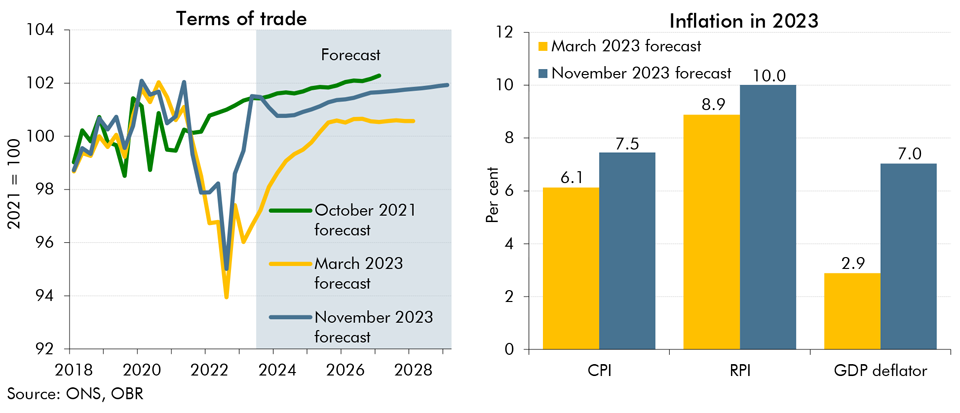
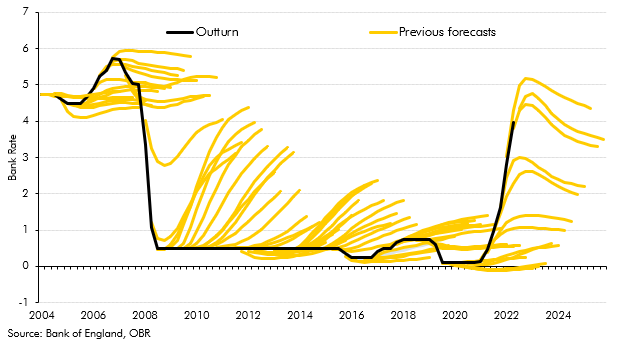
Financial market indicators can be volatile, responding to news and events from day-to-day. We therefore normally base our forecasts on the market-implied expectations over a 10-working day window – a period that aims to be short enough to capture the latest market view, but long enough to be less susceptible to day-to-day volatility. Usually, at the start of the forecast process, we agree a forecast timetable with the Treasury that includes the dates at which we will take financial market expectations. We would normally set the 10-working day window for our final economy forecast to be as near as possible to the point where we close down the forecast to everything but the effects of new policies. But on occasion, we have adopted other approaches – for instance,  our March 2023 economy and fiscal forecasts are based on an average of the five days following the publication of the Bank of England’s February 2023 Monetary Policy Report, so that the expectations fully incorporated the information contained in the report.

  Gas and oil prices

Our March 2023 natural gas price forecast is, over its first three years, based on the average path implied by the UK natural gas futures curve. For our economy and fiscal forecasts, we took the 5 working days to our collection date. Similarly, our oil price forecast over the first three years of the forecast is based on the average path implied by the Brent crude futures curve for the 5working days to our collection date. The reason we used futures curves for the first three years in our recent forecast was because movements in gas price futures were unusually significant over that period (we previously used futures curves for only two years). Beyond that point, we hold both prices flat in real terms using a price index based on major countries’ CPI inflation. This is because at extended horizons, we believe commodity futures markets are not sufficiently liquid to give a reliable representation of market expectations for prices. This methodology is informed by IMF analysis that suggests commodity futures curves are not the best predictor of spot prices at extended horizons.[1]

[1] Reichsfeld and Roache, November 2011, IMF Working Paper: Do Commodity Futures Help Forecast Spot Prices?

  Back to top

  UK interest rates

The expected paths for a number of measures of UK interest rates – notably Bank Rate (set by the Bank of England) and gilt yields (the market-determined interest rate paid on government bonds) are derived from financial market instruments including sterling overnight indexed swap (OIS) rates. As described above, in our March 2023 forecast we took an average of the market-implied path for each of the 5 working days up to and including our collection date for each of these variables.

  Back to top

  World interest rates

We take an asset-weighted average of both short-term and long-term interest rates for the USA, Canada, Japan and Euro-area, using data collected from interest rate futures markets.

  Back to top

  Exchange rates

In our March 2023 forecast, our trade-weighted sterling effective exchange rate index (ERI) economy and fiscal forecasts took 5 working day averages of the latest outturn, and then held these averages constant over the forecast horizon. We take the same approach with both the sterling/dollar and sterling/euro exchange rate.

  Back to top

  Equity prices

We usually assume that the FTSE All-Share index will be equal to the 10-working day average up to and including the collection date over the remainder of the current quarter (although, as set out above, we used 5 days in our March 2023 forecast). After holding equity prices equal to this value in the very short-term, we grow prices with our forecast for nominal GDP over the remainder of the forecast period.

  Back to top

  Mortgage rates

We produce a forecast for the average effective mortgage rate – the average interest rate paid on the total stock of loans secured against dwellings. This is an input into the Mortgage Interest Payments component of our RPI forecast and influences our house price forecast. It also affects our forecasts for household disposable incomes, which has an influence on our consumption forecast and so is a key driver of our overall economic forecast.

We produce forecasts for both fixed and variable effective mortgage rates. We then weight these according to their respective share of the mortgage market, and how we think that will evolve over the forecast period, to produce the average effective mortgage rate.

Both the fixed and variable mortgage rates are forecast as the sum of:

  • A “risk-free” rate. This is the rate that banks could use to fund their mortgage lending if their borrowing did not carry any default risk. We use our market-determined Bank rate forecast as the “risk-free” rate for variable rate mortgages. For our fixed-rate mortgage forecast, we use a rolling weighted average of market expectations for 2- and 5-year swap rates – these match the maturity of the most common fixed-rate mortgages. The swap rates will account for some of the term premia associated with fixed-rate mortgages.
  • A credit spread. In reality, bank borrowing is not without risk, so we need to add a credit spread onto the “risk-free” rate to approximate actual bank borrowing costs. After the 2008 financial crisis, a widening of the spread emerged between the “risk-free” rate and the mortgage rates faced by households. This was mainly because lending to banks was considered a riskier prospect. For both fixed and variable rate mortgages we take a 2-year rolling average of major UK banks’ five-year Credit Default Swap premia (using data from the Bank of England) to approximate the credit spread faced by banks.
  • A margin. The other part of the spread between risk-free rates and mortgage rates is the margin. This will include any difference between our estimate of bank’s borrowing costs and actual costs, other operating costs and profit margins. This part of the forecast comes down to BRC judgment informed by staff analysis about future changes to banks’ operating costs, market competition conditions, the state of bank balance sheets, the composition of borrowing, the riskiness of lending and the effect of market regulations.

  Back to top

  Deposit rates

We produce a forecast for the average effective rate of interest paid on the stock of household deposits. This is a weighted sum of the average effective rate on sight and time deposits. As deposits are one of the main sources that banks use to fund mortgages, we base this forecast on the evolution of the retail margin – the gap between deposit and mortgage rates. This is based on BRC judgements around banking sector competitiveness and profits plus the state of their balance sheets and other forms of funding. In recent forecasts, we have assumed that the retail margin will be fairly constant, meaning we assume that deposit rates move broadly in line with mortgage rates over the forecast.

  Back to top