
Persistently higher energy prices can reduce the supply capacity of the economy. In this box, we use a production function to estimate the impact of higher fossil fuel prices on potential output.
This box is based on OBR data from June 2022 .
To estimate the impact of higher gas and oil prices we use a three-factor production function. Technology is characterised by a constant elasticity of substitution function, which combines labour, capital and fossil fuels (which combines gas and oil) to produce aggregate output:
![]()
![]()
Where Y, L, K and F are aggregate output, labour, capital and fossil fuels, respectively, and p =(σ−1)/σ, where σ is the elasticity of substitution. We use a value of 0.4 for the elasticity of substitution in the UK.a
For the supply of the three factors of production, we assume:
- The UK’s demand for gas and oil does not affect the price of either commodity as prices are set regionally (in the case of gas where UK prices move closely with Europe-wide prices) or globally (in the case of oil).
- In the short run, the price of capital can change but the quantity does not because it takes time to scrap or rebuild capital (the short-run capital supply is perfectly inelastic). In the long run, the quantity of capital used in the economy changes as capital is scrapped and new capital is employed but the price does not change because capital is supplied in an internationally competitive environment (the long-run capital supply is perfectly elastic). We assume this adjustment happens over our medium-term forecast period of five years.
- The quantity of labour, l∗, supplied in the economy does not change (it is perfectly inelastic in the short and long run). This means that a reduction in demand for labour causes a fall in real wages but no reduction in the quantity of labour.
The demand for each factor of production can be derived and the model expressed in terms of the equations for output and factor demands:
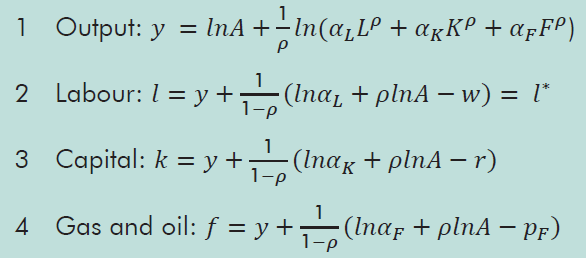
Where lower case letters reflect the logarithm of the variables and w, r and pF are the prices of labour, capital, and fossil fuels, respectively.
While the economy is assumed to move instantaneously to the new equilibrium following the price change, we can nonetheless use these equations to understand the channels through which an increase in fossil fuel prices feeds through. A rise in pF reduces the demand for fossil fuels (4), which then reduces aggregate output (1). This reduction in aggregate output then reduces the demand for capital and labour (2 and 3), and further reduces the demand for fossil fuels (4). This again reduces aggregate output and the process is repeated until the values for output and the three factors converge to equilibrium.
An important variable to assess the impact of gas and oil prices increases on the economy is the ‘gas and oil share’ (the income accruing to gas and oil inputs, both domestic and imported, as a share of total income). The higher the gas and oil share, the greater the impact of a given percentage increase in prices on aggregate output. To get the value of gas and oil as an input into production, we calculate the value of the intermediate consumption of gas and oil by other industries using the ONS’s input-output tables.b This is equal to £58 billion in 2019, the latest available value. We also calculate non-oil, non-gas domestic income, which is equal to £1,715 billion in 2019.c The gas and oil share is then equal to: a/(y+a), where a is the intermediate consumption of gas and oil by other industries and y is non-oil, non-gas domestic income. Using this approach, the gas and oil share in 2019 was 3.3 per cent. The ‘capital share’ is calculated as non-oil, non-gas capital income and equals 25.2 per cent.d The ‘labour share’ is 71.5 per cent by residual.
Using these values, we find that the elasticity of output to fossil fuel prices is -0.013 in the short run and -0.018 in the long run.
This box was originally published in Fiscal risks and sustainability – July 2022