
Box sets » Potential output and the output gap
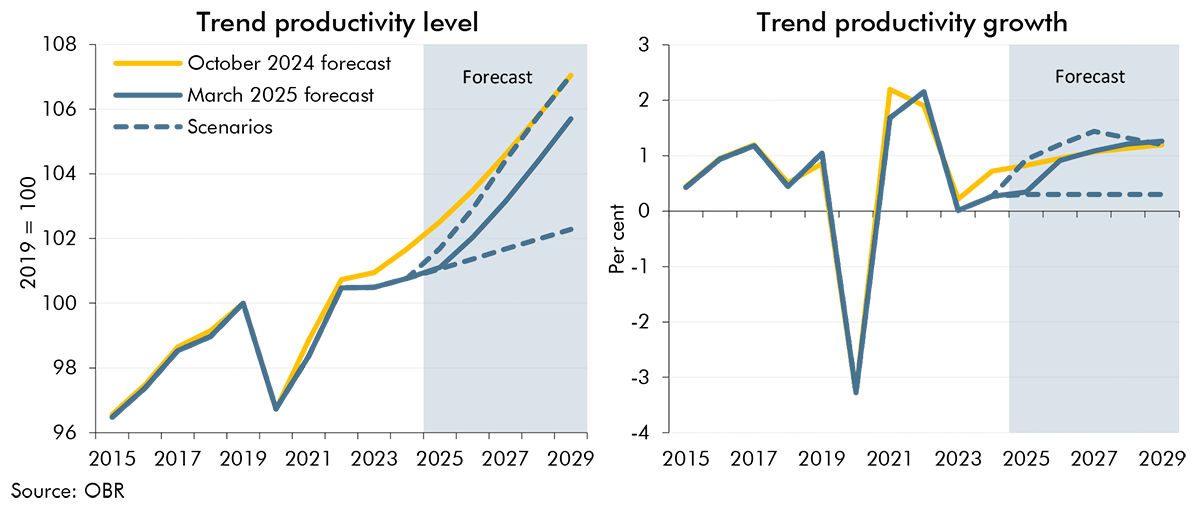
The outlook for trend productivity is one of the most important and uncertain forecast judgements. Successive past forecasts for trend productivity have proven to be too optimistic as productivity growth has continued to disappoint. In this box we explored two alternative scenarios for trend productivity: One where the recent weakness in trend productivity growth persists throughout the forecast period and one where it proves to be entirely cyclical and is offset by higher growth in the near-term.
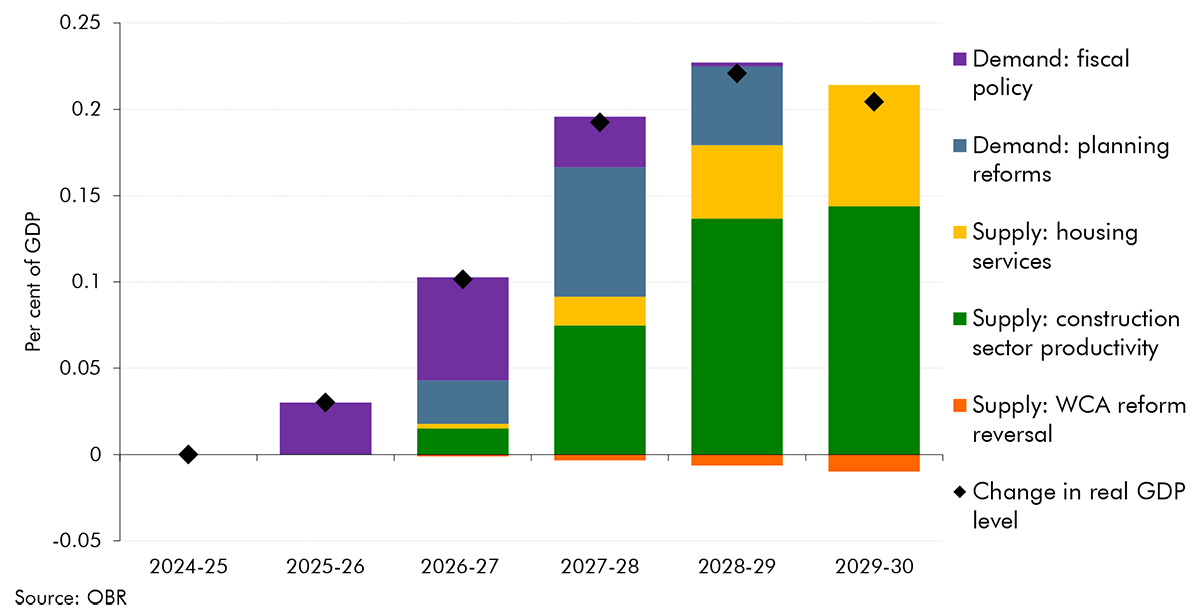
In this box, we discussed the impact that policy changes and announcements since October have on our economy forecast. Specifically, we looked at how the policy package and planning reforms affect real GDP and inflation, before also considering the impact of welfare reforms and its potential future impact.
The Pathways to Work Green Paper announced a range of welfare measures, some of which we have not incorporated in this forecast. In this box, we explained why some measures were not included, and indicated what risks they pose to our welfare spending and labour supply forecasts.
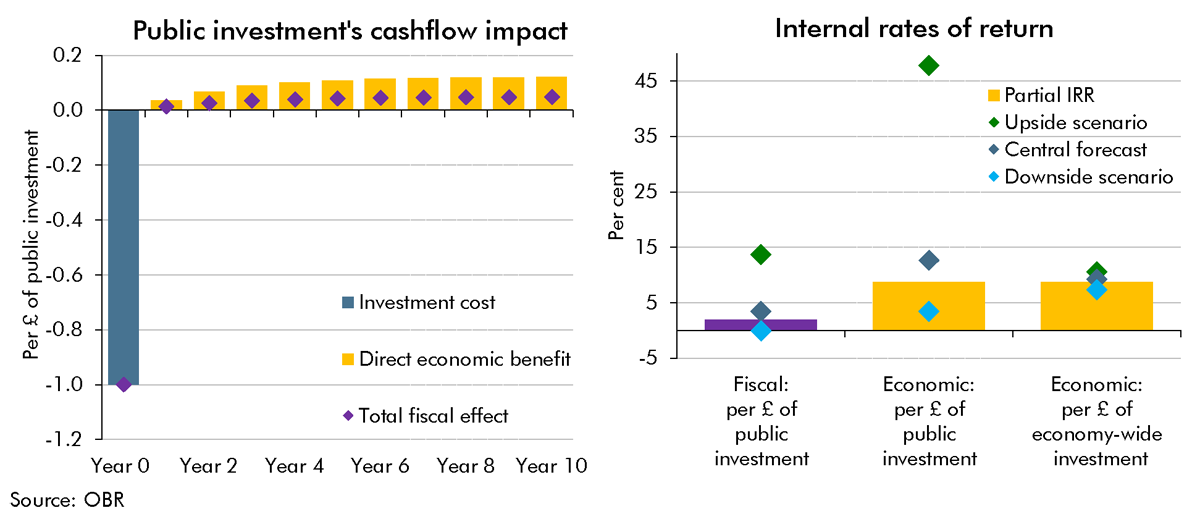
A key uncertainty around the long-run impact of the Budget's plans for higher public investment is the extent to which the public capital stock is a complement to (or substitute for) business investment. This Box provided scenarios in which the future business capital stock was higher or lower than we had assumed in our central forecast. We showed these scenarios' impacts on potential output in 50 years' time and the implications they had for different measures of the internal rate of return on investment.
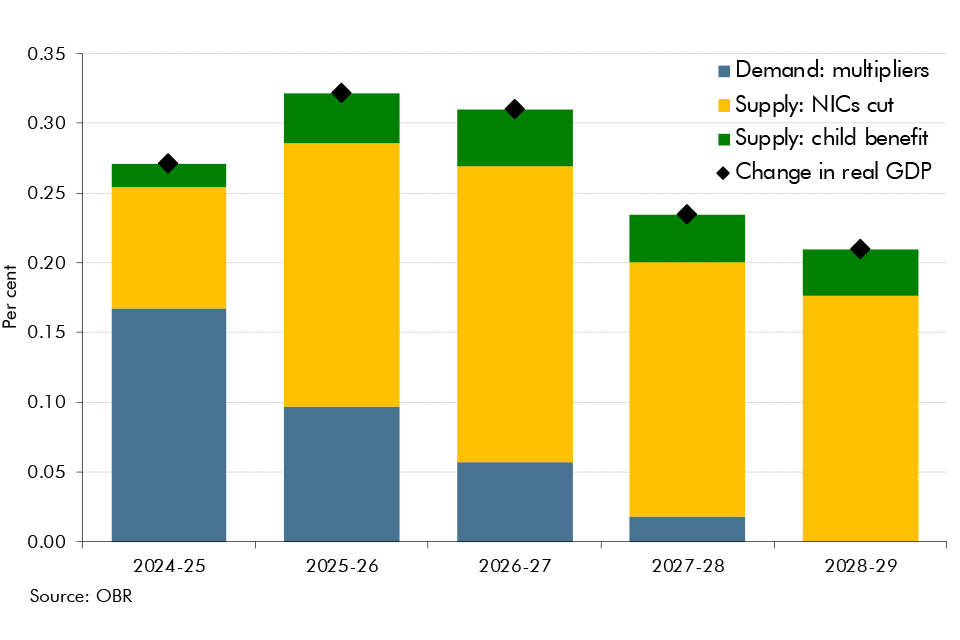
In each Economic and fiscal outlook we publish a box that summarises the effects of the Government’s new policy measures on our economy forecast. These include the overall effect of the package of measures and any specific effects of individual measures that we deem to be sufficiently material to have wider indirect effects on the economy. In our March 2024 Economic and fiscal outlook, we adjusted our forecast to account for fiscal loosening and considered the effects of policy to boost employment on our potential output forecast.
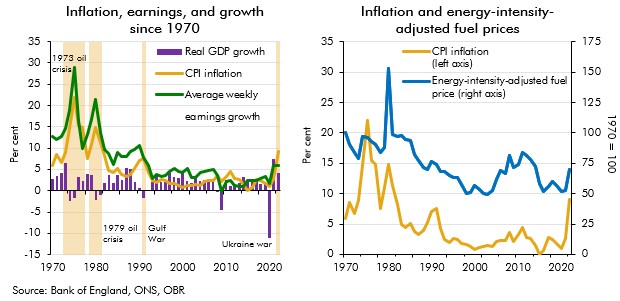
Our recent forecasts have significantly underestimated inflation outturns, with the March 2021 underestimation of inflation in 2022-23 being the largest difference between forecast and outturn since the OBR began forecasting in 2010. In this box we explored the reasons that might have driven these differences since our March 2022 forecast. In particular, we considered the extent to which the knock-on effects of higher energy prices on CPI inflation might have been higher than we originally assumed.
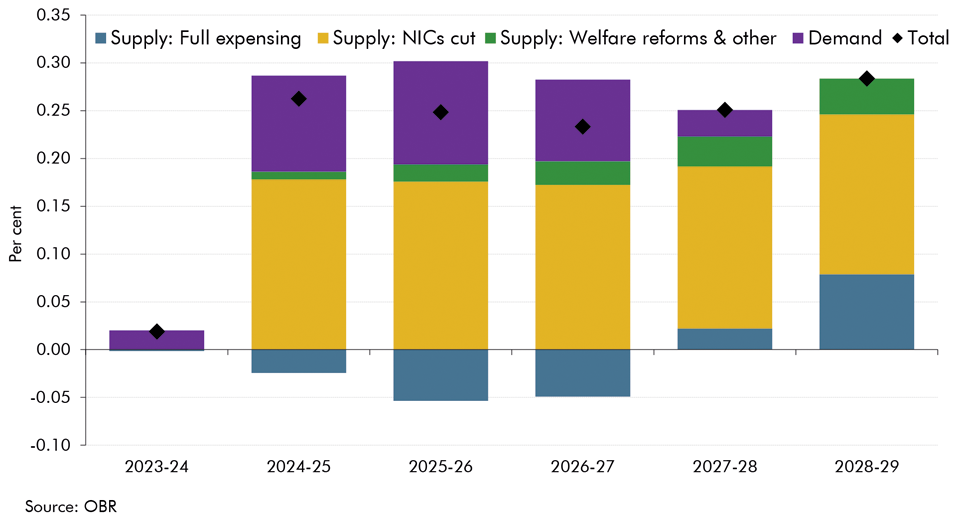
In each Economic and fiscal outlook we publish a box that summarises the effects of the Government’s new policy measures on our economy forecast. These include the overall effect of the package of measures and any specific effects of individual measures that we deem to be sufficiently material to have wider indirect effects on the economy. In our November 2023 Economic and fiscal outlook, we adjusted our forecast to account for permanent full expensing and fiscal loosening. And, we considered the effects of policy to boost employment on our potential output forecast.
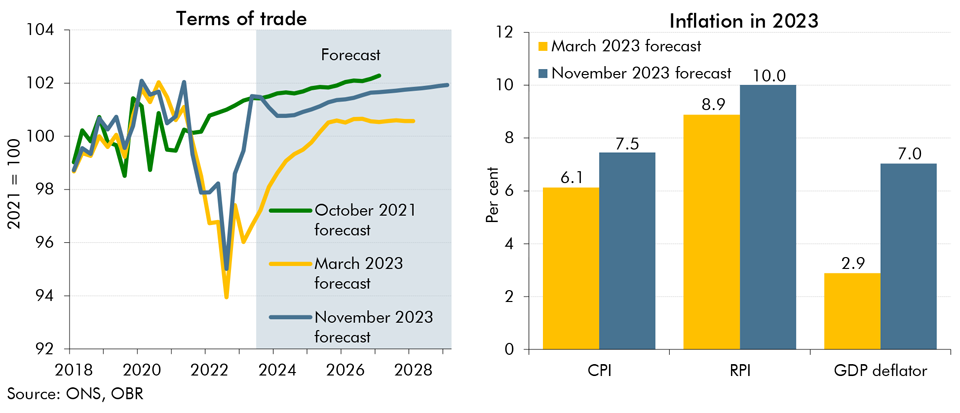
In our November 2023 forecast we expect inflation to be both more persistent and more domestically generated than in March. In this box we explored the reasons behind our assessment for inflation to be more domestically rather than externally driven and its implications for the public finances.
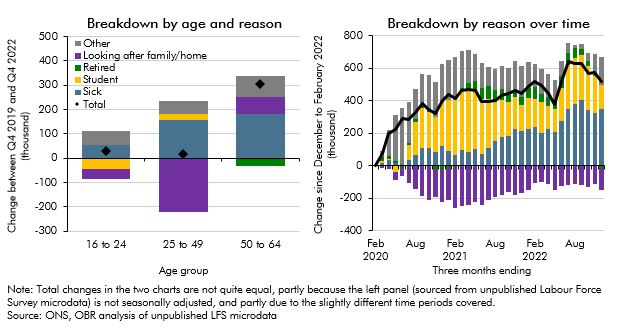
Economic inactivity rose significantly following the pandemic. This box explored the factors behind this rise, including decomposing it into different age brackets and considering the reasons behind it, as well as analysing the flows into and out of inactivity.
In each Economic and fiscal outlook we publish a box that summarises the effects of the Government’s new policy measures on our economy forecast. These include the overall effect of the package of measures and any specific effects of individual measures that we deem to be sufficiently material to have wider indirect effects on the economy. In our November 2022 Economic and fiscal outlook, we adjusted our economy forecast to take into account plans for the energy price guarantee (EPG) and consider the impact of tax and spending measures on the supply side of the economy.
Persistently higher energy prices can reduce the supply capacity of the economy. In this box, we use a production function to estimate the impact of higher fossil fuel prices on potential output.
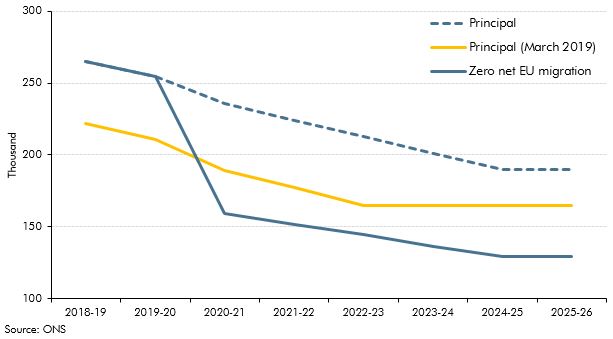
The Government announced plans for a new 'points based' immigration system set to come into place in 2021 that will align migration policy for EU and non-EU migrants. In this box, we considered the impacts of this new system on the outlook for potential output growth.
In our November 2016 forecast, our first following the June 2016 referendum, we revised down our potential growth forecast, primarily reflecting the effect of weaker business investment on productivity growth. To give some context to our central forecast judgements, this box outlined a number of channels through which the decision to leave the EU could affect potential output and the uncertainty associated with estimating these effects.
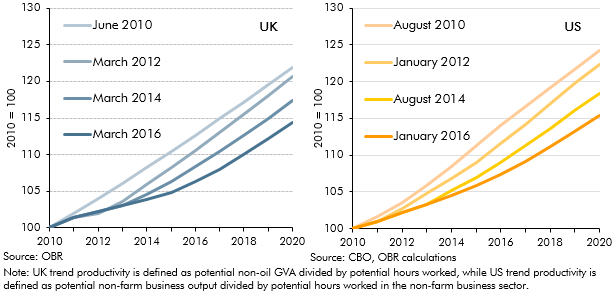
The path of productivity growth is a key driver of GDP growth in our forecast and is also one of the most uncertain judgements. In March 2016, given persistent weakness in outturn data, we revised down our forecast for productivity growth. But this issue was not specific to the UK, with productivity having disappointed in many other major advanced economies. This box compared different vintages of UK and US productivity and potential output forecasts since 2010 to illustrate this point.

In our 2015 Fiscal sustainability report, we assumed that GDP grows in line with its historical trend. This in effect implied 47 years of uninterrupted trend economic growth in our central projections. This box considered the alternative paths for debt as a share of GDP under an symmetric and asymmetric cycle, highlighting the sensitivity of the net debt projections to economic cycles.
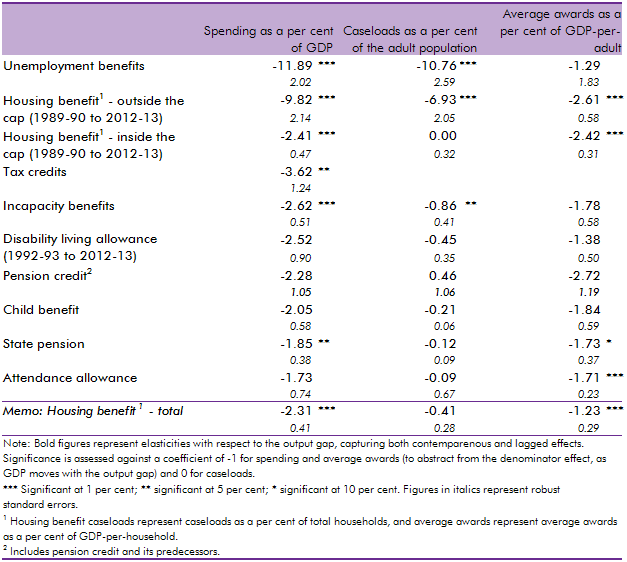
In our 2014 Welfare trends report, Chapter 4 reviewed the overall trends in welfare spending. In this box, we considered how responsive welfare spending is to the economic cycle by estimating the elasticity of benefits and tax credits spending as a share of GDP with respect to changes in the output gap (the difference between actual GDP and an estimate of its potential or underlying level). We found that the most counter-cyclical benefits have caseloads closely associated with the economic cycle whereas mildly counter-cyclical benefits are likely to only exhibit cyclicality due to spending varying less than GDP, thereby producing a denominator effect.
In the February 2014 Inflation Report the Bank of England published more information about its assessment of spare capacity. This box compared that assessment with our own output gap estimate at the time, highlighting some conceptual differences between the two.
In early OBR forecasts we estimated a significant negative output gap following the late-2000s recession, which we did not expect to have closed by the end of the forecast horizon. Our March 2013 forecast implied that potential output would be 14.6 per cent below an extrapolation of its pre-crisis trend after five years, with actual output a further 2.3 per cent below that. This box examined the implications of that forecast, as well as the fiscal implications of some possible alternative assumptions.
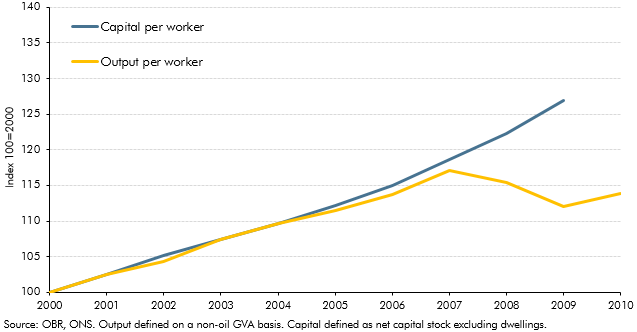
Our latest estimates of the output gap - which extended up to the third quarter of 2012 - implied a narrowing of the output gap since our previous forecast, despite actual output having remained broadly flat. Given the strength in the labour market over the period suggested a sharp fall in trend total factor productivity (TFP). This box set out the methodology behind that assessment, based on a production function approach that allowed us to separate out productivity growth into contributions from capital deepening and TFP.
Potential output growth had been relatively weak in the period following the late-2000s recession. This box discussed some possible reasons, noting that indicators available at the time did not indicate a structural deterioration in the labour market.
In our central forecast, interest rates are assumed to evolve in line with financial market expectations. For alternative economic scenarios which involve different paths for the output gap and inflation, it is useful to specify rules for the way monetary policy is set and for how output and employment will respond. In this box, we set out the rules that governed those relationships in the scenarios we analysed in the March 2011 Economic and fiscal outlook: a persistent inflation scenario and a weak euro scenario.
Following the June 2010 Budget, the Government set out further details of the planned reductions in government expenditure in its 2010 Spending Review, including additional measures to reduce welfare spending. This box discussed the possible ways in which these measures could affect the economy's trend growth rate.
Net migration is an important source of growth in the working-age population. It therefore influences the economy’s trend growth rate by affecting potential labour supply growth. In this box in our first full Economic and fiscal outlook in November 2010, we considered how changes in migrant employment and productivity could affect whole economy employment and productivity.