
Economic inactivity rose significantly following the pandemic. This box explored the factors behind this rise, including decomposing it into different age brackets and considering the reasons behind it, as well as analysing the flows into and out of inactivity.
This box is based on ONS data from February 2023 .
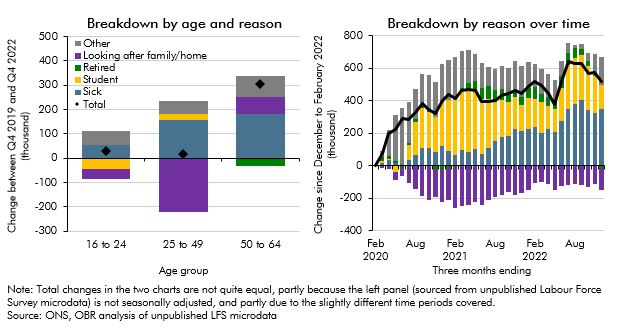
Inactivity among over 16s has risen by 830,000 since the pandemic. Over 64s account for 310,000 of this rise, as the ‘baby boom’ population bulge created by the high birth rates in the decades after the Second World War increasingly shifts into retirement age. This demographic effect has long been reflected in our forecasts. But the remaining 520,000 increase among 16-to-64-year-olds has been a more concerning post-pandemic surprise. This box splits inactivity into age groups, and by self-reported main reason, to analyse this development.
Chart C: Change in 16-to-64-year-old inactivity
Inactivity by age
The change in the number of working-age inactive people between the fourth quarter of 2019 and the fourth quarter of 2022 has been largely driven by older age groups,a with 50-to-64-year-olds accounting for 310,000 of the overall increase in the stock (left panel of Chart C). The number of inactive 16-to-24-year-olds have risen by 30,000, whereas inactivity among 25-to-49-year-olds has only risen by 15,000 (although, as discussed below, there has been a significant change in the composition of inactive people).
Chart D: Inflow and outflow rates to and from inactivity by age group
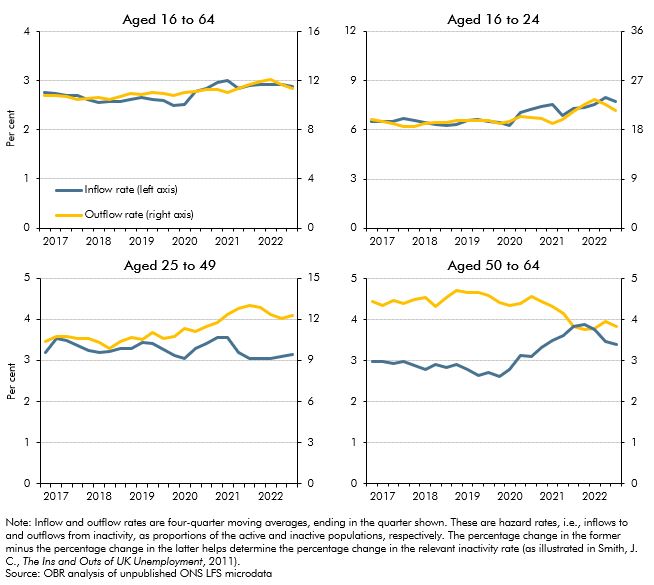
Looking at the flows into and out from inactivity (shown in Chart D, above) illustrates the drivers
of the changes:
- Among those aged 16 to 64 as a whole (top-left panel of Chart D) both inflow rates and outflow rates from inactivity have risen. But rising inflows have more than offset rising outflows to drive higher overall working-age inactivity.
- Among those aged 16 to 24 (top-right panel), the inflow rate into inactivity has increased since 2019 as more young people went into higher education. Outflows subsequently rose as higher education courses ended and this cohort of students entered the labour market. But to a lesser extent than inflows, leaving the inactivity rate slightly higher.
- Among those aged 25 to 49 inflows increased during the pandemic but have since returned to more normal rates (bottom-left panel). Outflow rates have increased and remained higher. This led to a temporary increase in the stock during the pandemic, but a reversal of the flow dynamics has now left the stock little changed.
- Among those aged 50 to 64 there was a big rise in inflows during the pandemic, which have remained elevated (bottom-right panel). The ageing of the ‘second baby boom’ generation (those born during the 1964 birth peak are now in their late 50s) will be a partial driver of this higher flow, as this cohort moves into age brackets where activity rates are typically lower. By contrast with the other age groups, the outflow rate has fallen and remains lower, so both rising inflows and falling outflows explain the increased stock.
Inactivity by reason
We can also look at the changes in inactivity by the main reason survey respondents offer for being inactive (right panel of Chart C). This breakdown is more challenging to interpret because many people have multiple, overlapping reasons for being inactive, and the one they rank as most important can change over time (e.g., as health conditions fluctuate) There is also recent evidence of elevated churn between different reasons for inactivity.b But it remains important for understanding the reasons behind the sharp rise in inactivity over the past three years:
- The pandemic did not initially interrupt the downward trend in those who cite looking after family or home as a reason for not seeking employment, which has fallen by 140,000 compared to immediately pre-pandemic (three months to February 2020), continuing a 530,000 (22 per cent) fall over the preceding decade. This group now accounts for 19 per cent of the working-age inactive population or 1.7 million people. The recent fall reflects the continuation of two pre-pandemic trends up until early 2021: a declining birth rate reducing the number of mothers of young children and rising maternal employment. Over the past 18 months this latter trend has reversed slightly.
- The pandemic did appear to encourage more people to go into, or stay in, education, with the number of people citing being a student as their main reason for inactivity rising from 2.1 million immediately before the pandemic to 2.3 million in the fourth quarter of 2022, and participation in full-time education among those aged 16 to 24 rising from 43 to 45 per cent. This temporary effect on labour participation is likely to unwind as this cohort graduates and joins the labour force.c For now, students constitute 26 per cent of the working-age inactive population and 5.5 per cent of the working-age population, compared to 25 per cent and 5.1 per cent respectively immediately before the pandemic.
- The pandemic also seems to have spurred some older workers to take early retirement. Inflows from activity to inactivity due to retirement rose, but were largely offset by an increased outflow from ‘retirement’ to the various other main reasons for inactivity. Retirement inflows are likely to have been facilitated by ‘forced’ savings and the rise in house and other asset prices during the pandemic (a view supported by the increased flow into inactivity from those in better-paid occupations)d. However, while the average retirement age for men rose steadily for two decades to reach 65.3 in 2020, and then fell to 65.1 in 2021, it then rebounded to a five-decade high of 65.4 in 2022. For women, this metric followed a very similar trajectory, returning to 64.3 – its pre-pandemic high – in 2022, suggesting that the pandemic accelerated retirement for one cohort of better-off older workers, rather than prompting a fundamental turnaround in recent trends.
- Over the past three years, the largest proportion of the increase in the stock of working-age inactivity has been people citing long-term sickness or disability as their main reason for inactivity. This group has increased by 350,000 to 2.5 million in the fourth quarter of 2022 and now accounts for 28 per cent of the total number of working-age inactive and 6 per cent of the working-age population. Reported rates of long-term sickness and disability had been rising among both the active and inactive working-age populations since at least 2010. The proportion of adults recorded as disabled rose from 16 per cent in 2013 to 20 per cent in 2019 and then to 22 per cent in 2022. But since the beginning of the pandemic the steady rise in participation among this group has stalled at around 57 per cent (having risen from 50 per cent in early 2013 to 58 per cent at the end of 2019).e Flows data suggest much of the increase in long-term sick came from those who were already inactive before the pandemic changing their reason for being inactive during it. Other evidence shows the change in the stock of the inactive due to long-term sickness mainly comprises those who have been out of employment for over three years.f
This box was originally published in Economic and fiscal outlook – March 2023