Potential output growth had been relatively weak in the period following the late-2000s recession. This box discussed some possible reasons, noting that indicators available at the time did not indicate a structural deterioration in the labour market.
This box is based on ONS investment and productivity data from October 2011 .
This box sets out some possible explanations for the slow potential output growth seen since the recession ended. Potential output growth can be decomposed into two elements: changes in the potential labour supply and in the underlying growth rate of productivity, which is affected by changes in capital per worker. These could have been affected in a number of ways.
The financial crisis may have reduced potential labour supply if increases in unemployment led to an increase in the structural rate of unemployment (the Non-Accelerating Inflation Rate of Unemployment, or NAIRU). While it is very difficult to measure the NAIRU in real time, available indicators do not yet point to a significant structural deterioration in the labour market (paragraphs 3.116 to 3.120). Indeed, the decline in employment has been smaller than might have been expected given the fall in output: while output remains just over 3 per cent below its pre-crisis peak, the level of employment has fallen by less than 1 per cent over the same period. As a consequence, measured productivity growth has fallen significantly since 2008: output per hour remains around more than 6 per cent below the pre-crisis trend, and lags well behind the recoveries following previous downturns (see Charts 3.4 and 3.5).
The significant fall in the level of investment during the downturn may have led to a reduction in the level of capital per worker, reducing the level of productivity. However, recent data suggest that the level of capital per worker continued to grow during the recession, even while output per worker fell (Chart A).
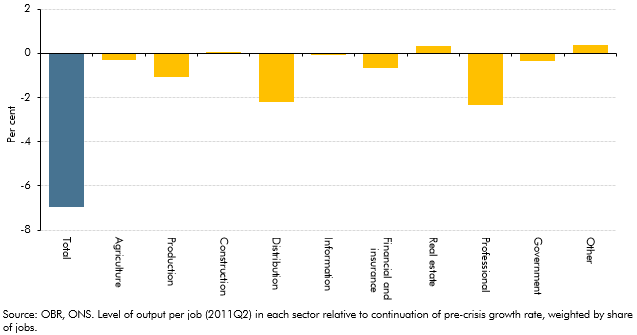
Output per worker growth may have slowed temporarily if changes in the sector distribution of employment had led to an increase in the employment share of low productivity sectors. However, the adjustment to productivity appears to have been reasonably broad-based, with most sectors still observing a shortfall in output per worker relative to the pre-crisis trend (Chart B). This suggests that the aggregate productivity slowdown has mainly reflected changes in productivity within sectors rather than shifts in employment between them.
Productivity growth may have been impaired by limited credit availability, arising from disruption in the financial sector. One possibility is that limited credit availability or forbearance on outstanding lending has prevented the reallocation of capital to more productive activities.a Low credit availability has been particularly acute for small and medium-sized enterprises. Analysis suggests that an impaired financial sector can lead to low productivity growth and that downturns associated with significant disruption to the financial sector are often characterised by large and persistent output losses.b,c
Credit constraints may also have reduced the scope for investment by firms in research and development and other efficiency improving measures, although such effects might be more likely to manifest themselves gradually over an extended period.
Changes in potential output growth are extremely difficult to identify and measure in real time, even with the benefit of hindsight and a longer run of data. But a lesson from studies of previous crises is that downturns associated with significant disruption to the financial sector are often characterised by large and persistent output losses.c
Chart A: Capital and output per worker
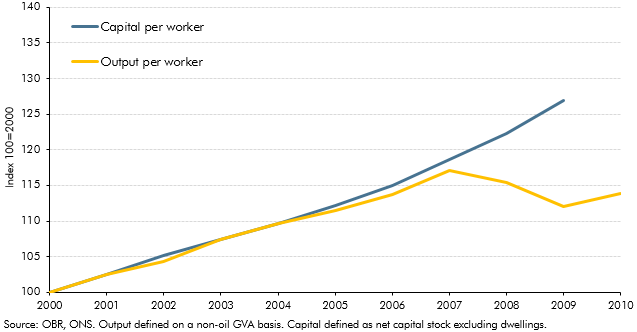
Chart B: Productivity shortfall by sector