Box sets » Economic and fiscal outlook - March 2023
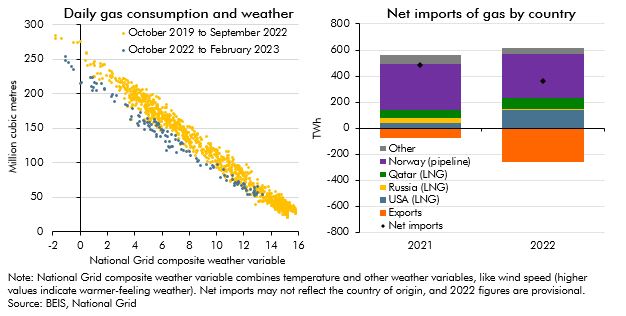
In response to the largest rise in energy prices in around 50 years, an immediate reduction in energy demand, and more gradual change in the composition of energy supply, might be expected. In this box we look at how the sharp rise in the household price of gas has changed households consumption of gas this winter as well as how the Russian invasion of Ukraine and the rise in wholesale gas prices has changed the UK's energy supply over the last year and how it may change further in the future. We then briefly outline how we forecast gas prices and why we do so.
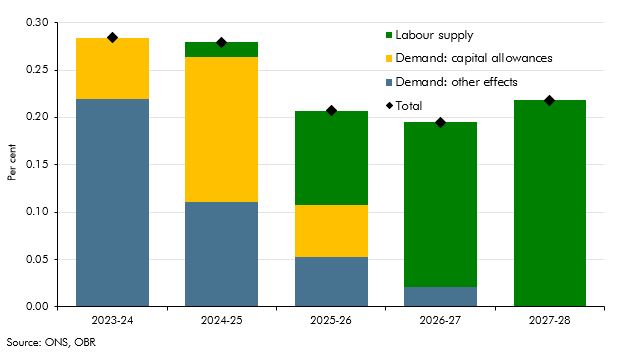
In each Economic and fiscal outlook we publish a box that summarises the effects of the Government’s new policy measures on our economy forecast. These include the overall effect of the package of measures and any specific effects of individual measures that we deem to be sufficiently material to have wider indirect effects on the economy. In our March 2022 Economic and fiscal outlook, we adjusted our forecast to account for the loosening of fiscal policy, including a temporary capital allowance. And, we considered the effects of policy to boost employment on our potential output forecast.
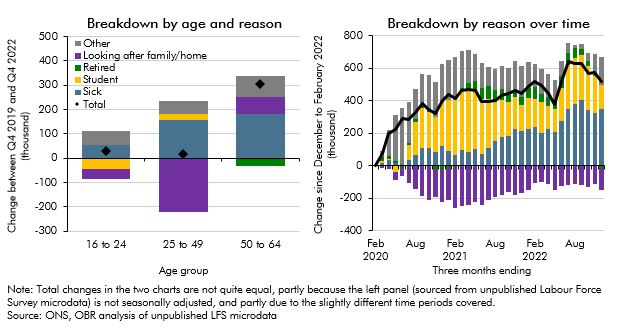
Economic inactivity rose significantly following the pandemic. This box explored the factors behind this rise, including decomposing it into different age brackets and considering the reasons behind it, as well as analysing the flows into and out of inactivity.
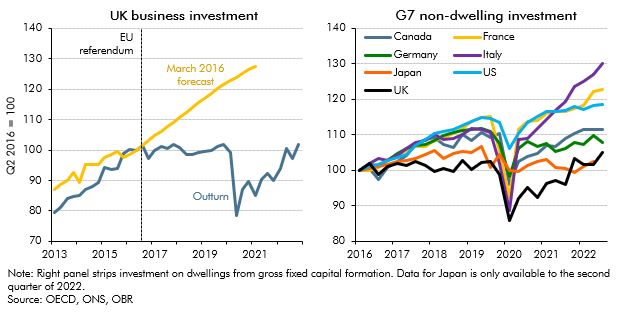
Since the June 2016 EU referendum, our forecasts have incorporated a set of assumptions about the economic impact of Brexit on trade, productivity, investment, and migration. In this box, we assessed our current assumptions against the latest evidence.
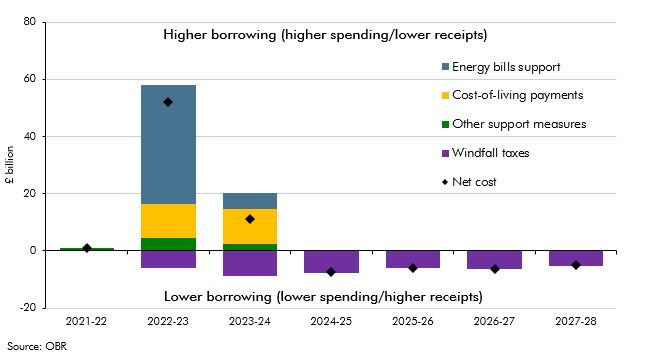
In the March 2023 EFO we estimated that the policy package in response to the rise in energy prices would cost £78 billion in 2022-23 and 2023-24. This box assessed how the cost of the UK Government's response compares internationally.
In November 2021 the Government appointed administrators for Bulb Energy Limited and provided facilities to cover Bulb's financing needs. This box described how we accounted for transactions with Bulb in our March 2023 forecast.
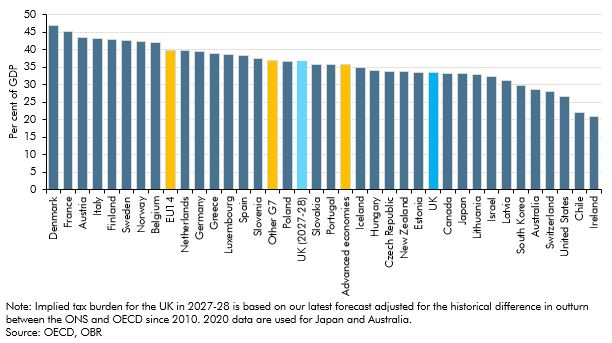
In our March 2023 Economic and fiscal outlook, we forecast that the UK's tax burden was set to rise to a post-war high. This box considered the UK's tax burden in international and historical context.
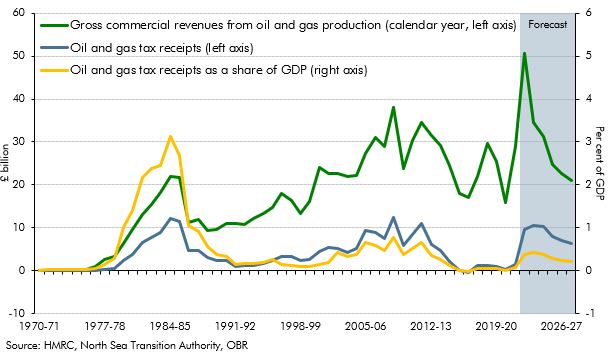
In our March 2023 Economic and fiscal outlook, we forecast that North Sea oil and gas receipts would rise sharply in the near-term to close to their all-time high in cash terms. This box explored the evolution of receipts since the discovery of North Sea oil and gas.
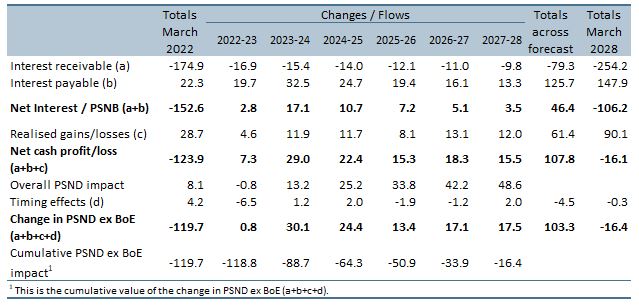
The Bank of England's Asset Purchase Facility (APF) conducts the Bank's operations for quantitative easing and tightening. Following sharp rises in interest rates in 2022 the APF has started to make large cash losses. This box looked at the causes of those losses and how they feed through to fiscal aggregates.
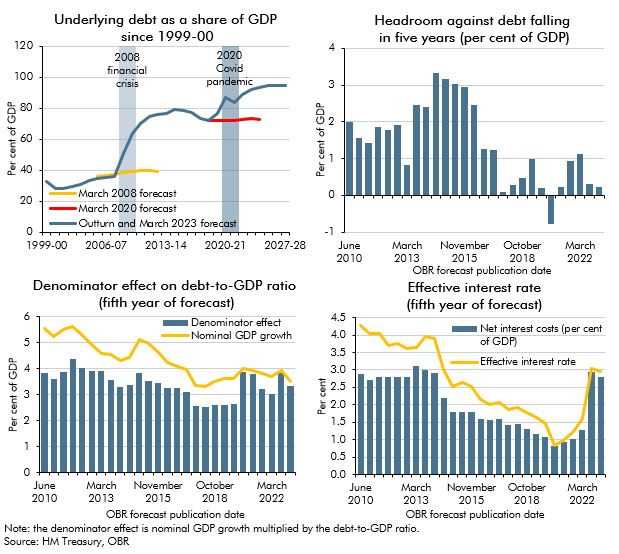
Since the financial crisis successive Chancellors have aimed to reduce debt as a share of GDP. This box looked at why that goal had proved difficult to achieve and in particular the challenges in our most recent forecasts.

