
Box sets » Public sector net borrowing

The UK’s fiscal position is increasingly vulnerable, by both historical and international standards. In this box, we considered the drivers of fiscal vulnerability, such as persistent large deficits, slower growth and higher interest rates, and the extent to which these may limit the Government's scope to respond to future economic shocks.
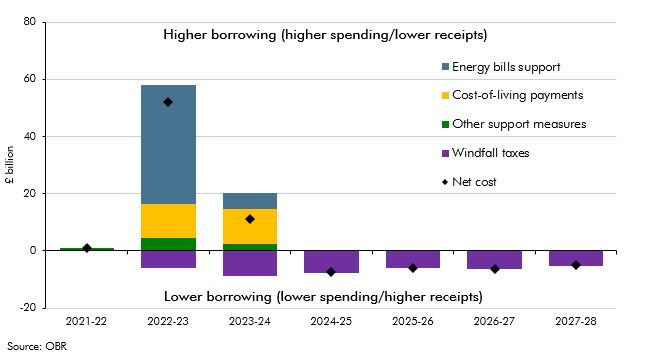
In the March 2023 EFO we estimated that the policy package in response to the rise in energy prices would cost £78 billion in 2022-23 and 2023-24. This box assessed how the cost of the UK Government's response compares internationally.
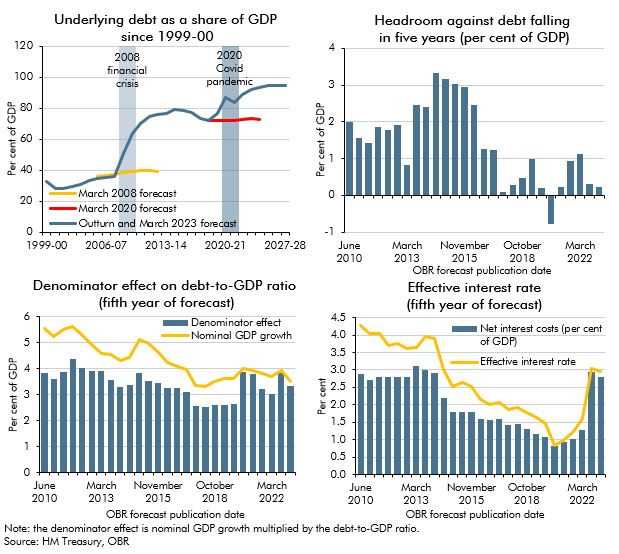
Since the financial crisis successive Chancellors have aimed to reduce debt as a share of GDP. This box looked at why that goal had proved difficult to achieve and in particular the challenges in our most recent forecasts.
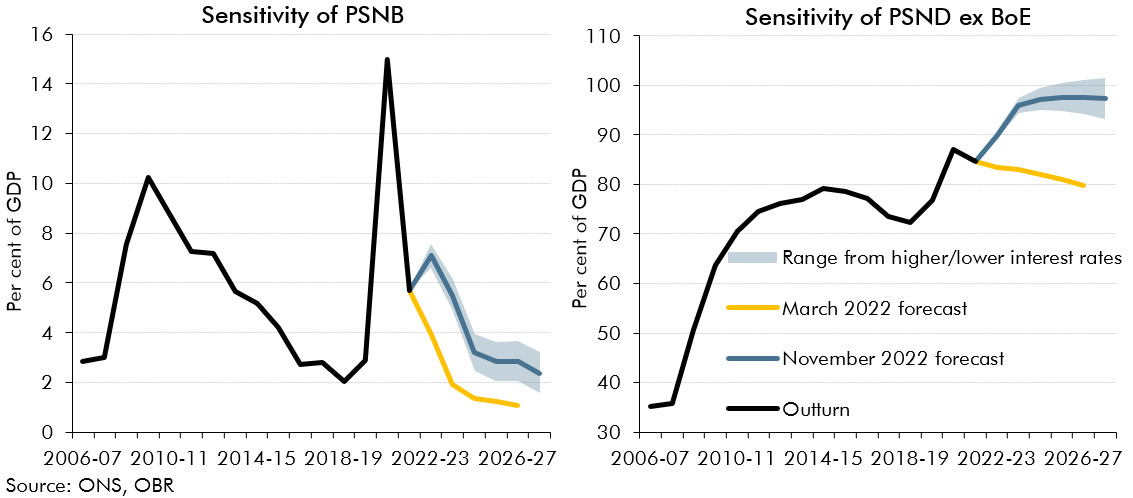
In 2022-23 we have seen sharp rises in gas prices and interest rates, both of which are forecast to remain elevated in 2023-24. This box presented the potential fiscal impacts of a higher-than forecast path for gas prices and two scenarios where Bank Rate is either a percentage point higher or lower than in our central forecast.
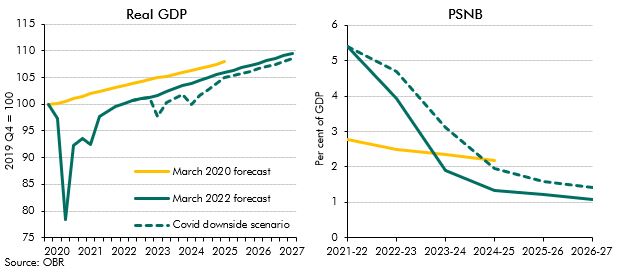
The possibility of a new vaccine-escaping Coronavirus variant cannot be ruled out. In this box we explored the possibility of such an escape and investigated the potential economic and fiscal consequences.

The pandemic generated only modest structural damage to the fiscal position but did still create a gap in what the Chancellor considered a sustainable fiscal position. This box compared the scale of fiscal consolidation facing the chancellor and his approach to repairing the public finances with the challenge that faced Chancellor George Osborne after the financial crisis.
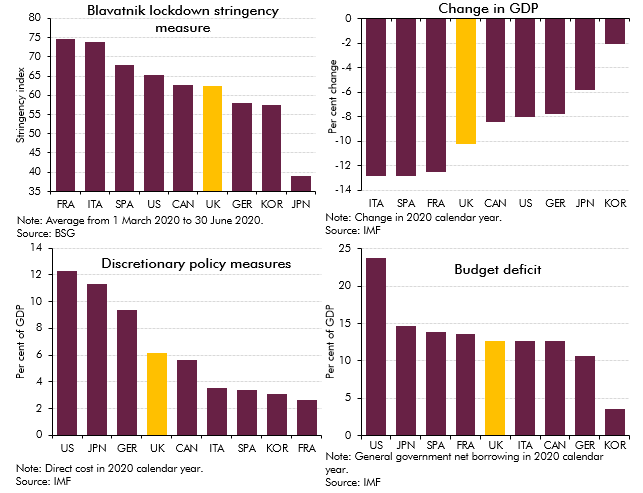
The coronavirus pandemic has hit the economic and public finances of all countries around the world as a result of lockdown measures imposed to control the outbreak and fiscal support provided to aid individuals and businesses. In this box we assessed how the UK had fared relative to other major advanced economics by looking at pandemic-related indicators and forecasts.
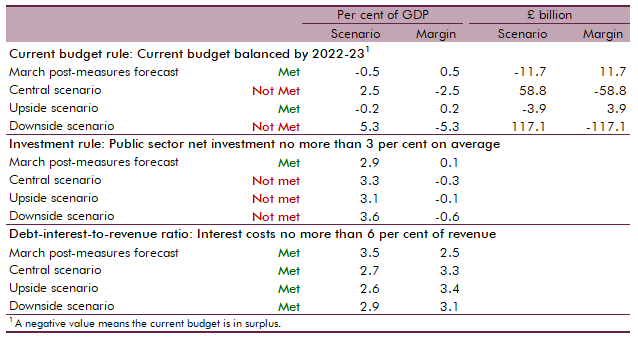
At Budget 2020 we assessed the Government's performance against the three proposed fiscal rules that featured in the Conservative Party's 2019 election manifesto. In this box we assessed whether the Government could meet these fiscal rules under our central, upside and downside scenarios.
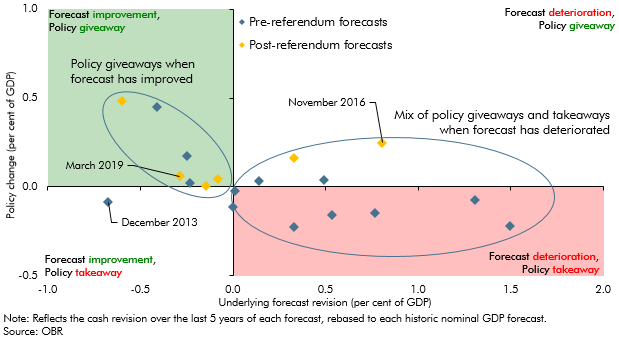
Presented with an improvement in the outlook for the public finances, the Government decided to loosen discretionary fiscal policy at this event. In this box we considered how Governments have responded to past pre-measures fiscal forecast changes.

One unforeseen economic development affecting our March 2016 forecast was the upside surprise in inflation in 2017-18 as a result of the fall in the exchange rate. This box described the effect of that surprise on receipts, spending and borrowing.
In each Economic and fiscal outlook we incorporate the impact of the policy decisions announced in the Chancellor’s Budget or other fiscal statement (the ‘fiscal event’). This box looked at how measures announced at the previous 16 fiscal events had tended to announce near-term giveaways but with the promise of takeaways in the later years. The Autumn Budget saw this pattern repeated.
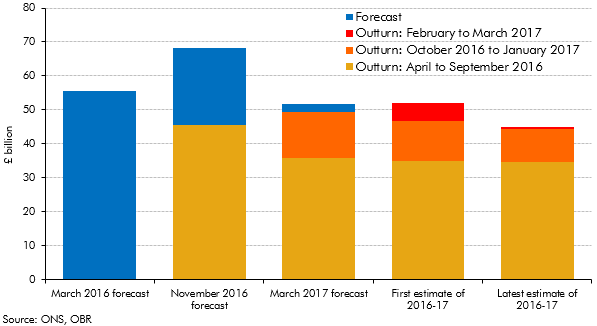
Initial estimates of the deficit can be revised significantly over subsequent months as more reliable data become available. This box set out how our forecasts during 2016 and 2017 evolved and how the outturns for 2016-17 were revised over time.
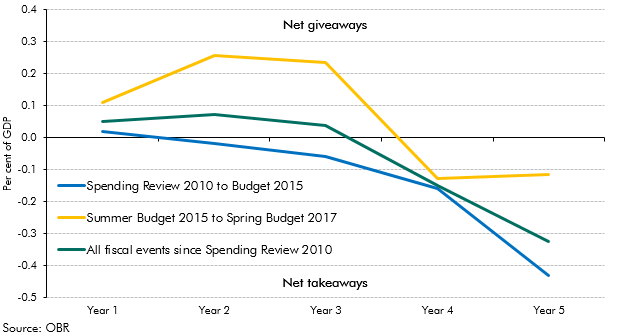
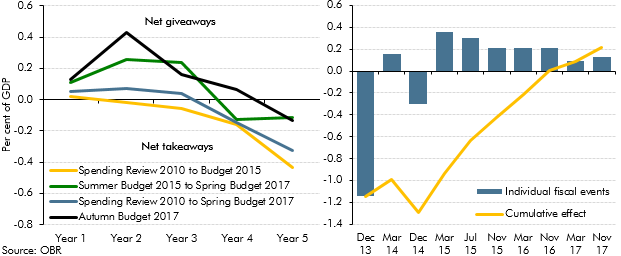
In each Budget or Autumn Statement, there are typically lots of policy giveaways (tax cuts or spending rises) and takeaways (tax rises or spending cuts). The net effect of these will be to raise or reduce borrowing in specific years and on average over the five years of the forecast – in other words to loosen or tighten fiscal policy. In this box from our 2017 Fiscal risks report we considered the pattern of those policy changes since 2010, noting that near-term giveaways are often financed by the promise of medium-term takeaways.
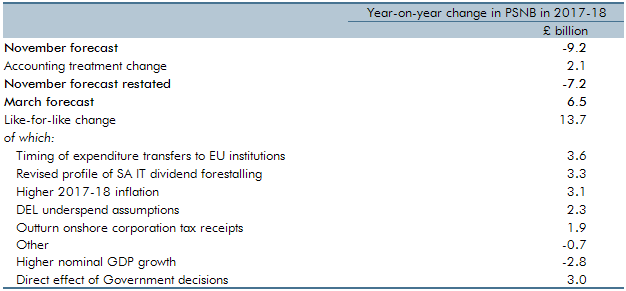
For the first time in any Economic and fiscal outlook, our March 2017 forecast showed post-measures borrowing rising year-on-year in one year of the forecast – 2017-18. This box explored the factors that explained why borrowing was expected to rise in that year, when our November 2016 forecast had assumed it would continue to fall.
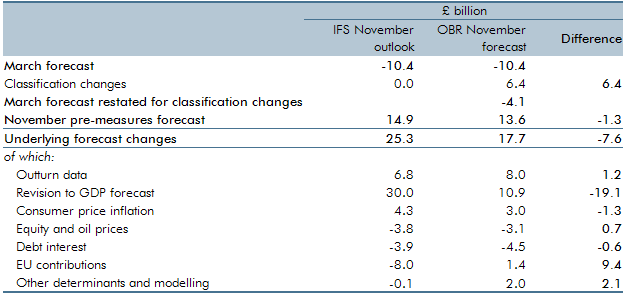
Ahead of the Chancellor’s Autumn Statement and our November 2016 Economic and fiscal outlook, the Institute for Fiscal Studies published an assessment of the outlook for the public finances. In this box, we described the differences between our new pre-measures forecast and that assessment.
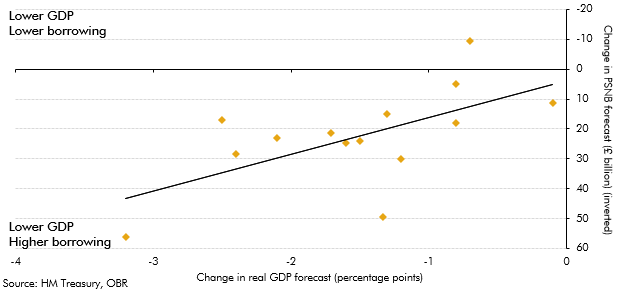
Our 2016 Forecast evaluation report was published around four months after the EU referendum was held. Over that period forecasters had revised their real GDP growth and borrowing forecasts. This box summarised those revisions and the relationship between them. It illustrated the uncertainty that forecasters faced in trying to predict the impact of the referendum result and Brexit on the economy and public finances.
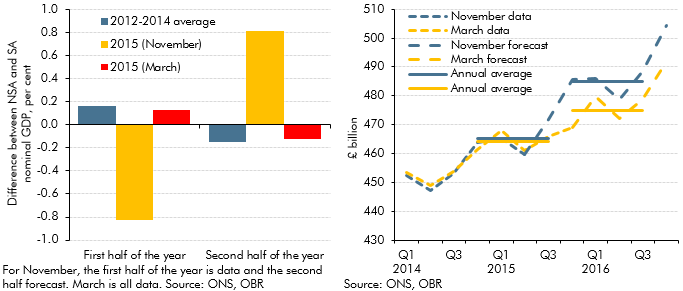
Our March 2016 Economic and fiscal outlook forecast was affected by an unusual quarterly profile of GDP growth on the non-seasonally adjusted measure that the Office for National Statistics uses as the denominator in fiscal measures. This box outlined that unusual pattern, how we had factored it into our forecast and the effects it had had on the profile of the debt-to-GDP ratio.
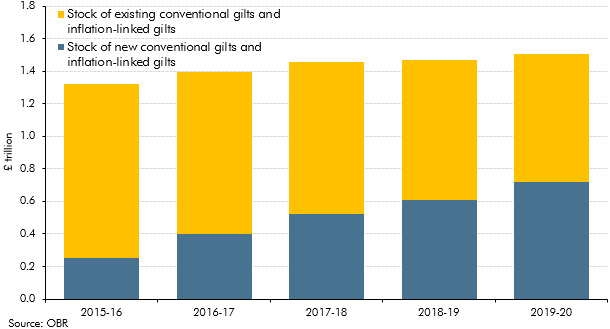
Our March 2015 Economic and fiscal outlook forecast highlighted large changes in our debt interest forecast since previous fiscal events and the added complexity that debt interest was expressed net of the effect of gilts held by the Bank of England Asset Purchase Facility (APF) associated with past quantitative easing. This box described how we produced the debt interest forecast and illustrated some of the sensitivities to which it was subject.
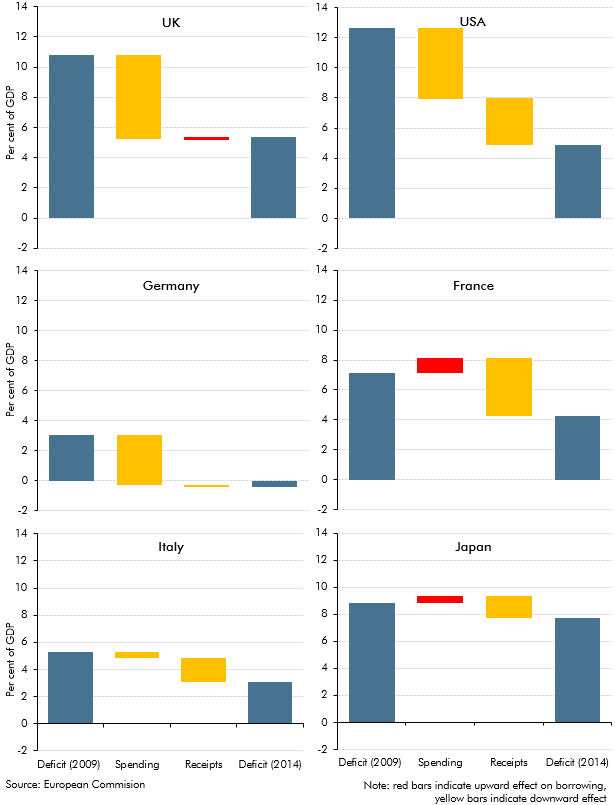
The UK budget deficit increased to a post-war high after the financial crisis and recession of the late 2000s. This box explored how the path and composition of deficit reduction in the UK over the subsequent 5 years compared to five other major economies.
Each autumn, we publish our Forecast evaluation report (FER), a detailed examination of the performance of past economic and fiscal forecasts relative to the latest outturn data. This box discussed cumulative errors in our June 2010 real and nominal GDP forecasts in light of the significant revisions made by the ONS to real GDP growth between mid-2010 and mid-2012, and the implications this has had for the performance of our June 2010 public sector borrowing forecast
Public finances data are subject to regular classification and methodological changes. This box outlined potential classification changes ahead of the PSF review. Annex B of our March 2014 EFO explained these changes in more detail.
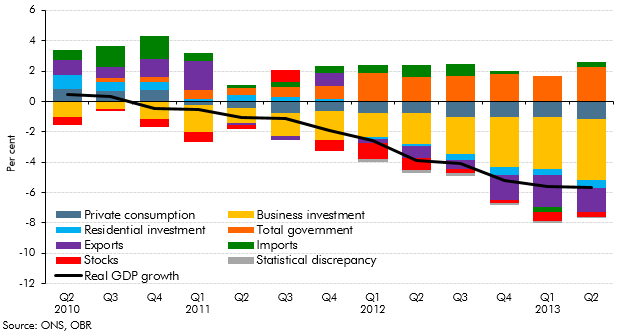
In October 2011, we published our first Forecast evaluation report (FER). This box summarised the key findings, including a discussion of weaker than expected GDP growth and why, despite this, public sector borrowing has fallen broadly as we expected it would.
During the financial crisis, both Bradford & Bingley (B&B) and Northern Rock (Asset Management) (NRAM) were transferred to public ownership. The ONS has announced that it will reclassify both bodies into the central government sector. This box outlined the impact of the reclassification on our fiscal forecast.
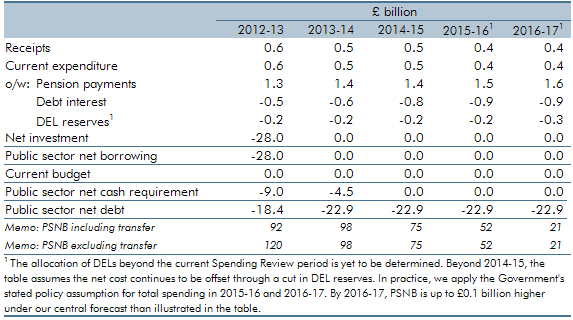
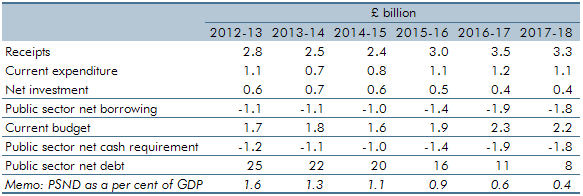
The Government announced that it intends to take on Royal Mail’s historic pension deficit with effect from April 2012. This box explored how the transfer of the relevant assets and liabilities will impact the public sector finances.
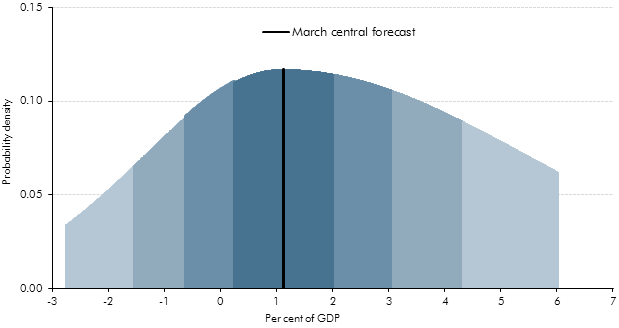
This box set out the methodology behind our PSNB fan charts. Briefing paper no.4: 'How we present uncertainty' sets out this methodology in more detail.
The Government announced in June 2011 that it intended to take on Royal Mail’s historic pension deficit with effect from April 2012. This box explored the provisional estimates of the impact this transfer had on the public finances.
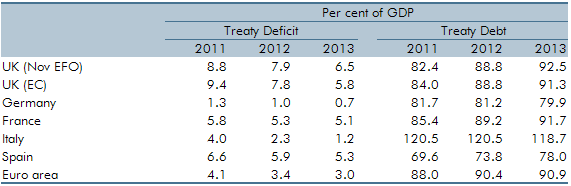
International organisations provide comparisons of deficit and debt levels. This box facilitated international comparisons by providing projections of Treaty debt and deficit on a calendar year basis.