Each autumn, we publish our Forecast evaluation report (FER), a detailed examination of the performance of past economic and fiscal forecasts relative to the latest outturn data. This box discussed cumulative errors in our June 2010 real and nominal GDP forecasts in light of the significant revisions made by the ONS to real GDP growth between mid-2010 and mid-2012, and the implications this has had for the performance of our June 2010 public sector borrowing forecast
This box is based on ONS GDP and Bank of England investment data from September 2013 and November 2013 respectively.
Each autumn, we publish our Forecast evaluation report (FER), a detailed examination of the performance of past economic and fiscal forecasts relative to the latest outturn data.
In our 2012 FER, we showed that despite much weaker real GDP growth than we forecast in June 2010, our public sector borrowing forecasts for 2010-11 and 2011-12 had performed relatively well. We concluded that this was largely because nominal growth had held up closer to forecast, which is more important for tax receipts. But the ONS has since made significant data revisions, doubling its estimate of real GDP growth between mid-2010 and mid-2012, while revising down its estimate of nominal GDP growth over the same period, as well as changing the composition of growth.
In light of these data revisions, we revisited the relationship between the performance of our economic and fiscal forecasts in this year’s FER. In June 2010, we forecast a slow but steady recovery, with real GDP growth of 8.9 per cent between the first quarter of 2010 and the second quarter of 2013. The latest data show that real GDP increased by 3.2 per cent over this period. The weakness relative to our forecast is mainly driven by weaker business investment than we expected, which is likely to reflect weak profitability, tight credit conditions and heightened uncertainty. Net trade has made a smaller contribution than forecast, due to euro area weakness and a smaller-than-expected response to sterling depreciation. Private consumption has also been weaker than forecast, as higher inflation squeezed real incomes in 2011. These differences were partly offset by a continued positive contribution from real government consumption and investment, which had been expected to subtract from growth.
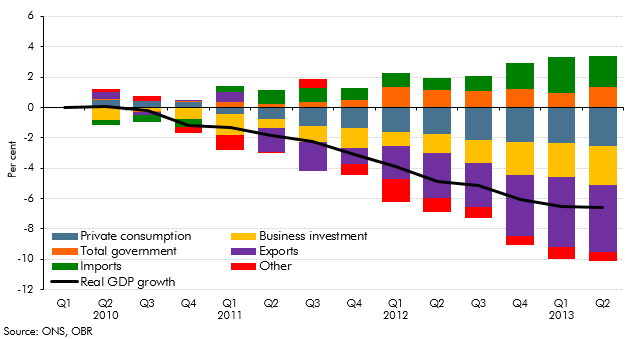
Charts A and B show the cumulative errors in our June 2010 real GDP forecasts alongside the errors in the Bank of England’s August 2010 forecast for the same period, drawing on an analysis of the Bank’s forecasts published for the first time in its November 2013 Inflation Report. The charts show that both institutions overestimated real GDP growth over this period by similar amounts. Our largest error was in overestimating the contribution to growth from business investment, then net trade and then consumption. The Bank’s errors were spread more evenly over the three spending categories. (It should be noted that the charts are not precisely comparable. We compare our published forecasts with the latest published outturn data. The Bank adjusted its projections to reflect the effects of subsequent methodological changes implemented in the 2011 Blue Book and then compared them to a ‘backcast’ of what it believes outturn GDP data will look like after future revisions.)
Chart A: Cumulative errors in June 2010 OBR real GDP forecast
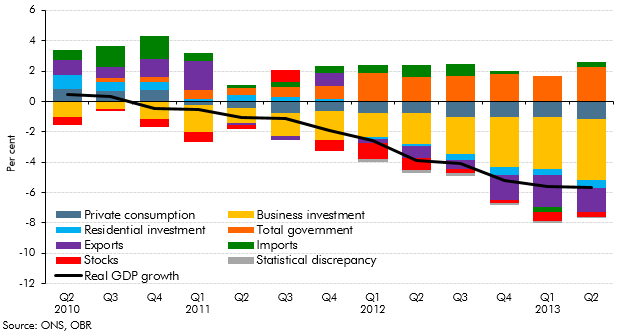
Chart B: Cumulative errors in August 2010 Bank of England real GDP forecast
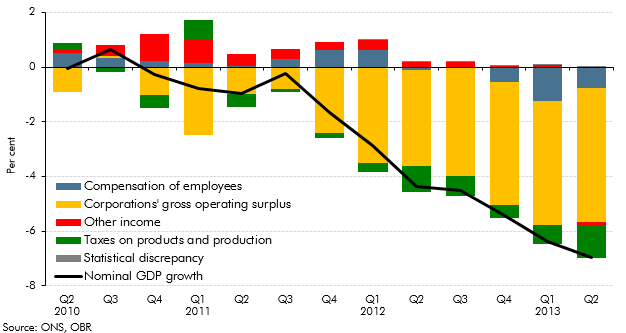
Nominal GDP growth has been revised down since our 2012 FER. As such, the data now suggest that it is the composition of nominal GDP that explains the performance of our June 2010 public sector borrowing forecast:
- in 2010-11 and 2011-12, the deficit continued to fall as forecast. The shortfall in nominal GDP compared to our forecast was in areas that are taxed relatively lightly – in private investment rather than private consumption and corporate profits rather than labour income (Chart C); and
- in 2012-13, our forecast for the budget deficit disappointed. While the shortfall in nominal GDP was still concentrated in private investment and corporate profits rather than private consumption, labour income was also weaker than our forecast, as subdued average earnings more than offset strength in employment.
Our March 2012 forecast took on board the ongoing weaknesses in the real economy, driven by disappointing productivity growth, tighter than expected credit conditions, prolonged weakness in the euro area and the failure of asset markets and interest rates to normalise. Yet, real GDP growth continued to disappoint as:
- weakness in private investment persisted and net trade deteriorated as conditions in the euro area failed to improve;
- productivity growth failed to pick up as forecast, which had further negative effects on labour income and nominal GDP; and
- North Sea production fell sharply.
The effect of these factors in lowering receipts was outweighed by larger-than-forecast underspending by central government departments and local authorities. This explains why public sector borrowing in 2012-13 was lower than our March 2012 forecast.
Chart C: Cumulative errors in June 2010 OBR nominal GDP forecast