
Presented with an improvement in the outlook for the public finances, the Government decided to loosen discretionary fiscal policy at this event. In this box we considered how Governments have responded to past pre-measures fiscal forecast changes.
Our pre-measures fiscal forecasts provide the baseline against which governments make the tax and spending policy decisions that determine our post-measures forecasts. Whether a government chooses to ease or tighten fiscal policy with an overall policy package will be guided by its legislated fiscal targets and any other fiscal objectives. Its choices will also be influenced by the nature of the changes to our pre-measures forecasts (for example, whether they are judged to be cyclical or structural). We maintain a database of fiscal forecast revisions that splits them into pre-measures, policy and classification factors, which allows us to look for any patterns in the way governments respond to good or bad news in our underlying forecast revisions.
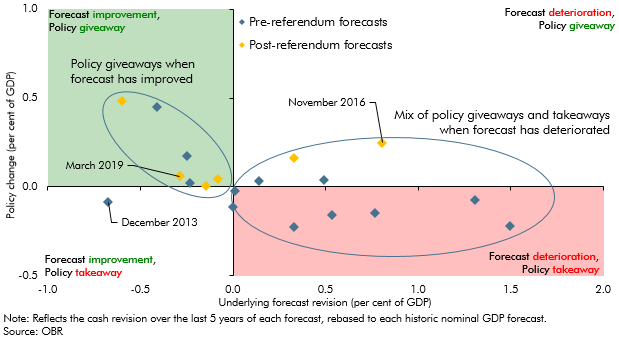
Chart 4.A shows policy responses to our pre-measures revisions since November 2010. The cumulative effect of policy decisions across each forecast period are shown on the vertical axis and are measured as the total cash effect on borrowing over the five-year period, as a share of total nominal GDP over the same period. This expresses the typical ‘£ billion’ effect of giveaways or takeaways in units that do not rise over time simply because the cash size of the economy is growing. Our pre-measures forecast changes are shown on the horizontal axis using the same metric. The effect of major classification changes has been stripped out. The chart shows that:
- When we deliver good news about the pre-measures outlook for the public finances, governments have tended to loosen fiscal policy. They have typically done this by easing the squeeze on public spending that had previously been the stated policy intent. On some occasions, this has involved raising plans in Spending Review years, but often it has been achieved by changing policy assumptions for departmental spending beyond the years for which plans have been set. (These assumptions have sometimes implied large real terms cuts that have been revised away before plans were set – for example the December 2014 assumptions that were raised in March 2015 and again in July 2015, ahead of the Spending Review in November 2015.) The only exception was in December 2013, when the Government ‘banked’ the good news in our borrowing forecast and added to it by squeezing medium-term spending even more tightly. Otherwise, downward revisions to pre-measures borrowing have always been met with a net policy giveaway. On average, these have offset the forecast improvement roughly one-for-one.
- When we deliver bad news about the pre-measures outlook, the average policy response has been more varied. In two-thirds of cases, the Government has responded by partly offsetting the deterioration, usually by squeezing spending further in the medium term. On average, this offset is much less than one-for-one. In the other third of cases, the Government responded by loosening fiscal policy. On two occasions this has happened alongside a change in the terms of the ‘fiscal mandate’ (including in November 2016).
- Since the Brexit referendum, fiscal policy has been loosened at every Budget, Autumn and Spring Statement, regardless of whether we have delivered good or bad news in our pre-measures borrowing forecast. The bulk of the cumulative net giveaway across these six fiscal statements has come via boosting public spending. In March 2016, our post-measures forecast showed public spending falling by 2.9 per cent of GDP between 2016-17 and 2020-21 – largely thanks to policy measures squeezing departmental and welfare spending. In this forecast, after successive policy giveaways – notably the boost to NHS spending announced last year – that fall is just 0.8 per cent of GDP and thanks entirely to the squeeze on welfare spending. The Government’s latest plans would leave public spending falling very slightly as a share of GDP between 2020-21 and 2023-24.
Chart A: Policy responses to underlying fiscal forecast revisions
This box was originally published in Economic and fiscal outlook – March 2019