
Since the financial crisis successive Chancellors have aimed to reduce debt as a share of GDP. This box looked at why that goal had proved difficult to achieve and in particular the challenges in our most recent forecasts.
This box is based on OBR and ONS data from February 2023 .
Successive Chancellors have committed, through their fiscal rules, to reduce the stock of debt as a share of GDP. All seven Charters since 2011 included an objective to put debt on a falling path. The first set a target year of 2015-16. Over time that target has been moved back several times, with the latest Charter aiming for five years ahead, which in this forecast is 2027-28.a Despite these targets, falls in outturn have been rare: underlying debt (excluding the Bank of England) fell from 2015-16 to 2018-19 and again in 2021-22 but rose in all other years. Underlying debt is now 23.5 per cent of GDP higher than it was in 2009-10, just before the first Charter was passed; and we expect it to be 7.4 per cent of GDP higher in 2027-28 than it is this year. Why has it proven so difficult to sustainably reduce debt as a share of GDP over the past decade and a half? There are five factors at play:
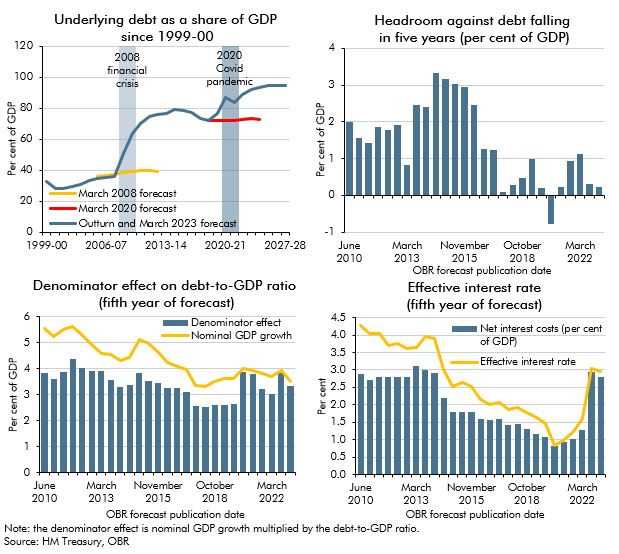
The first is the greater variety, severity, and frequency of shocks. Of the nearly 50 per cent of GDP increase in debt over the past 15 years, almost nine-tenths of it occurred in just four years – the two years after the financial crisis and the pandemic respectively. (Chart A, top-left panel).
The second is the small and diminishing headroom that successive Chancellors have given themselves against debt falling at the forecast horizon. In forecasts since November 2017, debt has typically been on track to fall by less than 1 per cent of GDP in the final year (and just 0.2 per cent in this forecast). This is a very small amount relative to the impact of the shocks we have faced, each of which have added over 10 per cent of GDP to debt. (Chart A, top-right panel).
The third is growth in items other than borrowing that add to debt. In 2027-28, these financial transactions add £27 billion (0.9 per cent of GDP) to debt (excluding the Bank of England). They include the share of student loan outlays and interest that is expected to be repaid, which adds £15.8 billion (0.5 per cent of GDP). They also include losses on Asset Purchase Facility gilt sales and redemptions that are met by the Treasury, which add £2.8 billion (0.1 per cent of GDP). The remaining £8.5 billion (0.3 per cent of GDP) comprises lags in the timing of tax payments (which mean cash tax receipts are recorded later than in accrued borrowing) and other factors (such as removing the interest that accrues on student loan balances).
The fourth is weaker medium-term growth prospects, which mean that Chancellors get less help from the denominator in the debt-to-GDP ratio. As a result of post-financial crisis weakness in productivity growth – and the consequences of Brexit, the pandemic and higher energy prices – we have progressively revised down our forecasts for nominal GDP growth in the medium term. This lowers the extent to which the debt-to-GDP ratio falls in the final year of the forecast due to the size of the economy rising relative to the stock of debt (Chart A, bottom-left panel).
The fifth is higher interest rates, which have tripled over the past year across advanced economies. The effective interest rate on UK public debt in the final year of our forecast has risen nearly 2.0 per cent in our March 2021 forecast to 3.1 per cent in this one (Chart A, bottom-right panel). That has pushed debt interest spending up from 1.2 per cent of GDP in 2020-21 to 3.3 per cent of GDP in 2027-28, adding to borrowing and debt.
Chart A: Challenges in getting debt to fall as a share of GDP
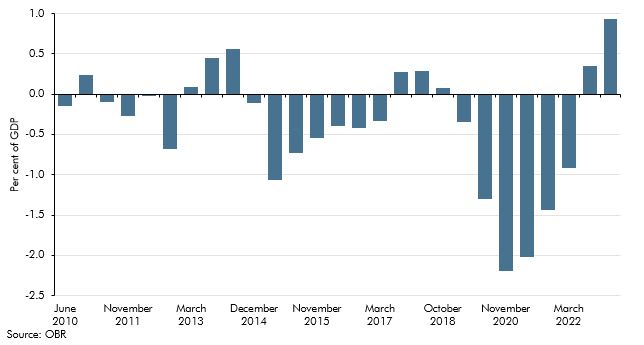
The combined effect of these factors has made it more difficult to get debt falling. Lower growth means that for any given level of debt, less can be borrowed without placing debt on a rising path. And higher interest rates acting on a higher debt stock means that for any given level of borrowing, more must be spent on debt interest and less on other priorities. Indeed, the debt-stabilising primary surplus (the measure of deficit or surplus that excludes net debt interest spending) in the final year of our latest forecast is 0.9 per cent of GDP. This is the highest level in any of the forecasts that we have produced since being established in 2010 (Chart B). On this basis, the Chancellor faces a tougher challenge than any of his post-financial crisis predecessors in turning around the sustained rise in the debt-to-GDP ratio.
Chart B: Debt-stabilising primary balance in the final year of successive forecasts
This box was originally published in Economic and fiscal outlook – March 2023