The UK budget deficit increased to a post-war high after the financial crisis and recession of the late 2000s. This box explored how the path and composition of deficit reduction in the UK over the subsequent 5 years compared to five other major economies.
This box is based on European Commission government finances data from March 2015 .
The UK budget deficit increased to a post-war high after the financial crisis and recession of the late 2000s. This box uses the European Commission’s recent Winter economic forecast to compare the main sources of deficit reduction in the UK and a selection of other major advanced economies on common definitions.
In the UK, general government net borrowing almost quadrupled from 2007 to reach a post-war high of 10.8 per cent of GDP in 2009, the drivers of which we discussed in Working Paper No.7: Crisis and consolidation in the public finances. Since then, borrowing on this measure has fallen by 5.3 per cent of GDP, due entirely to expenditure falling as a share of GDP. Despite real GDP growth, a narrowing output gap, very strong employment growth and net tax-raising policy measures, government revenues have been broadly flat as a share of GDP.
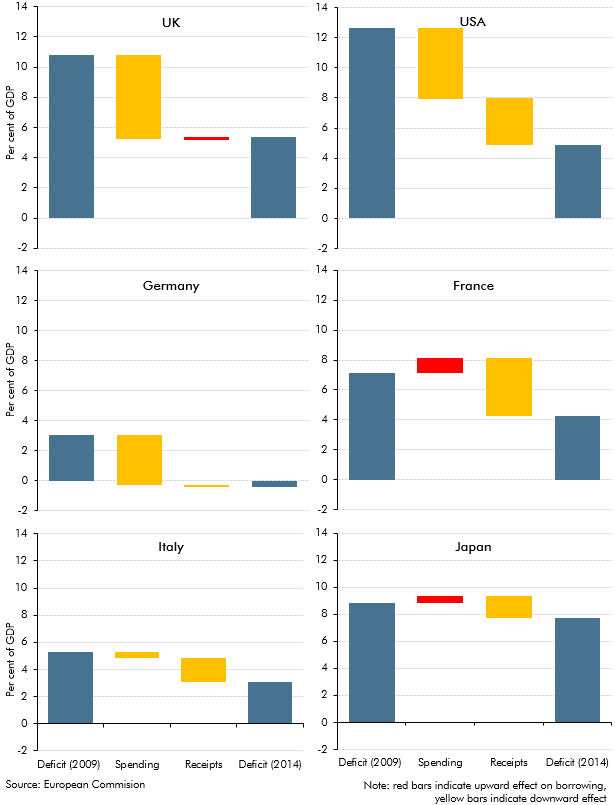
Chart B shows how changes in spending and revenue have contributed to falls in general government net borrowing as a share of GDP between 2009 and 2014 in six major economies:
- in the US, borrowing peaked at almost 13 per cent of GDP in 2009, the largest deficit in the G7. Lower spending and strong growth in revenues have contributed in broadly equal terms to reducing borrowing to around 5 per cent of GDP in 2014;
- borrowing in Japan has only declined slightly over this period. It remains at around 8 to 9 per cent of GDP, largely because spending has grown faster than national income – in part driven by a rapidly ageing population. Revenue growth has more than offset that rise in spending, including through an increase in the headline VAT rate to 8 per cent;
- France has also seen spending rise as a share of GDP, but overall borrowing has fallen – and has remained lower than in the UK, US and Japan – as revenues have risen by 4 per cent of GDP in the five years to 2014;
- in Italy, government borrowing was lower than in most other G7 countries in 2009, at just over 5 per cent of GDP, although net general government debt was over 100 per cent of GDP. Since 2009, borrowing has fallen by just over 2 per cent of GDP, reflecting both lower spending and higher revenues; and
- borrowing in Germany was the lowest in the G7 in 2009, at just 3 per cent of GDP. It increased to around 4 per cent in 2010, reflecting lower revenues, but then fell close to balance in 2012. In 2014, Germany was the only G7 country estimated to have run a budget surplus, at around half a per cent of GDP. Lower spending explains the majority of the move from deficit to surplus over the past five years.
So the UK began the period with the second highest deficit (after the US) and ended with the second highest (after Japan), despite the second largest fall among these countries. The contribution of lower spending to that fall was the largest among these countries. The UK was the only country where the deficit has not been reduced by having revenue growing faster than national income. That revenue weakness has come despite employment growth in the UK over the past five years having been the fastest among these countries. It largely reflects weakness in income taxes, due to policy measures and disappointing productivity and earnings growth.
Chart B: Sources of deficit reduction: an international comparison