
Box sets » International comparisons

The UK’s fiscal position is increasingly vulnerable, by both historical and international standards. In this box, we considered the drivers of fiscal vulnerability, such as persistent large deficits, slower growth and higher interest rates, and the extent to which these may limit the Government's scope to respond to future economic shocks.
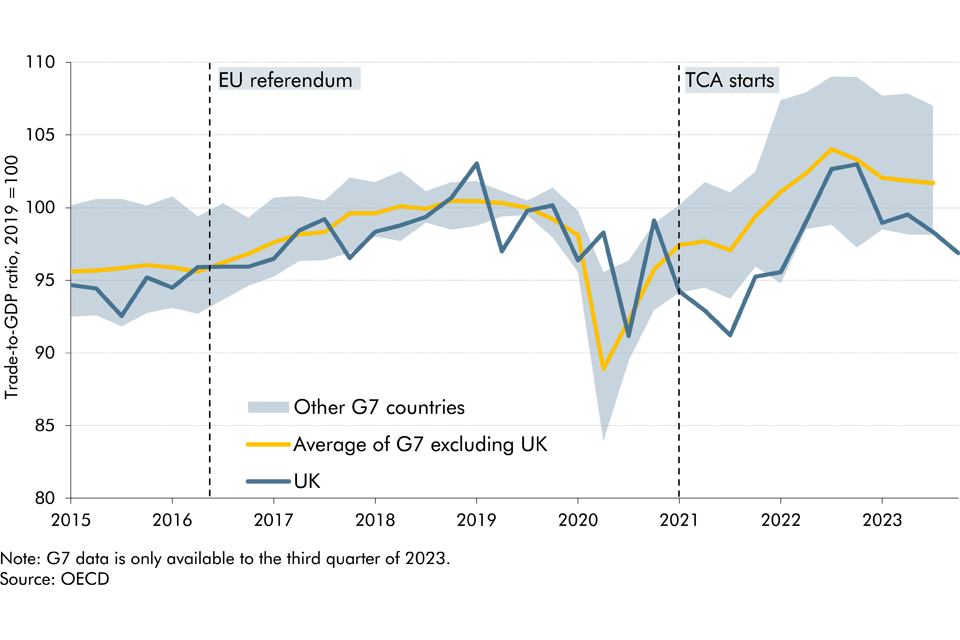
Since the June 2016 EU referendum, our forecasts have incorporated a set of assumptions about the economic impact of Brexit on trade, productivity, investment, and migration. In this box, we assessed our current assumptions on trade against the latest evidence.
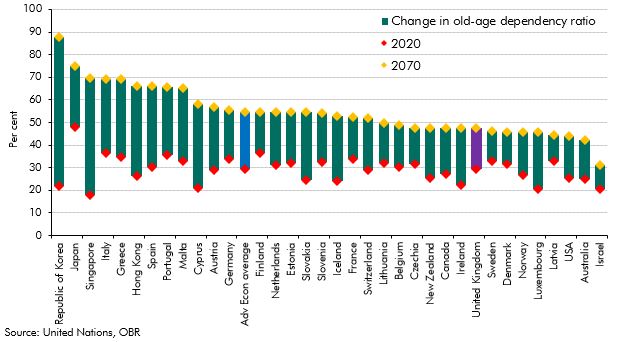
The populations of most advanced economies are ageing, placing new demands on these countries' public finances. This box explored why the UK population is forecast to age slower than most advanced economies over the next fifty years.
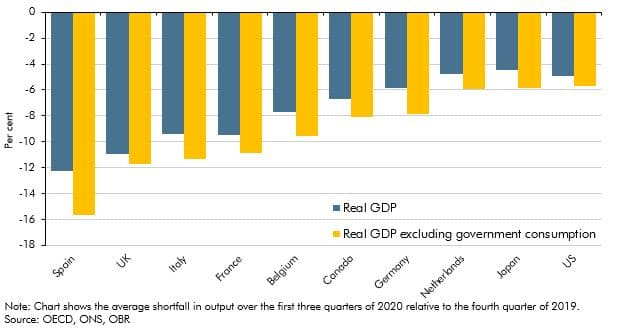
The coronavirus pandemic has affected economies of all countries around the world as a result of public health measures and voluntary social distancing. In this box we assessed how the UK had fared relative to other major advanced economics by examining the effect of using different measures of government output, the composition of these economies and the severity of the virus.
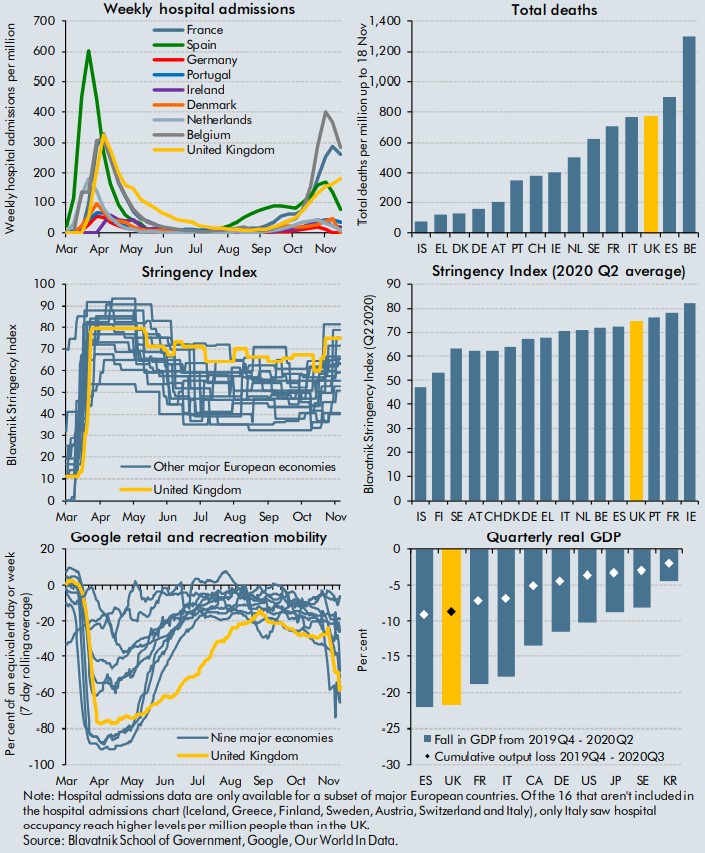
The coronavirus pandemic has forced governments around the World to introduce measures to curtail both the health, and economic impacts of the virus. This box aimed to compare the impacts on health and the economy of the virus with those of other selected countries, alongside the stringency of measures introduced by their respective governments.
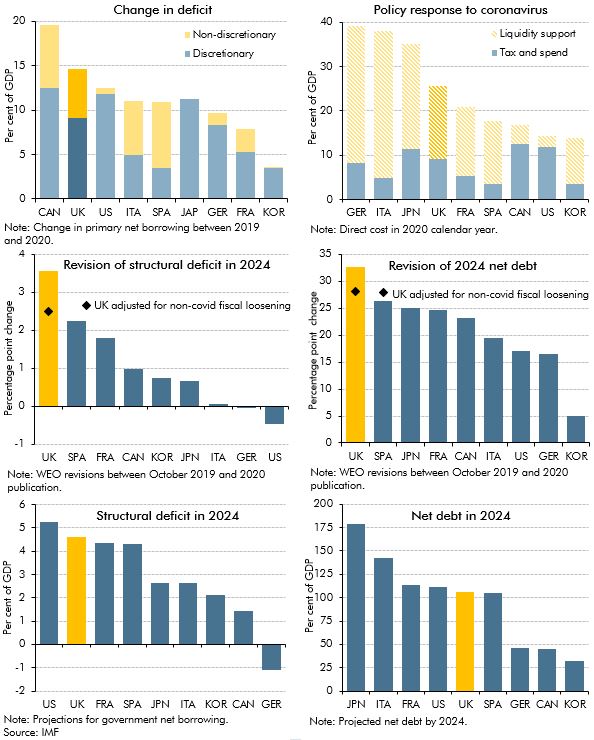
The pandemic has undoubtedly had a negative impact on public finances of countries around the world, but questions remain regarding the impact on the immediate and long-term fiscal positions of the UK relative to other major advanced economies. In this box, we considered the immediate term impact on primary deficits and the extent to which this reflected discretionary policy packages; the size of discretionary policy packages and the use of direct tax and spending policy versus liquidity support; and the impacts in the longer term on structural deficits and debt, including revisions between the IMF’s October 2019 and October 2020 WEO.
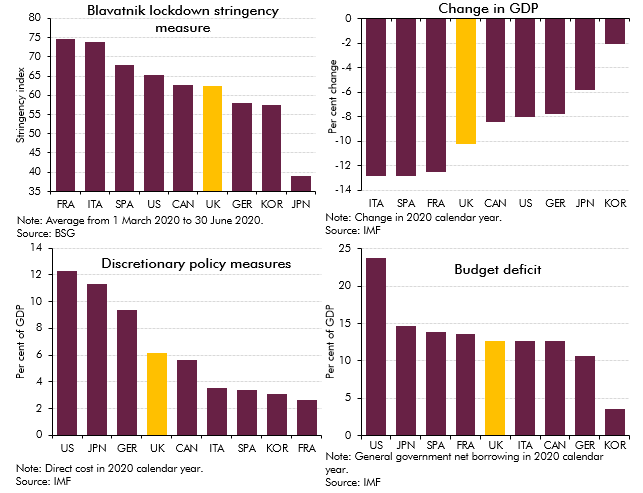
The coronavirus pandemic has hit the economic and public finances of all countries around the world as a result of lockdown measures imposed to control the outbreak and fiscal support provided to aid individuals and businesses. In this box we assessed how the UK had fared relative to other major advanced economics by looking at pandemic-related indicators and forecasts.
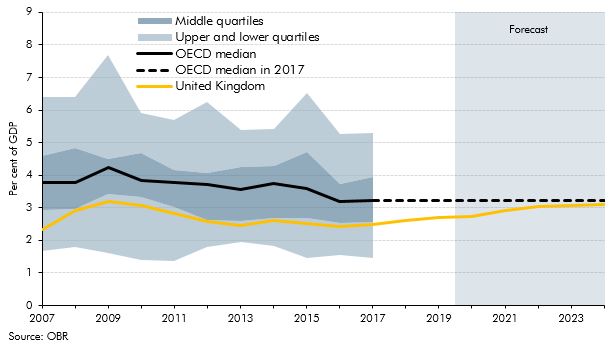
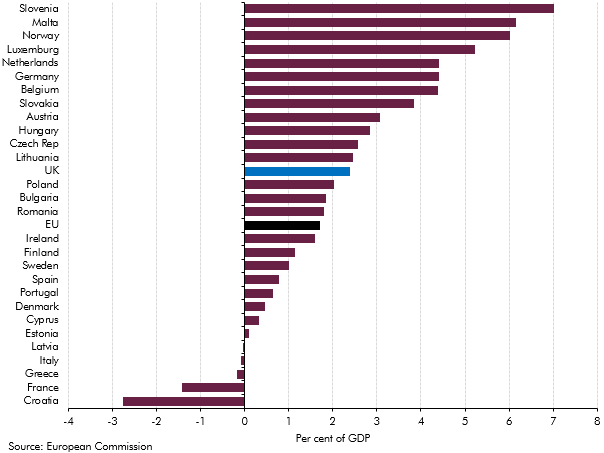
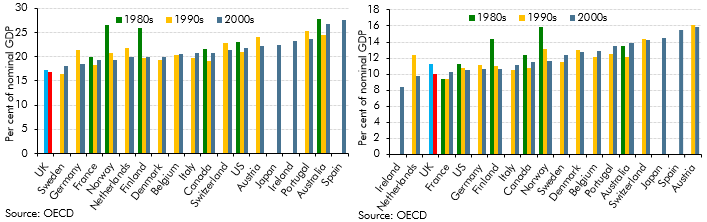
The Government committed to a significant boost to the path of capital spending. This box explored how UK government investment as a share of GDP has compared to other OECD countries and how our March 2020 forecast affects this picture.
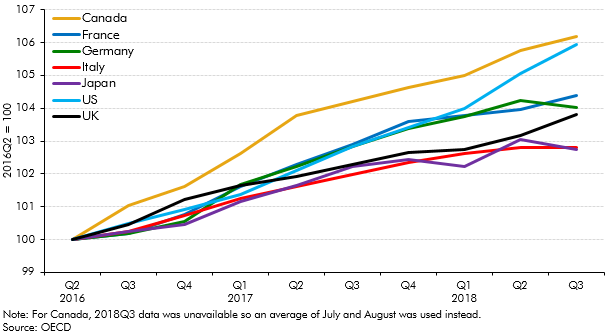
The vote to leave the EU had caused in a a slowdown in real GDP growth in the UK, with the main driver being weak investment growth. This box compared UK growth and investment since the referendum to that in the other major advanced countries in the G7.
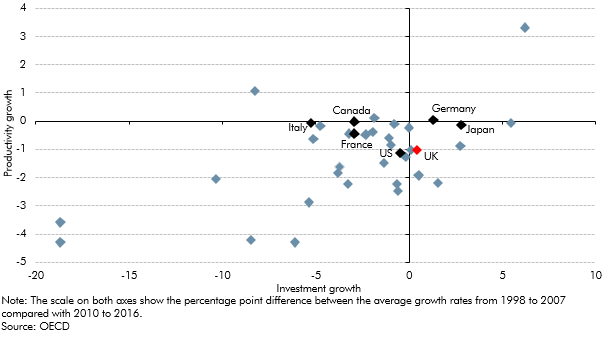
The outlook for productivity growth is one of the most important and yet uncertain areas of our economy forecast. In this box from our March 2018 EFO we looked at how actual productivity growth can be broken down into contributions from capital deepening and total factor productivity (TFP) growth and how differences in investment across countries could be related to post-crisis productivity performance.
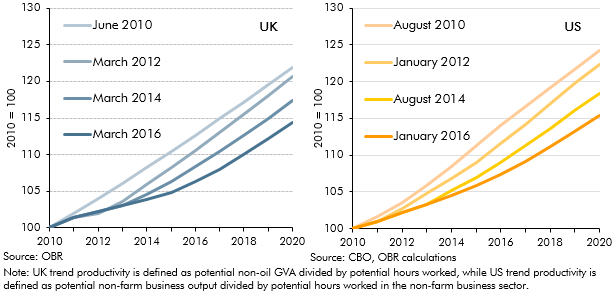
The path of productivity growth is a key driver of GDP growth in our forecast and is also one of the most uncertain judgements. In March 2016, given persistent weakness in outturn data, we revised down our forecast for productivity growth. But this issue was not specific to the UK, with productivity having disappointed in many other major advanced economies. This box compared different vintages of UK and US productivity and potential output forecasts since 2010 to illustrate this point.
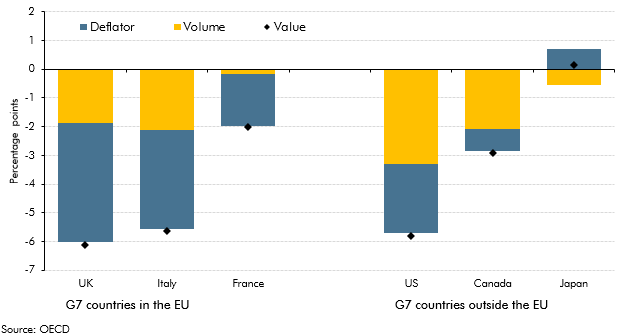
The government consumption deflator measures the implied price of government services. International comparisons show that different methodologies for deriving the government consumption deflator affect the extent to which nominal changes are interpreted as driven by changes in prices as opposed to volumes. This box outlined how these methodologies affected government consumption compared to pre-recession averages for six leading industrial countries.
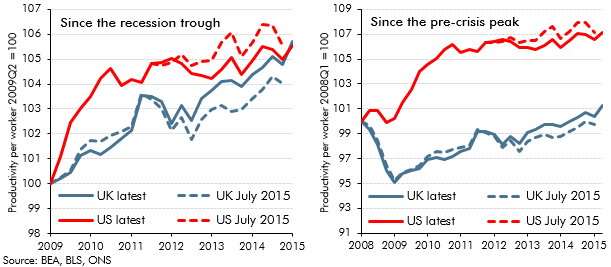
Recent estimates of UK GDP growth represent an early draft of economic history that will be revised, often substantially, over time. OECD found that initial estimates of UK GDP growth have tended to be revised up over time. This box also highlights revisions to estimates of US and UK productivity growth between July and November 2015, and the substantial productivity shortfall relative to the US and relative to the pre-crisis trend in the UK.
Our 2015 long-term fiscal projections suggested that, if left unaddressed, the public sector finances would have come under increasing pressure over the next 50 years due to rising age-related expenditure. This box compared our long-term age related spending projections with projections from the Ageing Working Group (2015) for the EU countries between 2020 and 2060.
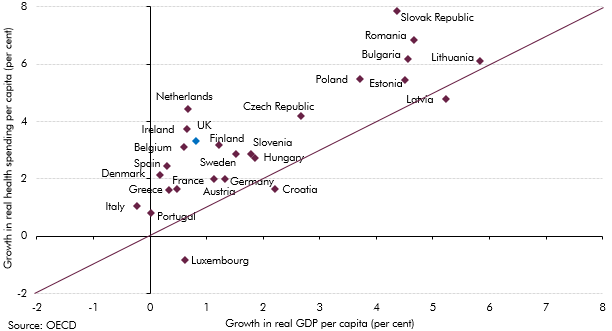
Health spending rose faster than GDP in almost all European countries over the past decade. This box investigated most notable long-term drivers of real spending on health care: demographic effects, income effects and other cost pressures.
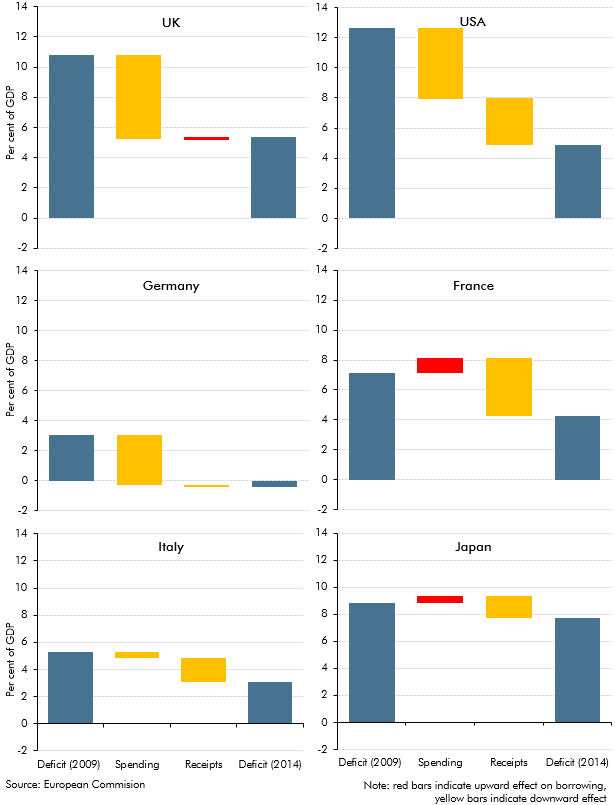
The UK budget deficit increased to a post-war high after the financial crisis and recession of the late 2000s. This box explored how the path and composition of deficit reduction in the UK over the subsequent 5 years compared to five other major economies.
Between 2012 and 2014, growth in the UK picked up, outpacing all other members of the G7. This box provided wider context for this strength in UK growth, comparing GDP, employment and productivity growth across G7 countries since 2008.
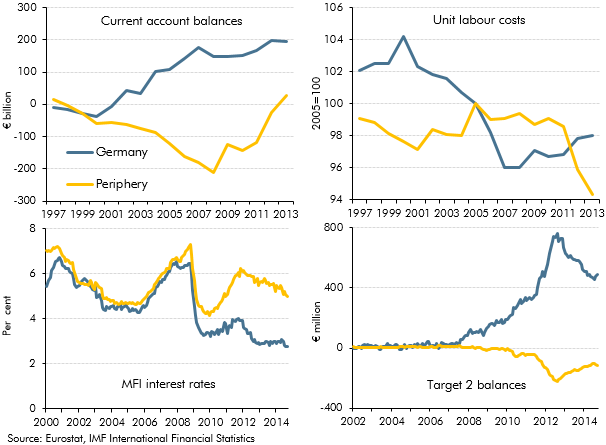
In the December 2014 Economic and fiscal outlook, we identified the adjustment in the euro area as a risk to our forecast. This box highlighted some of the key indicators that commentators were using to measure the progress of that rebalancing.
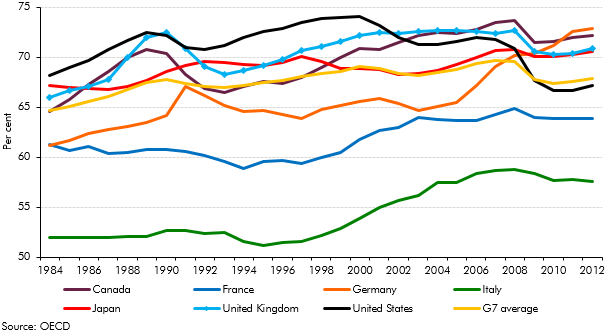
Earlier in the year, the Chancellor expressed an ambition “to have more people working than any of the other countries in the G7 group". This box compared countries employment rates and demonstrated the scope for labour market outcomes to differ substantially.
In the late-2000s recession, total investment in the UK fell by more than in other similarly-developed economies, but in the March 2014 forecast we expected it to pick up strongly. This box considered possible reasons for the previous weakness and compared the investment-to-GDP ratio in our forecast against OECD averages.
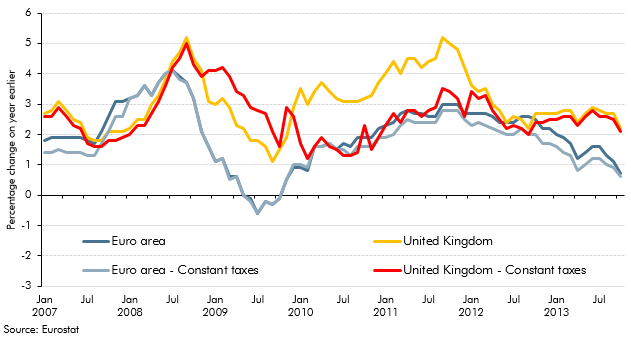
From late-2008 to 2013, the rate of CPI inflation in the UK had been consistently higher than the euro area equivalent measure. This box, published in our December 2013 Economic and fiscal outlook, outlined a number of factors which had contributed to the divergence including exchange rate movements, changes in VAT and utility prices.
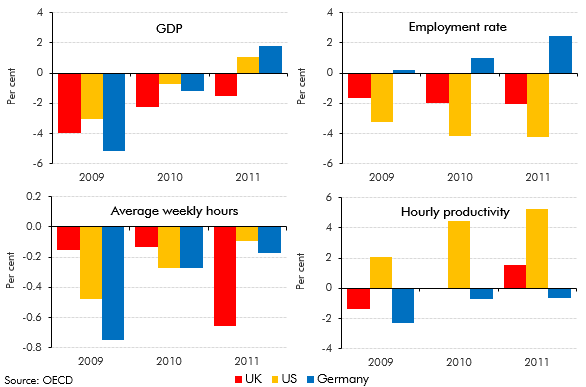
The UK, the US and Germany all saw broadly similar falls in GDP over 2009, but their labour markets responded differently. This box discussed these differences and compared the behaviour of employment, hours and productivity over this period.
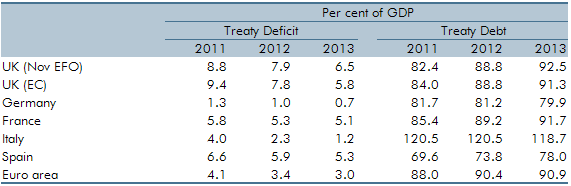
International organisations provide comparisons of deficit and debt levels. This box facilitated international comparisons by providing projections of Treaty debt and deficit on a calendar year basis.