
The Government committed to a significant boost to the path of capital spending. This box explored how UK government investment as a share of GDP has compared to other OECD countries and how our March 2020 forecast affects this picture.
Measured on an internationally comparable basis,a the capital spending increases announced in this Budget will take government investment from 2.5 per cent of GDP in 2017 to 3.1 per cent of GDP in 2024. But how does that compare with other advanced economies?
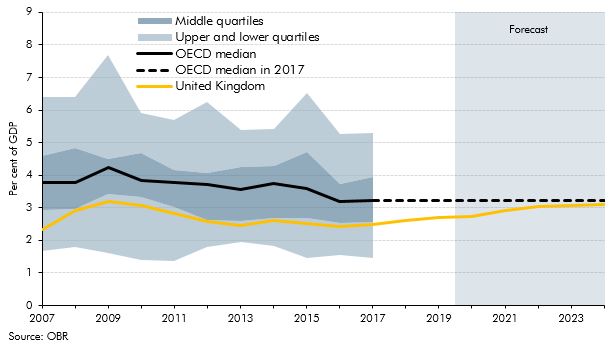
Chart B shows the UK’s relative position among 30 OECD countries over the decade to 2017.b Across the whole period, the UK was consistently positioned within the bottom quarter in terms of government investment as a share of GDP – more specifically, it was ranked between 23rd and 27th out of 30 countries in every year. UK government investment was a little higher as a share of GDP in 2017 than in 2007, having first risen during the crisis then fallen back. The large increase over the next five years will take it to around the present OECD median. But it will still fall well short of levels in countries whose governments invested most over the past decade – in South Korea, Estonia and Latvia investment averaged around 5 per cent of GDP a year.
Chart B: UK government investment on an internationally comparable basis relative to other OECD countries
This box was originally published in Economic and fiscal outlook – March 2020