
Box sets » Structural deficit

Public sector net debt (ex BoE) has risen substantially over the past 25 years, despite repeated government plans to get it falling. In this box, we examined the key drivers behind this upward trend, including the impact of major economic shocks, the persistent gap between forecasted and actual debt outcomes, and the increasing difficulty of stabilising debt due to structural fiscal pressures.

The UK’s fiscal position is increasingly vulnerable, by both historical and international standards. In this box, we considered the drivers of fiscal vulnerability, such as persistent large deficits, slower growth and higher interest rates, and the extent to which these may limit the Government's scope to respond to future economic shocks.

The pandemic generated only modest structural damage to the fiscal position but did still create a gap in what the Chancellor considered a sustainable fiscal position. This box compared the scale of fiscal consolidation facing the chancellor and his approach to repairing the public finances with the challenge that faced Chancellor George Osborne after the financial crisis.
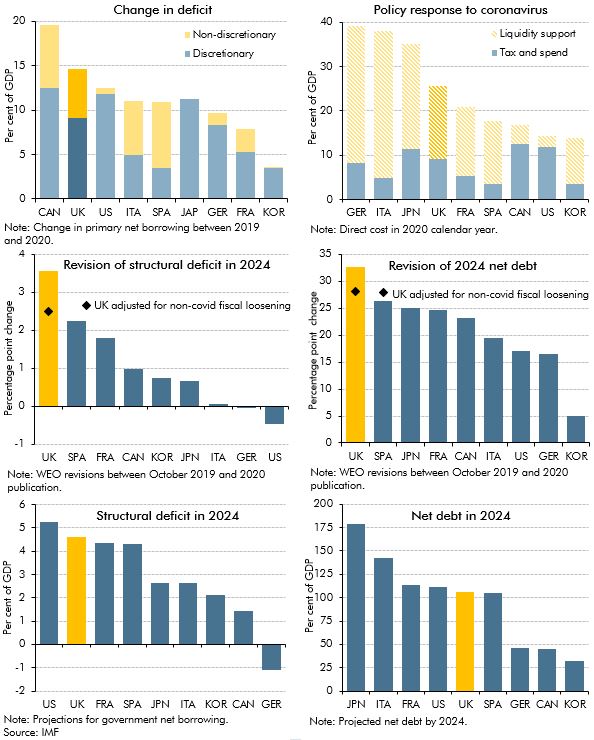
The pandemic has undoubtedly had a negative impact on public finances of countries around the world, but questions remain regarding the impact on the immediate and long-term fiscal positions of the UK relative to other major advanced economies. In this box, we considered the immediate term impact on primary deficits and the extent to which this reflected discretionary policy packages; the size of discretionary policy packages and the use of direct tax and spending policy versus liquidity support; and the impacts in the longer term on structural deficits and debt, including revisions between the IMF’s October 2019 and October 2020 WEO.
To estimate the impact of a measure or package on the economy, we use a set of fiscal multipliers. This box outlines some recent research on the size of multipliers, how the multiplier varies during the economic cycle and how multipliers 'taper' over time.
In early OBR forecasts we estimated a significant negative output gap following the late-2000s recession, which we did not expect to have closed by the end of the forecast horizon. Our March 2013 forecast implied that potential output would be 14.6 per cent below an extrapolation of its pre-crisis trend after five years, with actual output a further 2.3 per cent below that. This box examined the implications of that forecast, as well as the fiscal implications of some possible alternative assumptions.
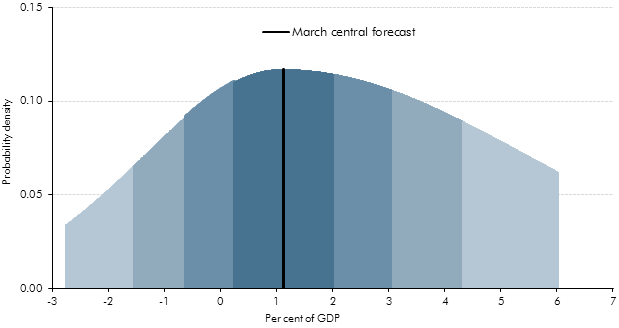
This box set out the methodology behind our PSNB fan charts. Briefing paper no.4: 'How we present uncertainty' sets out this methodology in more detail.