
This box set out the methodology behind our PSNB fan charts. Briefing paper no.4: 'How we present uncertainty' sets out this methodology in more detail.
One way of illustrating the uncertainty around the public finances forecast is by using fan charts based on the errors made in previous official forecasts. The fan charts do not represent our assessment of specific risks to the central forecast. Instead, they show the degree of uncertainty that someone might expect if they believed, rightly or wrongly, that errors in the past offered a reasonable guide to future errors.
In previous EFOs we have assumed a symmetrical distribution of past errors around the central forecast when constructing the PSNB fan chart. However, our fan chart of errors on the GDP forecast, shown in Chapter 3, has always assumed that past errors on the GDP forecast have been skewed to the downside.
Given the close link between borrowing and the economy one might therefore also expect errors to PSNB to also be skewed towards more negative outcomes (higher borrowing). To ensure consistency between the two charts, we have now decided to use the GDP fan chart to determine directly the shape of the PSNB fan chart. We do this by using a ready reckoner of the sensitivity of PSNB to changes in GDP and will present further details of this methodology in a forthcoming briefing paper, which discusses our approach to recognising uncertainty more generally.
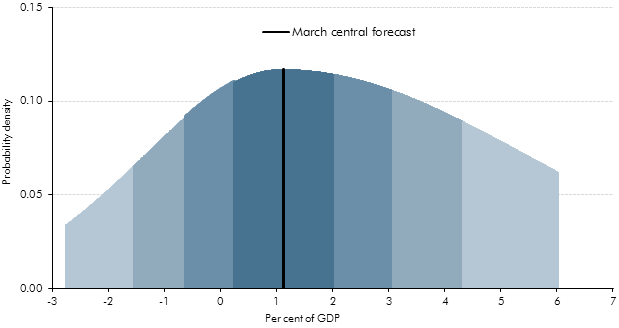
The result can be seen in Chart 4.6, which suggests that the likelihood of making large errors due to under-forecasting PSNB is greater than generating large errors due to over-forecasting borrowing. This is perhaps clearer in Chart A, which illustrates the uncertainty over borrowing in the final year of the forecast period.
Chart A: Probability projections for PSNB in 2016-17
This change does not affect our judgement whether the Government has a greater than 50 per cent probability of meetings its targets. This is determined simply by asking whether our central (or median) forecast of the cyclically-adjusted current budget (CACB) is in balance five years ahead, and whether public sector net debt is falling in 2015-16.
We use a CACB fan chart, as shown in Chart 5.2, to assess the margin between the Government meeting and missing its fiscal mandate. GDP growth and PSNB errors will largely relate to errors in forecasting the cyclical position of the economy. As the CACB should not move with the economic cycle, we would not expect the same pattern of errors to be repeated for the CACB. We therefore continue to assume that risks around the median CACB forecast are distributed symmetrically.