
The pandemic has undoubtedly had a negative impact on public finances of countries around the world, but questions remain regarding the impact on the immediate and long-term fiscal positions of the UK relative to other major advanced economies. In this box, we considered the immediate term impact on primary deficits and the extent to which this reflected discretionary policy packages; the size of discretionary policy packages and the use of direct tax and spending policy versus liquidity support; and the impacts in the longer term on structural deficits and debt, including revisions between the IMF’s October 2019 and October 2020 WEO.
This box is based on IMF data from September/October 2020 .
The coronavirus pandemic has had severe economic and fiscal consequences for countries around the world. National lockdowns and other restrictions on individual and business activity have resulted in recessions in all major economies. Having considered the global economic impact of the pandemic in Chapter 2, here we consider its immediate and longer-term fiscal impacts across major countries (the G7 plus Spain and South Korea). As the latest data is drawn from the IMF’s October 2020 Fiscal Monitor and World Economic Outlook (WEO), it does not fully incorporate the consequences of the second wave of infections, further lockdowns, and the extension of fiscal support in these countries.
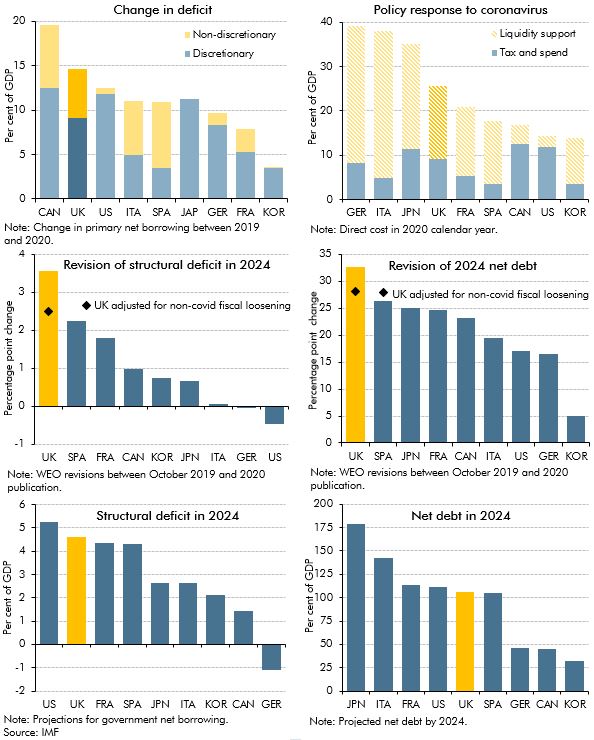
The IMF predicts the UK to see the second largest year-on-year rise in its primary deficit (revenue minus non-interest spending) in 2020 (Chart B, top left panel). Unlike during the financial crisis, the bulk of this fiscal deterioration comes not from the deterioration in the economy (the non-discretionary element) but from governments’ policy responses (the discretionary element). These discretionary policy responses have tended to be larger in countries like the UK, US, and Canada, with less generous welfare systems, compared with countries like Italy, Spain, and France, which have more generous social insurance systems. The increase in claims on these systems during the pandemic are therefore classed as part of the operation of the non-discretionary automatic stabilisers, rather than as discretionary policy as in the case of the UK’s CJRS or the increase in payments to the unemployed in the US.
The top-right panel shows the IMF’s estimates for the size of those fiscal policy responses, split by direct tax and spending measures (such as the CJRS, increases to UC, and grants to business in the UK) and liquidity support to firms and individuals, in the form of loans or guarantees (such as the government guaranteed loan schemes in the UK). The policy response to this crisis has also been exceptional in the scale and scope of the latter form of ‘off balance sheet’ support, much of which is not recorded in the conventional measures of government deficits and debts. The UK ranks in the middle in both the size of its overall policy response and the split between direct and liquidity support. Germany’s programme of liquidity support stands out as it includes their Economy Stabilisation Fund, which offers up to €600 billion in guarantees, loans, and equity injections to firms that suffered a significant economic impact from the virus. Estimates of liquidity support are less comparable than direct tax and spend policies, as the ceilings on schemes can be many times actual take-up.
The middle-left panel shows the revision in the IMF’s estimates of structural deficits in 2024 between its October 2019 and October 2020 WEOs. On this measure the UK has suffered a larger hit to its fiscal position in the medium term, with the structural deficit revised up by 3.5 percentage points. Even stripping out our estimate of the pre-virus fiscal loosening in the March Budget, the UK remains the hardest hit fiscally by the pandemic. This partly reflects the IMF’s assumption that the UK economy will suffer greater scarring than these other countries.
The middle-right panel shows the revision in the IMF’s estimates of general government net debt in 2024 between its October 2019 and October 2020 WEOs. Unsurprisingly, even after adjusting for the March fiscal loosening, the UK also experiences the largest increase in its debt-to-GDP ratio, owing to its relatively large and persistent deficits over this period.
The bottom-left panel shows the IMF’s estimates for the structural deficits countries will be left with in 2024, with the UK projected to have one of the highest. It is second only to the US, which was expected to run a large fiscal deficit prior to the pandemic. Only Germany is set to return to a budget surplus by 2024, reflecting the strong fiscal position it held entering the crisis and the relatively rapid recovery in its economic activity following the first wave of the pandemic.
The bottom-right panel shows the IMF’s latest forecasts for net debt in 2024. They suggest that the UK can expect to see net debt remain above 100 per cent of GDP in 2024. Only Germany, Canada and Korea are projected to keep net debt well below this level, reflecting lower debt going into the crisis and the more rapid economic and fiscal recovery after the first wave.
Chart B: Fiscal aggregates and policy response
This box was originally published in Economic and fiscal outlook – November 2020