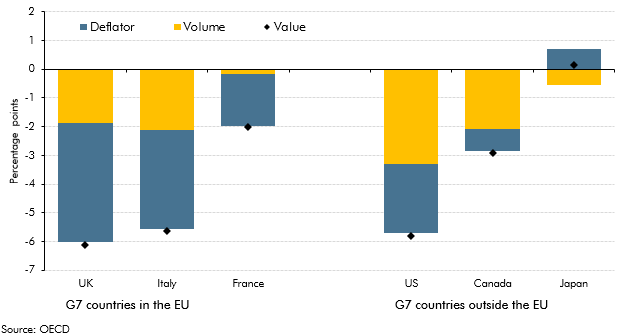
The government consumption deflator measures the implied price of government services. International comparisons show that different methodologies for deriving the government consumption deflator affect the extent to which nominal changes are interpreted as driven by changes in prices as opposed to volumes. This box outlined how these methodologies affected government consumption compared to pre-recession averages for six leading industrial countries.
This box is based on OECD government consumption data from July 2015 .
The government consumption deflator measures the implied price of government services. In the UK, around one-third reflects actual deflators – where the prices are measured directly – and the other two-thirds reflect implied deflators – where it is the volume that is measured directly and the price inferred. Our earlier forecasts did not take sufficient account of the effect on implied deflators of the Government’s spending cuts, which reduce the value of spending more than the directly measured volumes. We therefore overestimated deflator growth and so underestimated the growth of real government consumption.
Methodologies for deriving the government consumption deflator vary across countries. Studies by the ONSa and OECDb suggest that non-EU countries tend to depend more on actual deflators and EU countries on implied deflators. That suggests that the effect of cuts in government consumption would be seen in the deflator to a greater extent in the UK and other EU countries than in non-EU countries.
Chart C shows how average annual growth in the value of six leading industrial countries’c government consumption since the third quarter of 2010 has changed relative to pre-recession averages (2000-2008). Growth in the value of government consumption is weaker in every country (bar Japan) than prior to the crisis. As we would expect, given the difference in deflator methodologies, lower deflator growth accounts for a greater proportion of cuts in the UK and other EU countries, while slower volume growth plays a bigger role in the non-EU countries. At the extremes, 90 per cent of the reduction in value growth has come via the deflator in France while 71 per cent came through volumes in Canada.
These differences in National Accounts methodologies may be important when considering international comparisons of the direct effect of government spending cuts on real GDP growth. But comparisons in value terms should be less affected by such differences. In Box 3.3 of our November EFO, we showed that the planned cut in government consumption as a share of GDP in the UK would be the biggest ten-year fall seen in any G7 country in the past half century, according to OECD data dating back to 1960.
Chart C: Government consumption compared to pre-recession averages

This box was originally published in Economic and fiscal outlook – March 2016
