Our 2015 long-term fiscal projections suggested that, if left unaddressed, the public sector finances would have come under increasing pressure over the next 50 years due to rising age-related expenditure. This box compared our long-term age related spending projections with projections from the Ageing Working Group (2015) for the EU countries between 2020 and 2060.
This box is based on European Commission government spending data from May 2015 .
Our long-term projections suggest that, if left unaddressed, the public sector finances would come under increasing pressure over the next 50 years due to rising age-related expenditure. Such pressures are common to most developed countries, as shown in the European Commission’s latest Ageing Report published in May 2015, which contains long-term fiscal projections for EU Member States.
Age-related spending – pensions, health care, long-term care and education – is projected to rise by around 2 per cent of GDP between 2020 and 2060. But, as shown in Chart A, there is considerable variation across Member States, with age-related pressures in the UK described as ‘moderate’, raising spending by 2.3 per cent of GDP. Among the larger countries, the public finances in Germany and the Netherlands are projected to be under greater pressure, while in France and Italy the projections are more favourable (mainly driven by changes in the underlying demographic and economic assumptions).
The Commission’s latest projection for the rise in UK age-related spending has been revised down from 3.3 per cent of GDP in the 2012 Ageing Report. The difference stems largely from changes to the State Pension age and the 2016 introduction of the single-tier pension, both of which have been legislated for since the 2012 report and reduce pressure on pensions spending over time.
Chart A: Change in age-related spending in the EU (2020-60)
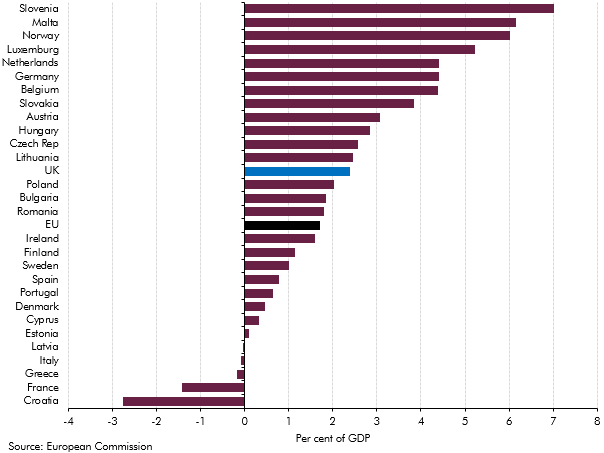
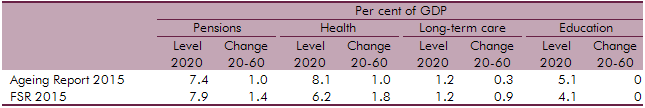
Table A compares the Commission’s and our projections for the four main elements of age-related spending. As the Commission does not factor in the spending cuts in our medium-term forecasts, we focus on the projected changes between 2020 and 2060. The table shows that:
- the projected rise in pensions spending is somewhat higher in our projections. This reflects the net effect of two key assumptions. We assume the longevity link will result in the State Pension age rising beyond the currently legislated path, whereas the Commission only factors in legislated changes. But, more than offsetting that, we assume a long-term cost of uprating pensions in line with the triple lock, which the Commission does not include as it is not currently a legal requirement of the state pensions system;
- the projected rise in health spending is considerably higher in our projections. The difference of approach over the medium term is most apparent in this comparison. But despite the higher starting point, the Commission’s methodology and assumptions – notably assuming compression of morbidity in old age (with years of healthy life increasing more quickly than overall life expectancy, reducing age-related pressure on spending) – leads to a smaller rise in spending over the long term. Another difference with our projections is that, in the reference scenario, the Commission assumes an income elasticity of 1.1 in the short term, converging to 1 over the long term. By contrast we have an implicit income elasticity of 1 for the entire period. (See Box 3.3 for more on how these and other assumptions affect projections of health spending);
- the projected rise in long-term care spending is also considerably higher in our projections. This partly reflects our assumption about the long-term cost of introducing a lifetime cap on individual care costs in the UK, which is not reflected in the Commission’s projections; and
- neither set of projections shows education spending rising or falling over the long term.
Table A: Comparison of age-related expenditure items