
Box sets » Departmental spending » Health
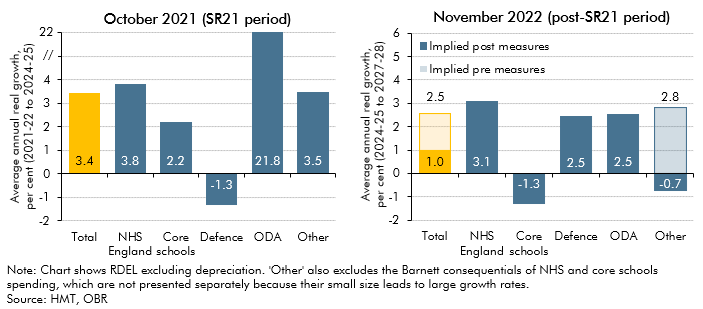
In November 2022 the government reduced its departmental (DEL) spending assumptions for the final three years of the forecast period. This box discussed the implications of the government's day-to-day and capital spending plans for various departments and public services during and after the 2021 Spending Review.
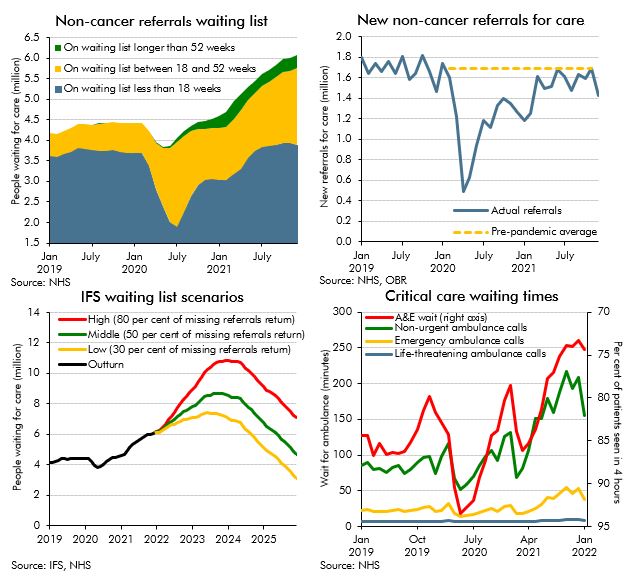
The NHS is the largest single item of public spending in the UK, and has been placed under extraordinary pressure as a result of the pandemic. Historically, some of the largest policy-related revisions have related to health spending, including the £13 billion a year announced at the 2021 Spending Review. This box explores indicators of pressure across the health service and the potential for these pressures to result in risks to our forecast.
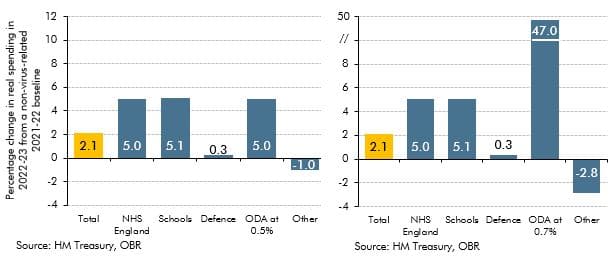
This box discussed the risks to our medium-term forecast of day-to-day departmental (RDEL) spending, particularly in relation to the impact of the pandemic.
Our 2018 long-term fiscal projections suggested that, if left unaddressed, the public sector finances would come under increasing pressure over the next 50 years. This box compared our long-term age related spending projections over the period from 2025 to 2065 with those presented in the European Commission's 2018 Ageing Report.
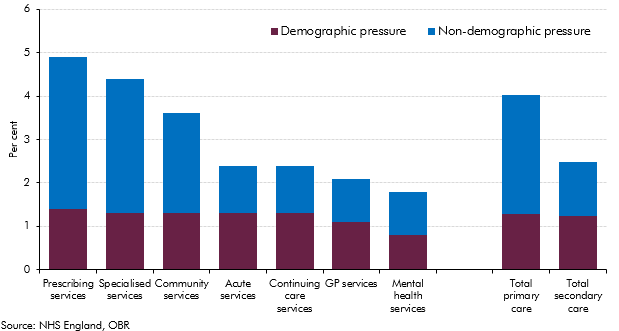
Over the past four decades, health spending in the UK rose faster than GDP (on average in real terms) and it increased steadily in real per capita terms. Demographic change alone could have not explained these rising trends, with other factors expected to provide further upward pressures on health spending. This box summarised the key findings of our WP No. 9 that reviewed the latest evidence on demographic and non-demographic determinants of health spending in the UK and its implications for our long-term health spending projections.
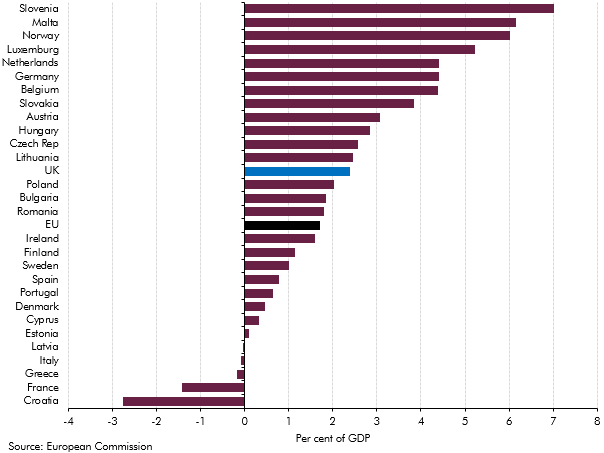
Our 2015 long-term fiscal projections suggested that, if left unaddressed, the public sector finances would have come under increasing pressure over the next 50 years due to rising age-related expenditure. This box compared our long-term age related spending projections with projections from the Ageing Working Group (2015) for the EU countries between 2020 and 2060.
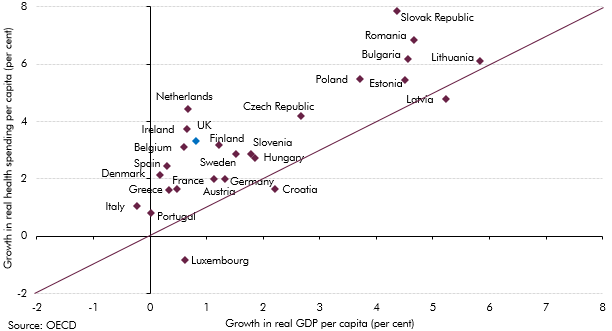
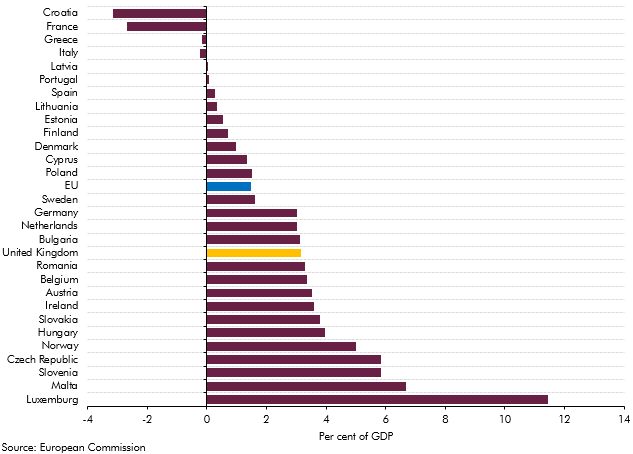
Health spending rose faster than GDP in almost all European countries over the past decade. This box investigated most notable long-term drivers of real spending on health care: demographic effects, income effects and other cost pressures.
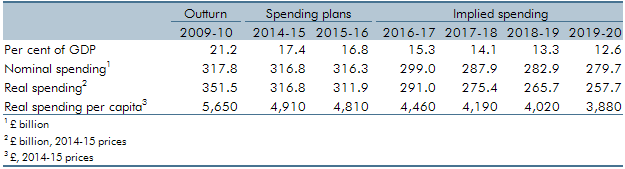
We were asked by our stakeholders whether we considered the implications for current spending on public services (RDEL) in our forecasts to be central, as we are tasked with producing a central forecast. This box outlined RDEL implied spending from 2016-17 to 2019-20 (years in which firm spending plans did not exist and RDEL levels were set by a government policy assumption). The box also examined the implied breakdown of RDEL by some of the main spending areas in 2019-20, in particular examining the implications of then-current government RDEL assumptions for public services spending that was not protected in some way.
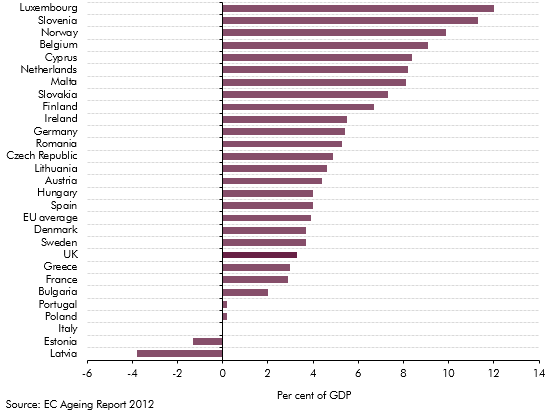
The European Commission (EC) produces its own analysis of ageing pressures for member states every three years. This box contrasted the forecast made by the EC and the OBR for UK age related spending such as pensions, health care and long-term care.
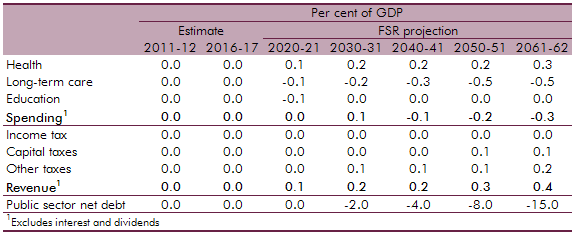
The National Institute of Economic and Social Research (NIESR) produce generational accounts estimates for the UK. The OBR produces its own long-term projections by using profiles that break down spending by year of age. This box compared the differences in public finance forecasts between the OBR and the NIESR with the latter implying a lower level of net debt by 2061‑62.