
The NHS is the largest single item of public spending in the UK, and has been placed under extraordinary pressure as a result of the pandemic. Historically, some of the largest policy-related revisions have related to health spending, including the £13 billion a year announced at the 2021 Spending Review. This box explores indicators of pressure across the health service and the potential for these pressures to result in risks to our forecast.
This box is based on IFS, NHS and OBR data from .
The NHS is the largest single item of public spending in the UK, and has been placed under extraordinary pressure as a result of the pandemic, both as a result of Covid-related activity and also the knock-on effects of that for other health services. Historically, some of the largest policy-related revisions to our public spending forecasts have related to health spending, from the £20 billion a year increase announced by Prime Minister Theresa May in June 2018 to the £13 billion a year increase announced by the Chancellor in last year’s Spending Review. This latest increase in funding arrives at a time where several indicators point to intense pressures across the health service, despite pandemic-related activity having eased somewhat.
Referrals for non-urgent care indicate significant increases in both numbers of people waiting, and the time spent waiting for care. The top-left panel of Chart E shows that in January 2019, of the 4.2 million people waiting for care, less than 0.1 per cent had been waiting over a year, with 13.2 per cent waiting between 18 and 52 weeks. As of December 2021, the number waiting for care had risen to 6.1 million, while the share of those waiting more than a year had risen to 5.1 per cent (a hundred-fold increase), with 31.0 per cent waiting between 18 and 52 weeks. Staffing pressures have also been apparent, with vacancies increasing from 15,900 in January 2019 to a peak of 22,900 in July 2021.
The number of people on the waiting list is likely to understate the true pressure on non-urgent ‘elective’ care. As the top-right panel shows, new referrals for care dropped off sharply from February 2020 as the pandemic shifted NHS priorities and individuals’ behaviour. Although referrals rebounded in 2020, they are still yet to recover to pre-pandemic levels (as shown by the dashed line in the top-right panel), let alone reflect any catching-up of the backlogs that built up during the pandemic. The scale of these is uncertain, but in its February 2022 publication, Delivery plan for tackling the COVID-19 backlog of elective care, the NHS estimates that over 10 million patients who might otherwise have come forward for treatment did not. The extent to which these are caught up in the coming years will influence how the NHS waiting list evolves.
In the plan for tackling this backlog, the NHS outlines ambitions (rather than targets) to reduce waiting times: that by August 2022 nobody will be waiting more than two years; by April 2023 nobody will be waiting more than 18 months; by March 2024 nobody will be waiting more than 65 weeks; and that by March 2025 there will be nobody waiting more than a year. The Institute for Fiscal Studies (IFS) has considered various scenarios for waiting lists to achieve these ambitions (reproduced in the bottom-left panel).a Each scenario assumes a different share of the missing referrals comes forward for care: 30 per cent (low), 50 per cent (middle), and 80 per cent (high). Even in the low scenario, waiting lists continue to increase until June 2023, when they peak at 7.4 million, and only fall below current levels in September 2024. In the middle scenario they peak at 8.7 million in October 2023, while in the high scenario they peak at 10.8 million in December 2023 and never fall below the December 2021 level.
Chart E: Indicators of pressures on the NHS
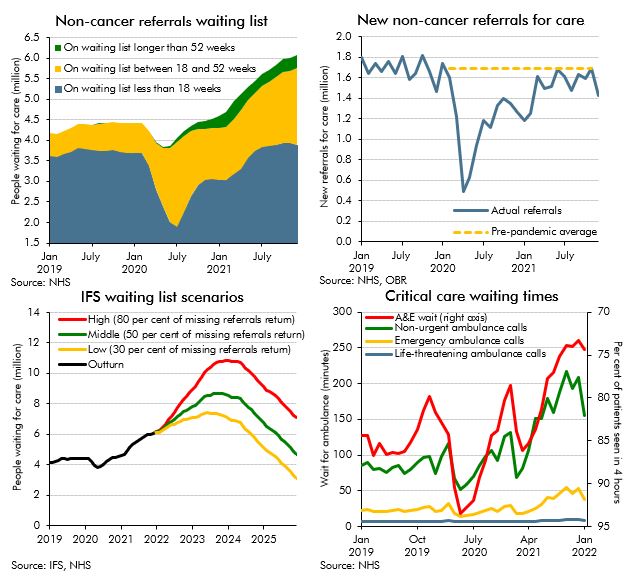
As well as the pressures seen in elective care, critical care waiting times have risen significantly. The bottom-right panel shows waiting times for ambulances by degree of urgency,b and the percentage of A&E patients seen within four hours (where the stated target is 95 per cent). For A&E patients, this has fallen from around 85 per cent pre-pandemic to less than 75 per cent in late 2021. Response times for ambulances have slowed significantly across all categories relative to their 2019 averages: at their peaks in late 2021 they had slowed by 30 per cent for life-threatening calls (category 1); by 133 per cent for emergency calls (category 2); and by 155 per cent for non-urgent calls (category 4).
To the extent that such pressures – or indeed broader pressures from pay and inflation – were accommodated in higher budget allocations, that would represent a risk to our forecasts. The IFS has found that in the almost 40 years between the 1982 Autumn Statement and the 2015 Spending Review, there have only been two occasions when health spending has risen by less than was originally planned.c Initial real terms spending plans suggested average annual growth of 2.7 per cent, but in outturn this growth was 4.1 per cent. Resource spending plans set at the 2021 Spending Review were consistent with average real annual growth of 3.8 per cent in the NHS between 2021-22 and 2024-25, broadly in line with this historical average. Revisions to our GDP deflator forecast since October mean that the real growth rate consistent with our latest forecast is 3.3 per cent. So despite the £13 billion increase to NHS funding at the 2021 Spending Review, policy risks from NHS spending could well still remain to the upside.
This box was originally published in Economic and fiscal outlook – March 2022