
Box sets » Economic and fiscal outlook - March 2022
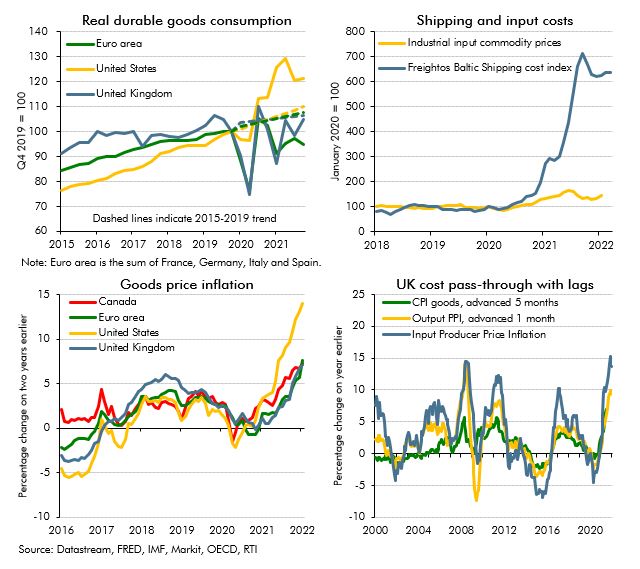
The recovery from Covid in the second half of 2021 was characterised by the emergence of imbalances between supply and demand in many markets. In this box we explored the impact of and outlook for these imbalances, or bottlenecks, in global product markets.
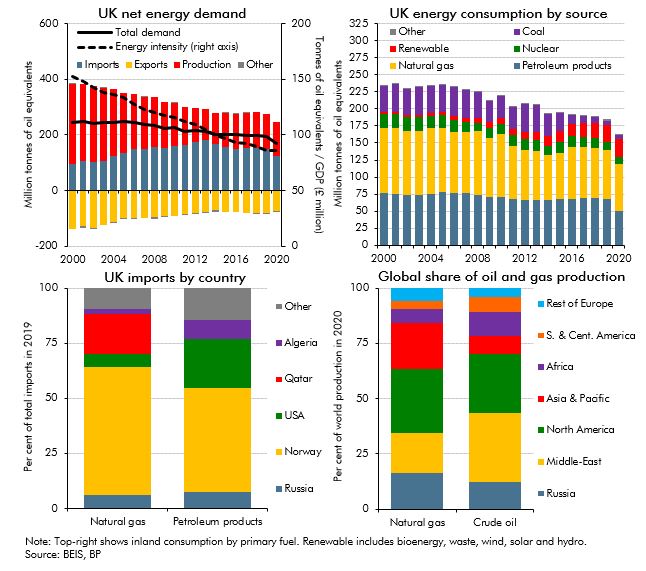
Russia’s invasion of Ukraine in the run-up to our March 2022 Economic and fiscal outlook represented a significant adverse shock, primarily via a sharp rise in gas and oil prices. In this box, we considered where the UK gets its energy from and the channels through which higher energy prices raise inflation. We then set out how the economic shock from the invasion had been reflected in our forecast as well as several potential channels through which the invasion could affect the UK economy that our forecast did not explicitly capture.
In each Economic and fiscal outlook we publish a box that summarises the effects of the Government’s new policy measures on our economy forecast. These include the overall effect of the package of measures and any specific effects of individual measures that we deem to be sufficiently material to have wider indirect effects on the economy. In our March 2022 Economic and fiscal outlook, we adjusted our economy forecast to take into account plans to loosen fiscal policy from 2022-23, to support households with the cost of living crisis, as well as for several specific measures, such as the cut in fuel duty and the freezing of the BBC liscence fee.
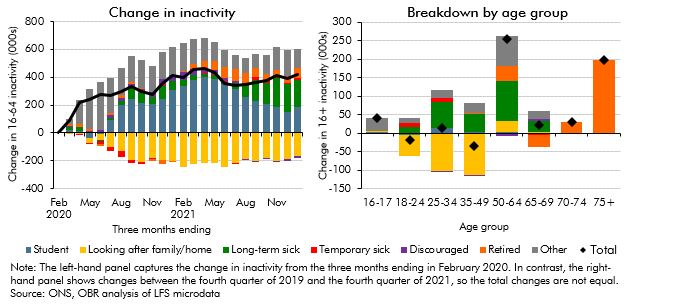
The labour market has seen mixed performance following the closure of the coronavirus job retention scheme. Low unemployment surprised to the upside whereas participation remained weaker than expected. In this box, we compared these weak participation outturns with two pre-pandemic counterfactuals, and explored the reasons why fewer people were active than we expected in previous forecasts, including by looking at the trends in different age groups. We also discussed whether we expected these trends to unwind over our forecast.
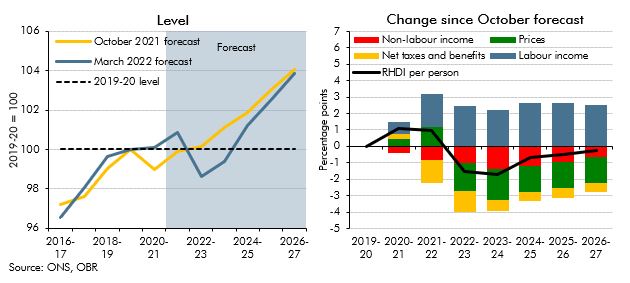
The cost of living has risen rapidly for households, with inflation reaching a 30-year high in January 2022 and the Russian invasion of Ukraine expected to increase inflation further. In this box we outlined our forecast for real household disposable incomes per person and explained that despite the Government's policy measures, 2022-23 is set to see the largest fall in living standards since ONS records began in 1956-57.
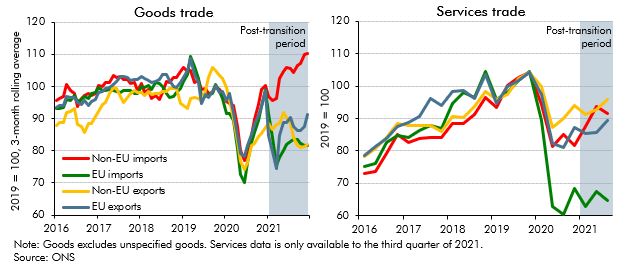
Our March 2022 EFO was published just over a year since the end of the transition period. In this box, we presented the latest evidence for the impact of Brexit on UK trade and considered the UK's recent trade performance relative to other advanced economies.
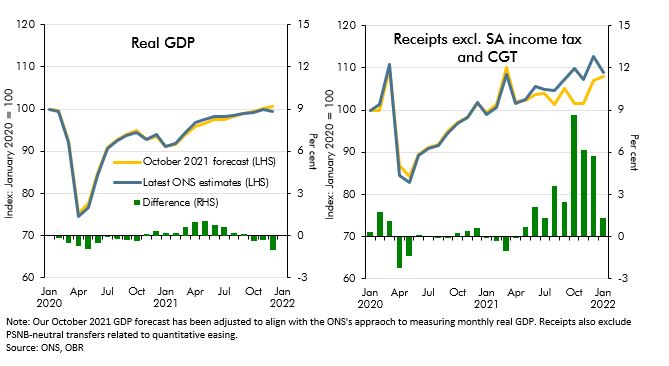
Since our October 2021 EFO the real economy has performed largely as expected in 21-22 but tax receipts have come in well above that forecast. In this box, we examined reasons why tax receipts have recovered so quickly particularly in comparison to economic data.
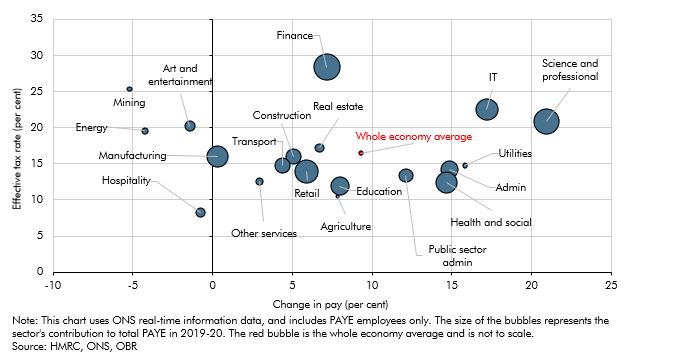
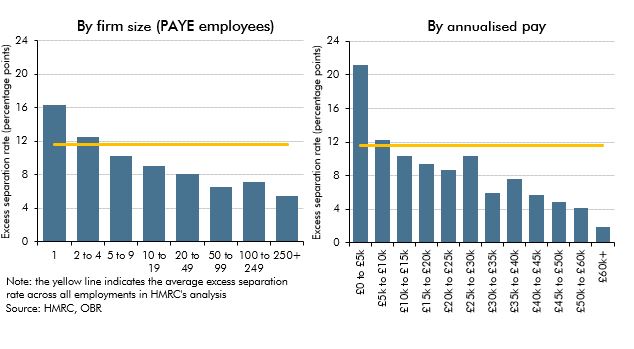
This box considered the reasons for particular strength in income tax receipts since 2019. It covered the growth in aggregate pay across the income distribution using RTI data; looked at pay growth and effective tax rate by sector since 2019; and finally at how the freeze to tax thresholds from April 2022 will compound this strength in receipts.
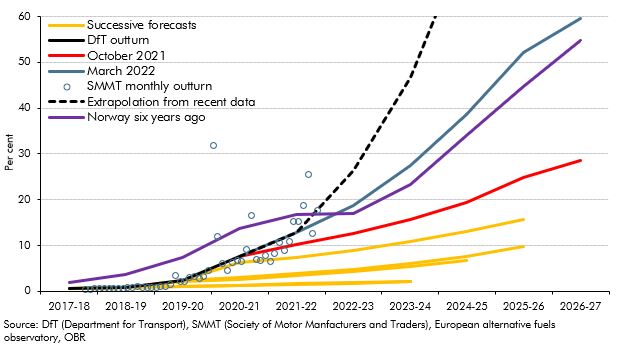
This box outlined the recent growth in electric vehicle sales and the fiscal implications of this and the role of policy in the transition.
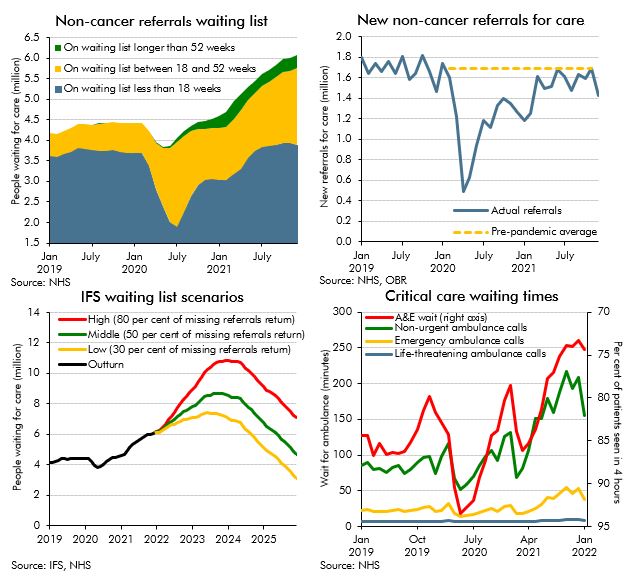
The NHS is the largest single item of public spending in the UK, and has been placed under extraordinary pressure as a result of the pandemic. Historically, some of the largest policy-related revisions have related to health spending, including the £13 billion a year announced at the 2021 Spending Review. This box explores indicators of pressure across the health service and the potential for these pressures to result in risks to our forecast.
In the final month of the coronavirus job retention scheme (September 2021), over 1 million people were still receiving payments from the scheme. In this box we explore the labour outcomes, up to January 20222, for this population after the closure of the scheme, compared to individuals in employment who were not on furlough in September 2021.
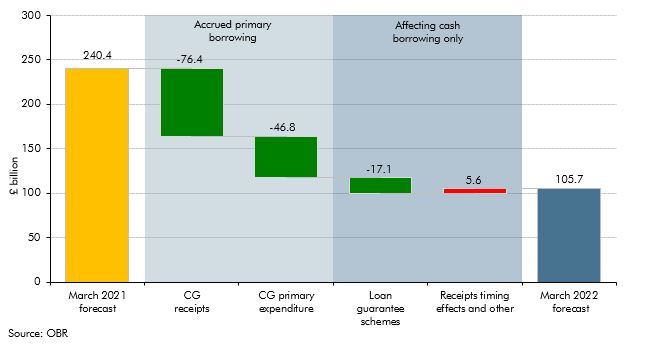
Forecasts for the government's cash borrowing in 2021-22 were revised significantly between the March 2022 and October 2021 forecast, with even larger revisions between March 2021 and March 2022. In this box we decomposed the sources of these revisions, and explained why cash borrowing outturn was much lower than forecast in March 2021, as well as why the revisions to cash borrowing were much higher than those for accrued borrowing.
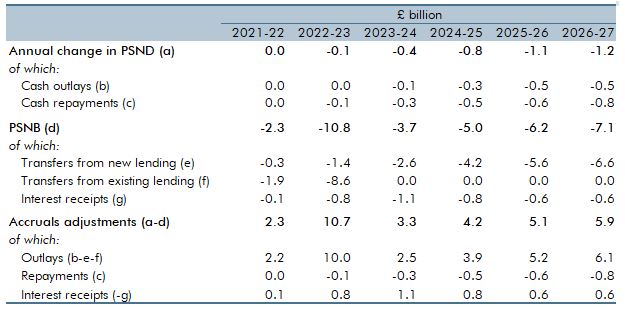
On 24 February 2022 the Government introduced a raft of changes to the working of the higher education student loans system in England. In this box we: summarised the reforms, explained their impacts on the complex accounting for student loans, and showed the overall impact on the latest forecast.