
The recovery from Covid in the second half of 2021 was characterised by the emergence of imbalances between supply and demand in many markets. In this box we explored the impact of and outlook for these imbalances, or bottlenecks, in global product markets.
This box is based on Datastream, FRED, IMF, OECD and ONS data from March 2022 .
‘Bottlenecks’ has become a catch-all term to describe the temporary imbalance between supply and demand that has hampered the global economic recovery from the pandemic and fuelled
inflation across advanced economies. These imbalances have appeared in many markets, including energy and labour, but are most evident in global product markets. Until the Russian invasion of Ukraine, product market bottlenecks arose primarily as a result of the resurgence in demand in the wake of the pandemic, especially for durable goods in the US (Chart A, top-left panel). Demand for these goods, which are more energy, material, and transport-intensive than services, outpaced the capacity for global supply chains to respond. The IMF estimates that this mismatch between global demand and supply reduced world GDP growth by between 0.5 and 1.0 percentage points in 2021.a
Supply has responded only gradually to this heightened demand, with the response being hampered by Omicron outbreaks in key ports and factories in Asia. Global semiconductor sales were nearly 40 per cent above 2019 levels by the third quarter of 2021,b but, partly due to increased demand from other sectors, the supply to car manufacturers remained constrained, contributing to car production being 15 to 65 per cent below 2019 levels across major manufacturers.c Global ports handled 7 per cent more freight in January 2022 compared to December 2019.d But this supply response has not been quick enough to avoid sharp rises in supplier delivery times, port congestion, and shortages in key inputs. In early March 2022 it took 110 days to ship freight from China to Europe, up from just over 55 days in 2019.e
The global mismatch between demand and supply has fuelled increases in the prices of the commodities, manufactured inputs, and services required to produce and then deliver goods to
consumers. Since January 2020 a broad index of the price of commodities used for industrial inputs has risen by 50 per cent (Chart A, top-right panel), while global shipping costs have risen over six-fold. These higher input and transportation costs have led to increases in the price of consumer goods in advanced economies (Chart A, bottom-left panel). Goods price rises have been greatest in the US where demand has been the strongest, with prices up 14 per cent compared to two years ago in January 2022, while goods price inflation has so far been lower, but still rising, in the UK and other advanced economies.
Abstracting from the latest supply disruptions associated with Russia’s invasion of Ukraine, the persistence of global goods bottlenecks will depend both on how much longer elevated demand persists and how much longer it will take for additional supply to come on stream. Growth in demand for goods is likely to slow as higher inflation squeezes real incomes, durables stocks are replaced, and demand shifts back to services as Covid restrictions and voluntary social distancing continue to ease. In the US, real spending on all goods and durable goods fell by around 4 and 7 per cent respectively between October and December 2021, before rising again in January. This should allow producers and logistics networks to begin to clear backlogs, though retailers’ desire to rebuild inventories will support goods demand in the near term. On the supply side, additional manufacturing and transport capacity is also expected to come on stream with stainless steel production forecast to reach an all-time high in 2022; the number of new containerships on order has almost tripled and these are largely scheduled for delivery in 2023 and 2024.f Surveys of industry insiders suggest bottlenecks will clear in the second half of 2022, spilling into 2023, though further Omicron outbreaks and shutdowns in China present a risk to the outlook. But it is clear that the supply response will be disrupted further by Russia’s invasion of Ukraine, which has already forced the redirection of some air and sea freight, and will disrupt the supply of metals such as palladium (important for semiconductors) and nickel (used in producing stainless steel).g
Chart A: Global and UK increases in input costs and goods prices
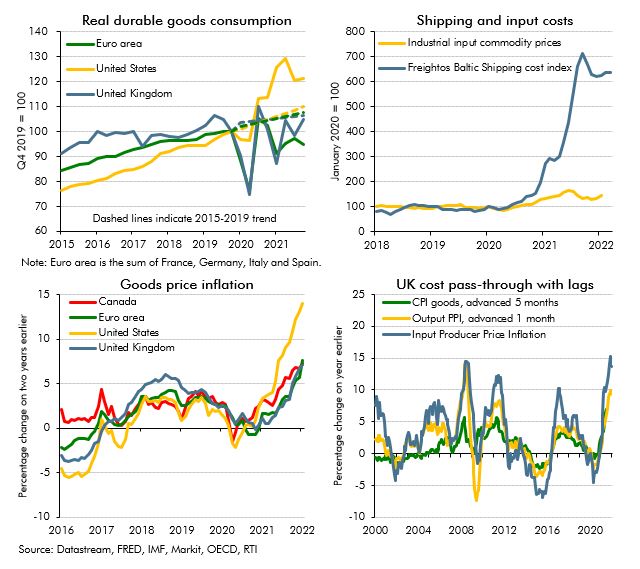
Higher global goods prices can be expected to feed into UK output and consumer prices with a lag. Chart A, bottom-right panel, shows that changes in the price of inputs to manufacturing are passed through to output prices and then consumer goods prices partially and with lags of around one and five months respectively. This means the domestic inflationary effects of supply bottlenecks have yet to be fully felt and can be expected to linger for some time. We reflect this in our inflation outlook, with inflation in tradable goods remaining elevated until 2023, when it starts to fall sharply, reflecting some normalisation in the recent very high levels of input prices. There is a risk of second-round effects, where high inflation, driven by rising goods prices, leads to much higher wage demands in a tight labour market. We discuss this from paragraph 2.22.
This box was originally published in Economic and fiscal outlook – March 2022