
In the final month of the coronavirus job retention scheme (September 2021), over 1 million people were still receiving payments from the scheme. In this box we explore the labour outcomes, up to January 20222, for this population after the closure of the scheme, compared to individuals in employment who were not on furlough in September 2021.
This box is based on HMRC data from .
The coronavirus job retention scheme (CJRS) was conceived, developed and opened for business within a matter of weeks from lockdown first being imposed in March 2020. At a final gross cost of £69.3 billion, its aim was to provide a bridge that would allow employers to maintain job matches with their employees until their sales recovered. It was extended several times until its final end date of 30 September 2021, which was beyond the point at which public health restrictions with a significant effect on economic activity had been lifted. With unemployment today at roughly the same level as it was pre-pandemic, and with little sign of it having risen as the CJRS closed, the scheme looks to have exceeded all predictions, including ours, regarding its likely success in avoiding the persistent high unemployment that has followed other recessions.
To provide a window on how people that were still on furlough in the final month of the CJRS have fared in the labour market, we asked HMRC to analyse its administrative data on both the furlough scheme and real-time information (RTI) from the PAYE income tax system to gauge the extent to which having been on furlough affected subsequent labour market outcomes. This analysis covers 894,300 ‘employments’ furloughed at any point in September 2021.a Their status in the RTI data in January 2022 was then compared to that of employments that were not furloughed in September. That allows us to abstract from normal churn in the labour market that sees individuals switching employers or moving into self-employment or out of work.b
The analysis shows that by January, 19.2 per cent of furloughed employments (171,700) were no longer with the employer that furloughed them, whereas 7.6 per cent of non-furloughed employments were no longer with the same employer. That gives an ‘excess’ separation rate of 11.6 per cent or 103,800 employments relative to what would have happened if rates had been identical across the two groups – i.e. that those furloughed in September were more likely to leave their employers than those not furloughed. People may have moved to another job, into self-employment, or into either unemployment or inactivity. Only the former can be tested using the RTI data, which show that 96,800 (45 per cent) of employees included in this analysis who were on furlough in September 2021 and who left their original employer had employment with another employer in January.c In total, 90 per cent of employees that were still on furlough in September 2021 were on a payroll (whether original or another employment) in January 2022.
But of course, some of that excess separation is likely to represent catch-up job moves after a period of furlough-induced hiatus, with the CJRS effectively holding all those remaining on it until the end of the scheme in the same job while those non-furloughed were experiencing normal labour market churn. There is evidence of this in the data: looking back to May 2021 and comparing the total separation rate experienced by the non-furlough September population between then and January 2022 with that of the furloughed population, the excess separation rate in January for those furloughed in September falls to 2.6 percentage points. This reflects essentially no movement in employment within the furlough group between May and September, followed by a big initial post-furlough separation rate broadly making up for that hiatus (11.2 per cent of those furloughed in September left their original employer in October), after which monthly separation rates for the furlough and non-furlough populations have been similar, although somewhat greater in the furlough population.
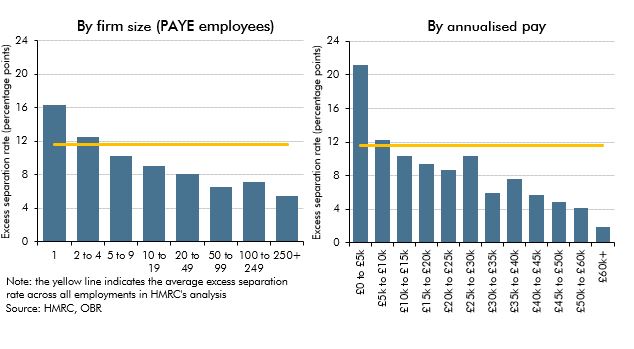
While the simple September-onwards excess separations rates are therefore capturing a combination of both ‘true’ excess separations and delayed churn, they remain a useful lens through which to view different experiences by firm size and by pay:
- By firm size. Variation by firm size (measured in number of PAYE employees) is striking, with simple excess separation rates roughly three times higher for the smallest firms than for the largest. By September, more than half the furlough population in this analysis came from firms with fewer than 10 employees (508,000 employments) – a proportion that had risen steadily in the final months of the CJRS.
- By monthly pay. Variation by pay is even more striking, with simple excess separation rates by January 2022 for those on the lowest monthly pay more than 11 times higher than those on the highest pay. This could reflect the relatively low cost to employers of maintaining furlough payments to employees that worked few hours meaning they did so despite little prospect of the job continuing beyond furlough. In this analysis, a third of furlough employments in September were on pay equivalent to less than £10,000 a year (308,300 employments) and almost two-thirds on less than £20,000 a year (582,400).
We also asked HMRC to analyse the data by sector and by age of employee, but the results were less striking, with excess separation rates uneven across sectors and age groups.
Chart F: Excess separation rates by firm size and pay in furloughed employments
This box was originally published in Economic and fiscal outlook – March 2022