"It is the duty of the Office to examine and report on the sustainability of the public finances"
Economic and fiscal outlook – March 2025
The latest update of our forecasts was published on 26 March 2025 in the March 2025 Economic and fiscal outlook. Read the Executive summary for the key messages of our forecast or the full report on our website.
Chapter 2 sets out our forecasts for the economy over a five-year horizon. We cover our latest forecast changes in light of recent developments and the effect of policies in the Spring Statement.
In Chapter 3, details the policy measures announced since October 2024, provides an update on selected previous measures, and discusses policy risks and uncertainties.
Chapters 4-6 sets out our forecasts for receipts and public spending over a five-year horizon. We also explain our loans and other financial transactions forecasts. All this, together with new policy decisions, builds the outlook for borrowing and debt.
In Chapter 7, we assess the Government against its fiscal targets and evaluate their likelihood of being met on current policy under our central forecast. We consider the uncertainty around our economic and fiscal forecasts and the risks to the Government meeting its targets. We also test the sensitivity of our fiscal forecasts in an alternative economic scenario.
Annex A contains detailed summary tables setting out our economic and fiscal forecasts.
Information or data which has been released alongside the Economic and fiscal outlook or as a result of external requests, since the original publication of the main document.
This Economic and fiscal outlook (EFO) sets out our central forecast and the uncertainties that surround it for the five years to 2029-30, taking account of recent data and government policies announced since our last forecast, up to and including the March 2025 Spring Statement. The forecasts presented in this document represent our collective view as the three independent members of the OBR’s Budget Responsibility Committee (BRC). We take full responsibility for the judgements that underpin them and for the conclusions we have reached.
As always, we have been greatly supported in our work by the staff of the OBR. We are very grateful for their hard work and expertise. We have also drawn on the work and expertise of officials across government in preparing these forecasts. We are grateful for their engagement and insight.
The date for this forecast was announced on 16 December, giving four weeks more than the ten weeks’ notice required by the Memorandum of understanding between the Office for Budget Responsibility, HM Treasury, the Department for Work and Pensions and HM Revenue and Customs (MoU).
We published the timetable of the key stages of the forecast on 22 January, once it had been agreed by signatories of the MoU. Overall the forecast process for this EFO proceeded smoothly. The exception was the process around welfare and employment support policies, which are a subset of the wider package of reforms and policy ambitions announced in the Pathways to Work Green Paper published on 18 March. Details of the policy package were sent to us very late in the process, and late notice of changes and incomplete analysis hampered our ability to reflect these measures in our forecasts:
Policy costings information on the direct fiscal effects of some measures was received late and without sufficient detail. So far as some of the measures are concerned, we have certified the Government’s estimates of their fiscal effects as reasonable and central, but with a high degree of uncertainty attached to them. So far as one measure is concerned, we certified it only on the basis that it was a provisional estimate that would be subject to more comprehensive analysis prior to our next forecast. This is set out in detail in Chapter 3. In addition, relatively small changes were made to the policy parameters of two welfare measures following the costings certification deadline. As a result, we have not been able to certify these costings but have used the Government’s estimates in this forecast and will return to them in our next forecast.
We were unable to incorporate most of the supply-side impacts of these policies in our economy forecast due to insufficient information from the Government on the policy details and analysis of their likely economic effects. We were not, in the limited time available, able to develop our own analysis.We will therefore incorporate an estimate of these impacts in our next forecast.
On this basis, we plan to work with the Treasury and DWP to further scrutinise both the direct and indirect effects of these welfare and employment support policies ahead of our next forecast, alongside the effects of any further measures from the Green Paper that have been sufficiently developed.
The recommendations of our review into the preparation of the March 2024 forecast for departmental expenditure limits (DEL), which were published alongside our previous EFO in October, have continued to be implemented in the production of this forecast.
The timetable for the production of this forecast was as follows:
OBR staff prepared an initial economy forecast, drawing on data released since our previous forecast in October 2024 and incorporating our preliminary judgements on the outlook for the economy. This economy forecast was sent to the Chancellor on 21 January.
Using the economic determinants from this forecast (such as the components of nominal income and spending, unemployment, inflation, and interest rates), we commissioned updated forecasts from the relevant government departments for the various tax and spending items that in aggregate determine the position of the public finances. We discussed these in detail with the officials producing them, which allowed us to investigate proposed changes in forecasting methodology and to assess the significance of recent tax and spending outturn data. In many cases the BRC requested changes to methodology and/or the interpretation of recent data. This first fiscal forecast was finalised on 3 February, and we sent a note that described the main elements of it to the Chancellor the following day.
As the process continued, we identified further key judgements that we would need to make for our economy forecast. Where we thought it would be helpful, we commissioned analysis from the relevant teams in the Treasury. We then produced a second pre-measures economy forecast, which incorporated the latest data, and the economic implications of our first fiscal forecast.
This second economy forecast provided the basis for the next round of fiscal forecasts. Discussions with HMRC, DWP and other departments gave us the opportunity to follow up our requests for further analysis, methodological changes, and alternative judgements from the previous round. We finalised our second fiscal forecast on 18 February and sent a summary of the forecast to the Chancellor the following day.
In parallel, we undertook a process of engagement and analysis to assess the set of policy measures to be announced before or alongside the forecast that we deemed could have specific effects on our economy forecast. This involved several rounds of engagement with the Treasury and other government departments as both the specification of policies, and our assessment of their impact were refined.
We also scrutinised the costing of individual tax and spending measures announced since our October 2024 forecast. As usual, OBR staff and the BRC requested further information and/or changes to almost all the draft costings prepared by HMRC, DWP and other departments.
We then produced a third and final pre-measures economy forecast, in which we took on the latest data and incorporated judgements embodied in our fiscal forecast. This final pre-measures economy forecast was based on energy and financial market data averaged over the 10 working days to 12 February. It was sent to the Treasury on 24 February.
Alongside the development of the final economy forecast we made an initial assessment of the economic and fiscal effects of the emerging policy package. This built on earlier analysis that allowed us to factor in an initial package of measures that was provided by the Treasury on 5 March. We incorporated this package into a preliminary post-measures forecast, in order to provide an early view on the effect of policy measures on the economy and public finances, which we sent to the Chancellor on 10 March. This forecast round was produced using our internal ready-reckoner models (rather than being sent to departmental forecasters).
In line with the agreed timetable, on 12 March the Treasury provided the final package of measures that would cause movements in our economy forecast. We sent the resulting final economy forecast to the Treasury on 17 March and a near-final fiscal forecast on 18 March. Final policy decisions were provided by the Treasury on 19 March and our forecast was then finalised on 21 March and sent to the Treasury on the same day.
The Treasury made a written request, as provided for in the MoU between us, that we provide the Chancellor and an agreed list of her special advisers and officials with a near-final draft of the EFO on 21 March. This allowed the Treasury to prepare the Chancellor’s statement and accompanying documents. We also provided pre-release access to the full and final EFO on 24 March.
During the forecasting period, the BRC held dozens of scrutiny and challenge meetings with officials from other departments, in addition to numerous further meetings at staff level and with external stakeholders. We have been provided with all the information and analysis that we requested and have come under no pressure from Ministers, advisers, or officials to change any of our conclusions. The BRC met with the Chancellor on two occasions to discuss the forecast over the course of its production (on 5 February and 19 February) and one of the Chancellor’s special advisers attended three of the analytical focus groups that we held with Treasury officials. A full log of our substantive contact with Ministers, their offices and special advisers can be found on our website. This includes the list of special advisers and officials who received the near-final draft of the EFO on 21 March.
We would be pleased to receive feedback on any aspect of the content or presentation of our analysis. This can be sent to [email protected].
The Budget Responsibility Committee
Richard Hughes, Professor David Miles CBE and Tom Josephs
Chapter 1: Executive summary
Overview
1.1 The economic and fiscal outlook has become more challenging since the Autumn Budget. Domestic output stagnated in the second half of 2024 and business and consumer confidence have trended lower recently. European energy prices have risen again, and government bond yields are up by around ½ a percentage point. The outlook has also become more uncertain with two geopolitical risks highlighted in our 2022 Fiscal risks and sustainability report beginning to crystallise: upward pressure on defence spending and a tightening of global trade restrictions. And recent UK population, labour force, and output data do not provide a clear signal about domestic economic prospects.
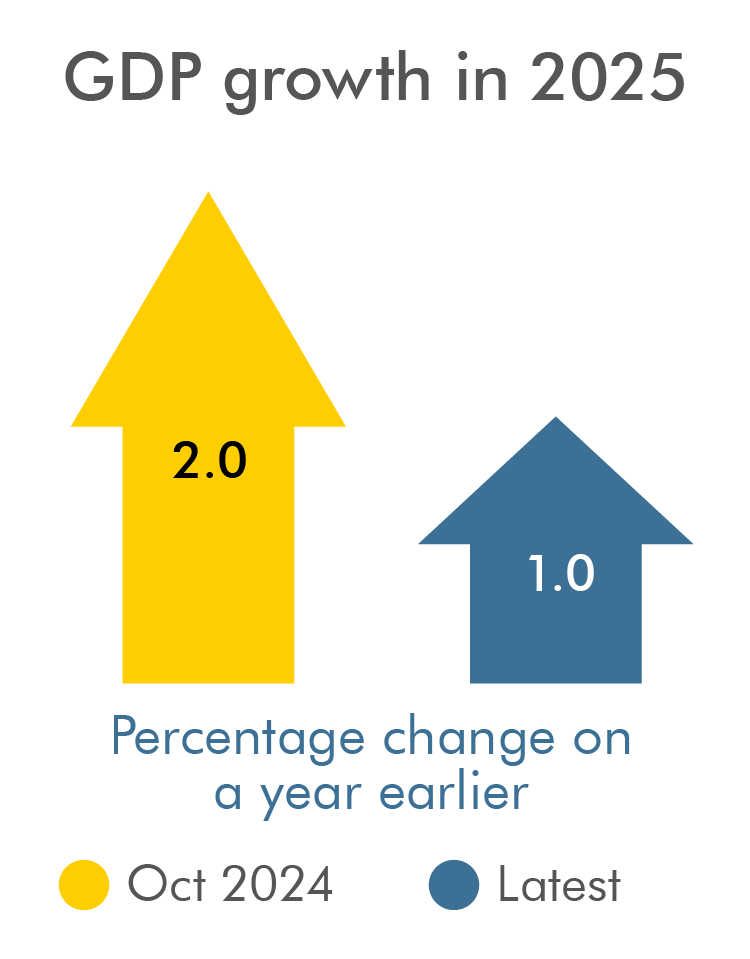
1.2 Against this more challenging and uncertain backdrop, we now expect real GDP growth of 1.0 per cent this year, half the rate in our October forecast, before it recovers to average around 1¾ per cent over the rest of the decade. While the Government’s planning reforms deliver a modest boost to the level of potential output of 0.2 per cent in 2029, its cumulative growth between 2023 and 2029 is still ½ a percentage point lower than we projected in October, and the level of productivity is over 1 per cent lower. Higher energy and food prices and more persistently high wage growth cause inflation to rebound to a quarterly peak of 3.7 per cent in mid-2025, before returning to target over the rest of the forecast.
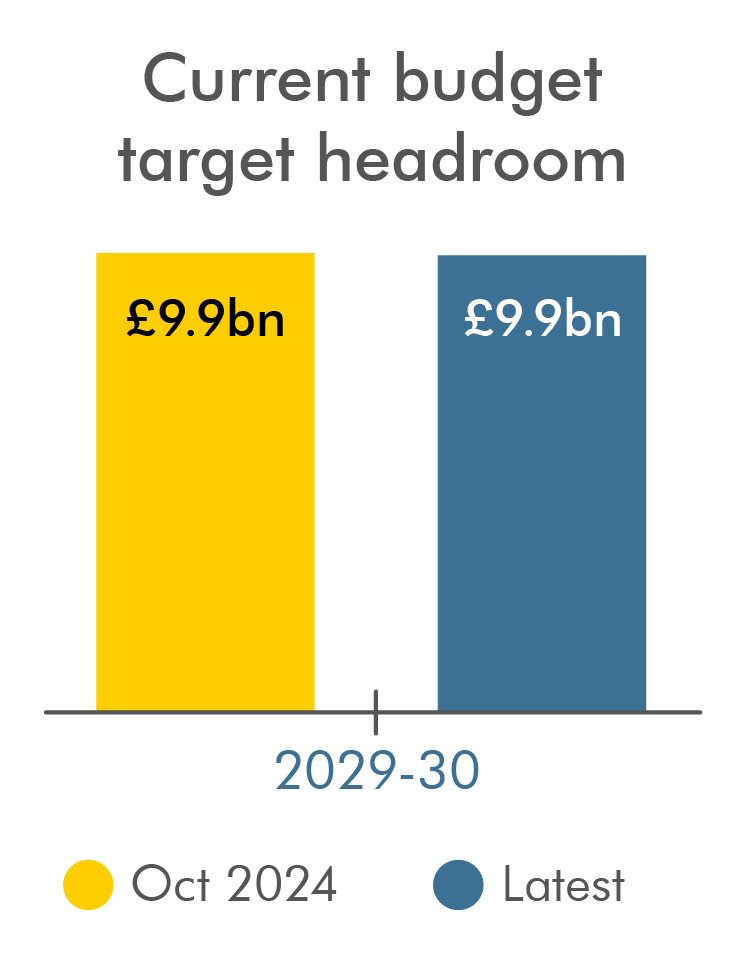
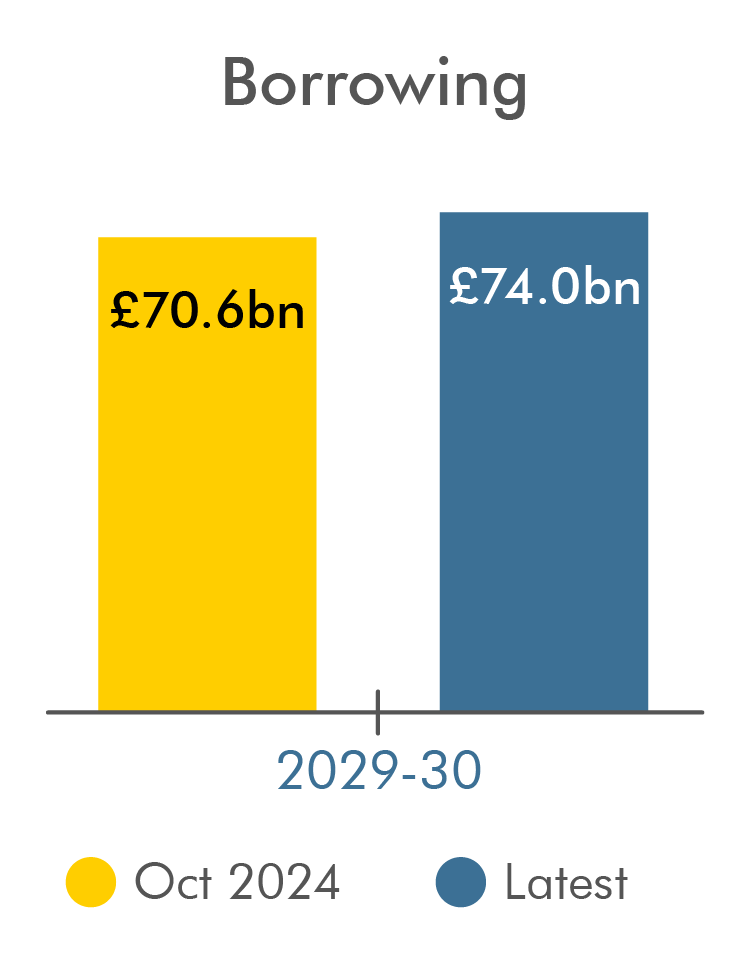
1.3 The underlying fiscal outlook has also deteriorated since October. Higher debt interest payments and weaker-than-expected receipts take the current balance from a surplus of £9.9 billion to a deficit of £4.1 billion in 2029-30, before accounting for new policies. Government policies, notably the direct savings from welfare reforms and the reduction in day-to-day departmental spending, and the indirect boost to receipts from planning reforms, raise £14.0 billion in 2029-30, offsetting the underlying deterioration. This means that the fiscal rules for a current balance and for net financial liabilities to be falling in 2029-30 are both met by similar small margins to October of £9.9 billion and £15.1 billion respectively. But borrowing is projected to be £3.5 billion higher and debt 0.6 per cent of GDP higher at the end of the decade than in our October forecast.
1.4 Significant uncertainty surrounds domestic and global economic developments. If the projected recovery in UK productivity growth fails to materialise, and it continues to track its recent trend, then output would be 3.2 per cent lower and the current budget would be 1.4 per cent of GDP in deficit by the end of the decade. A 0.6 percentage point increase in Bank Rate and gilt yield expectations across the forecast would eliminate current balance headroom. And if global trade disputes escalate to include 20 percentage point rises in tariffs between the USA and the rest of the world, this could reduce UK GDP by a peak of 1 per cent and reduce the current surplus in the target year to almost zero.
Economic outlook
1.5Since the October forecast, developments in outturn data and indicators of business, consumer and market sentiment have, on balance, been negative for the economic outlook. The ONS has revised up the historical size of the UK workforce by 1.5 per cent (½ a million) in 2024. It also revised up the level of real GDP by 0.8 per cent in mid-2024. But real GDP growth largely stagnated over the second half of 2024 rather than continuing to grow, as we expected in the October forecast, meaning the level of output was broadly in line with our previous expectations by the end of 2024. The net effect of these developments was that the measured level of productivity (output per hour worked) at the end of 2024 was 1.3 per cent lower than in the October forecast. In recent months, indicators of both business and consumer confidence have also trended lower. And European gas prices have risen while government bond yields have increased across many advanced economies.
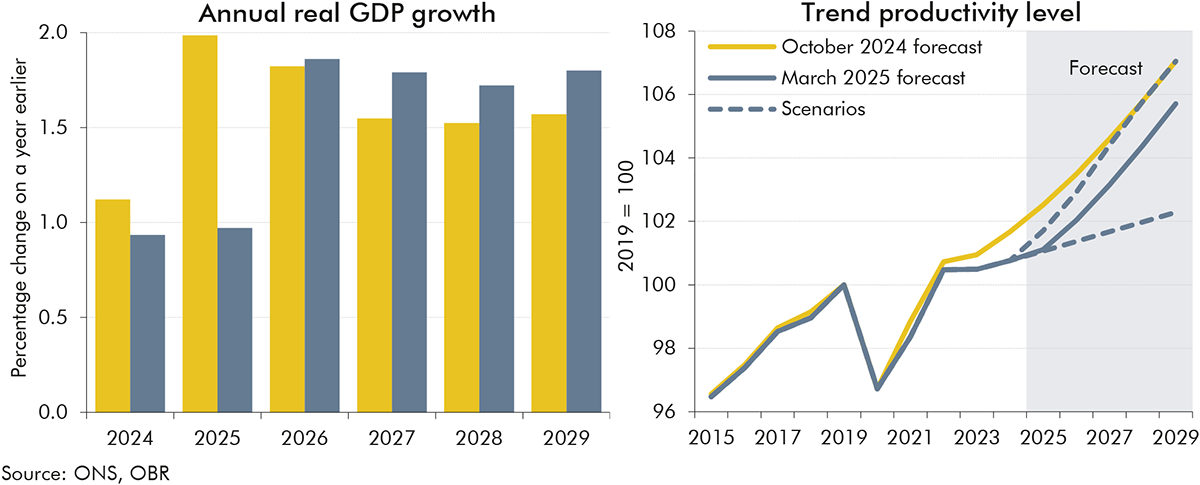
1.6In our central forecast, real GDP is now projected to grow by 1.0 per cent in 2025, half the 2.0 per cent assumed in October. Around one-third of the lower growth this year reflects what appears to be structural weakness. This is concentrated in productivity, and its trend level is 1.3 per cent lower at the forecast horizon than expected in October. The remaining two-thirds is due to what appear to be cyclical, temporary, factors including higher interest rate expectations, increases in gas prices, and elevated uncertainty. GDP growth is expected to accelerate to 1.9 per cent in 2026 as monetary policy eases, gas prices fall back, and slack in the economy is taken up. Growth then averages 1¾ per cent over the rest of the decade. Government policies temporarily boost demand by 0.1 per cent in the middle of the forecast and permanently raise supply by 0.2 per cent at the forecast horizon. Overall, the permanent hit to productivity is partly offset by stronger workforce growth, leaving cumulative growth in potential output between 2023 and 2029 ½ a percentage point lower than forecast in October. There remains considerable uncertainty about how to interpret recent developments in UK labour force, GDP, and productivity data, and in US and global trade policy. We therefore explore the economic and fiscal implications of alternative scenarios for both domestic productivity growth and global tariff policies.
Chart 1.1: Real GDP growth and trend productivity level
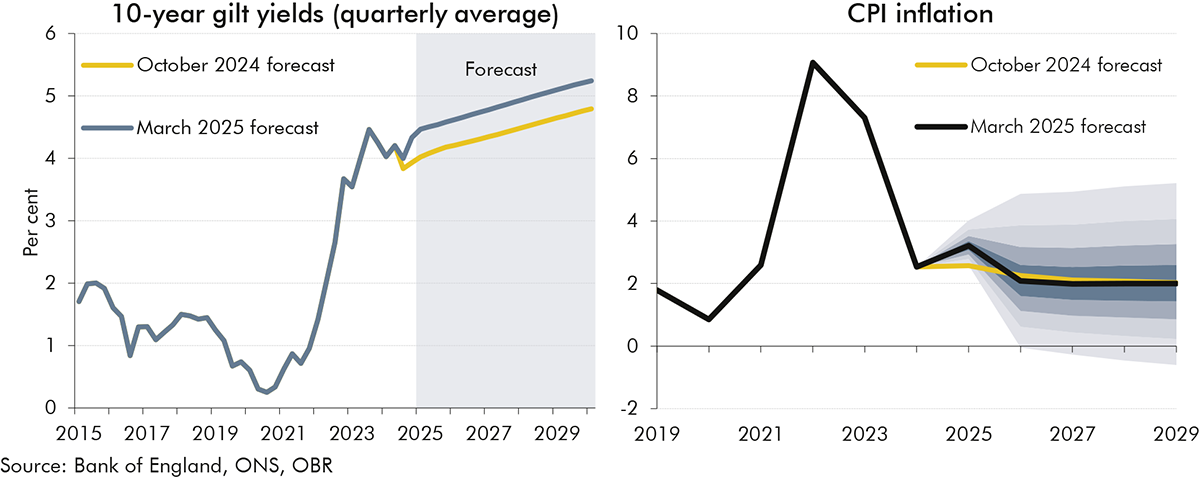
1.7Interest rate expectations have risen since our October forecast. Bank Rate is expected to fall from its current level of 4.5 per cent to 3.8 per cent from mid-2026 onwards. Expectations are, on average, around a ¼ percentage point higher than in the October forecast. UK 10-year gilt yields have also risen by around ½ a percentage point since early October with similar moves in many other advanced economies. Interest rate expectations have remained highly volatile over this period, with 10-year gilt yields varying by a full percentage point between 3.9 and 4.9 per cent.
1.8Annual CPI inflation is forecast to rise from 2.5 per cent in 2024 to 3.2 per cent in 2025, 0.6 percentage points higher than forecast in October. Wholesale gas prices are expected to peak at around 130 pence a therm in 2025, which is around 30 per cent higher than forecast in October. Oil prices are forecast to average 74 dollars a barrel in 2025, 4 per cent higher than in October. The resulting increases in the Ofgem price cap, coupled with higher food prices and the increase in regulated water bills, are expected to push monthly inflation up to a peak of 3.8 per cent in July 2025. From 2026 onwards, CPI inflation falls rapidly back to around the 2.0 per cent target as energy prices drop, food price inflation falls, and wage growth eases back from currently elevated rates.
Chart 1.2: Gilt yields and CPI inflation
1.9We expect the unemployment rate to peak at 4.5 per cent (1.6 million people) in 2025 as spare capacity opens up, before falling to its estimated structural rate of 4.1 per cent in 2028. This is 0.4 percentage points (160,000 people) higher in 2025 than assumed in our October forecast, due to a larger negative output gap (greater excess supply) in the near term. Having fallen by over a percentage point since 2019, the employment rate is forecast to decline slightly further from 60.5 per cent in the second half of 2024 to 60.2 per cent in 2029. This is because population ageing outweighs the effects of the forthcoming rise in the state pension age, and a reduction in inactivity due to caring (from a falling birth rate and expanded childcare provision). But this level is 0.3 percentage points higher than forecast in October, due to ONS revisions and recent data suggesting the current trend participation rate is higher than we previously thought. While our fiscal forecast takes account of the direct fiscal costs of some of the welfare policies in the Government’s Pathways to Work Green Paper and their indirect effects on aggregate demand, we have not incorporated most of their supply-side impacts on the labour market. This was due to insufficient information from the Government on the policies announced and analysis of their likely economic effects. We will incorporate our estimate of these impacts in our next forecast.
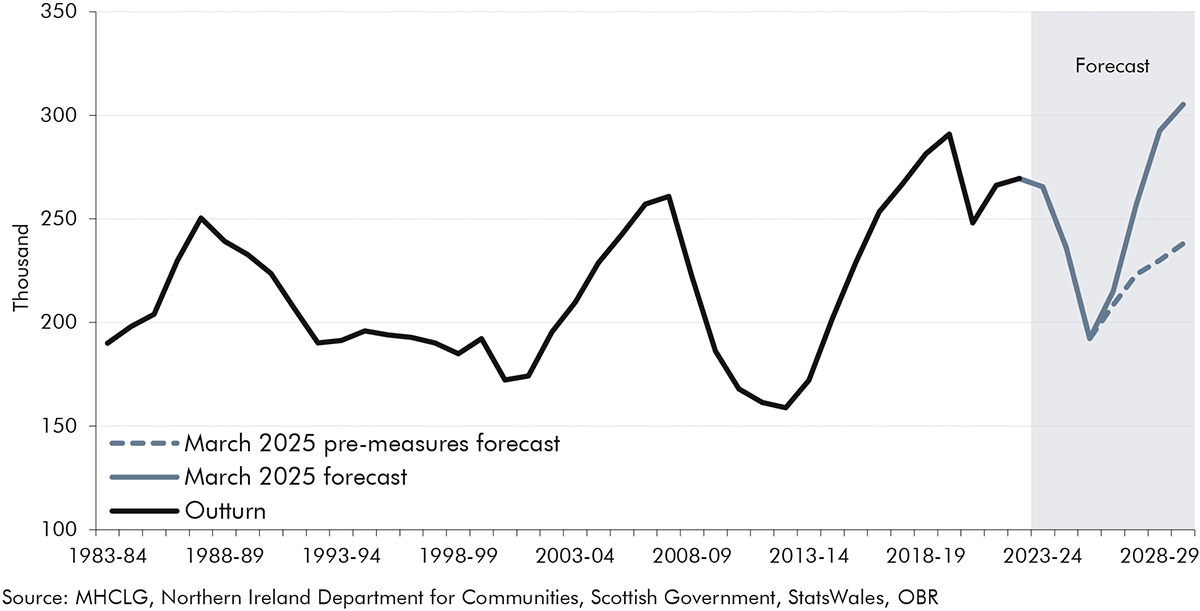
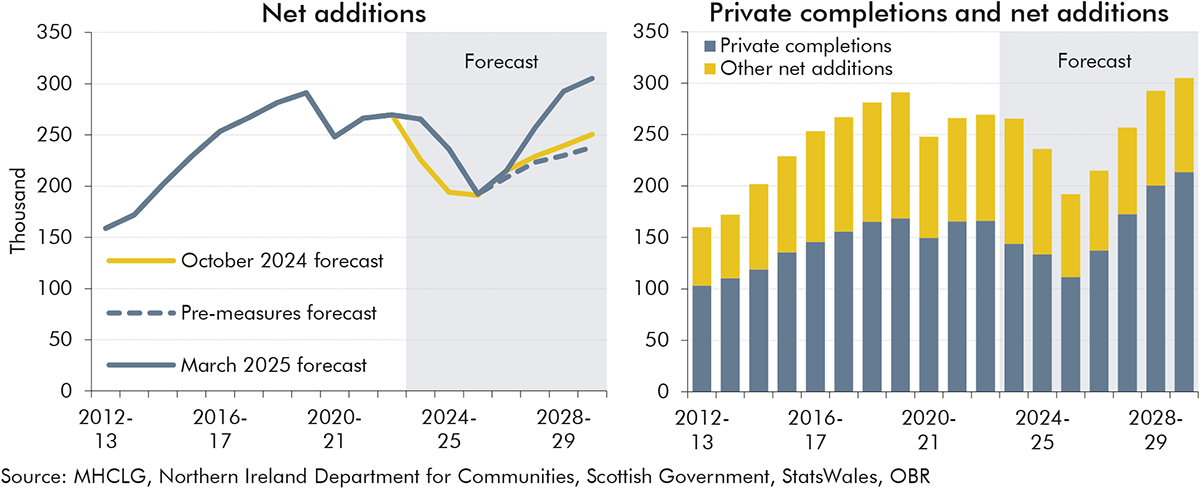
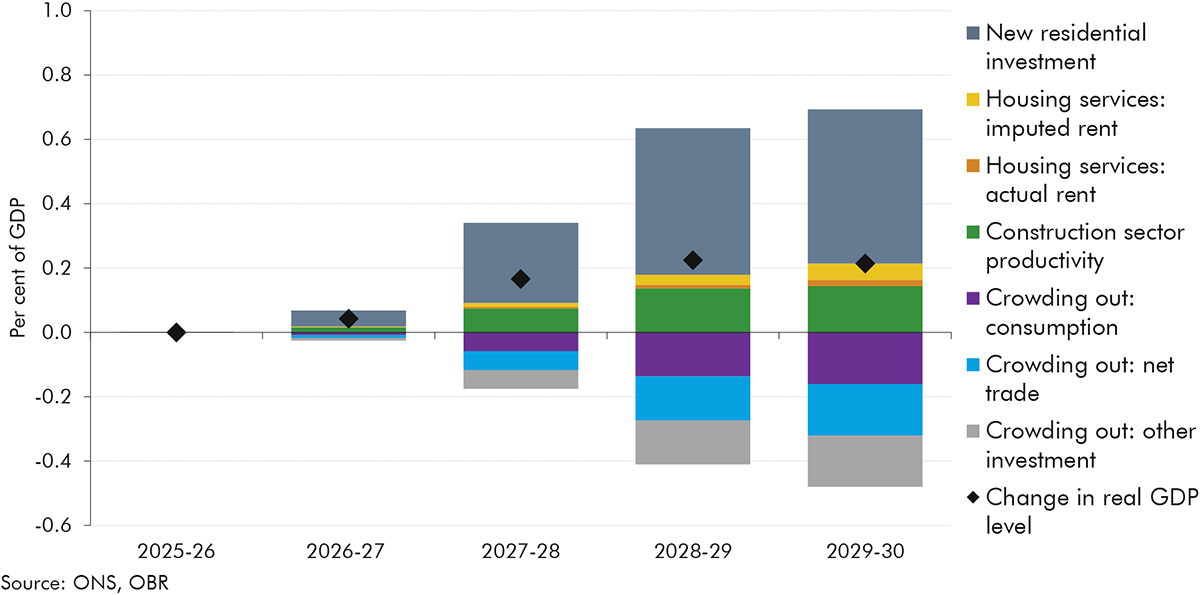
1.10From a 12-year low in 2025-26, net additions to the UK housing stock are forecast to reach 305,000 a year by the end of the decade. From 2025-26 to 2029-30, we project around 1.3 million cumulative net additions to the housing stock. Of this, we estimate an additional 170,000 are due to the Government’s reforms to the National Planning Policy Framework, increasing the total housing stock by around 0.5 per cent in 2029-30. By the fifth year of the forecast, we expect these reforms could add 0.2 per cent to the level of potential output thanks to a boost in the productivity of residential construction and the increased flow of housing services from the higher stock of houses. Over a longer horizon we would expect these effects to build to 0.4 per cent by 2034-35, and we would anticipate a further additional benefit from greater labour mobility and agglomeration effects, adding just under 0.1 per cent to potential GDP by 2034-35.
Chart 1.3: Net additions to the UK housing stock
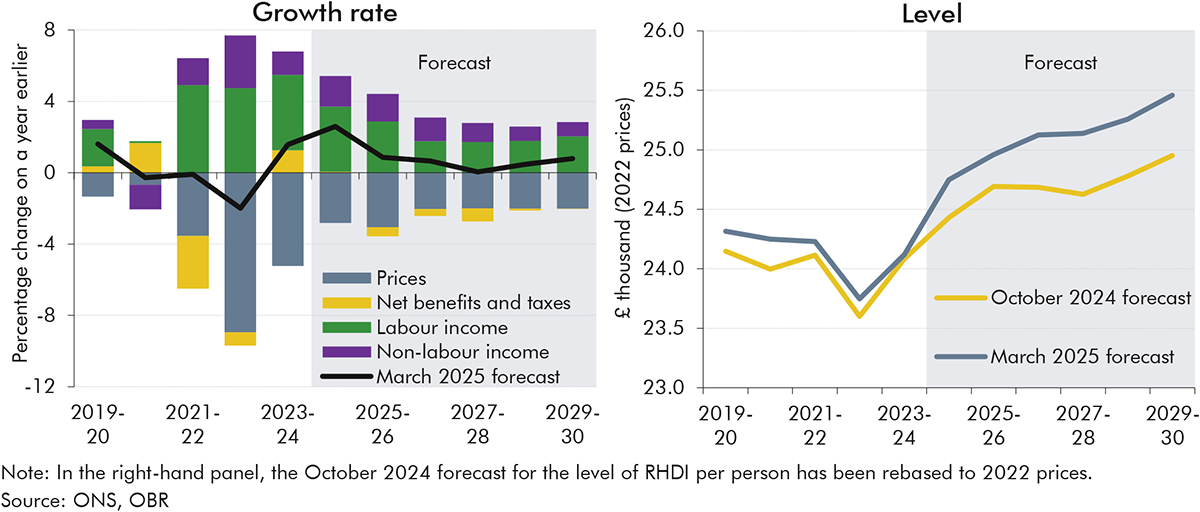
1.11After falls of 0.9 per cent in 2023 and 0.1 per cent in 2024, real GDP per person is expected to recover slightly with growth of 0.3 per cent in 2025, before averaging 1.4 per cent over the rest of the forecast. Nominal earnings growth is forecast to ease from 4.7 per cent in 2024 to 4.3 per cent in 2025, 0.7 percentage points stronger than our October forecast. Nominal earnings growth then averages just over 2 per cent a year from 2026 as the labour market loosens, and firms rebuild margins and have more scope to pass on higher costs from the rise in employer National Insurance contributions (NICs) to employees. Real earnings grow by 1.4 per cent in 2025, stagnate in 2026 and 2027, before growth recovers a little to reach 0.5 per cent in 2029. Real household disposable income (RHDI) per person is expected to grow by an average of around ½ a per cent a year from 2025-26 to 2029-30. Compared to our October forecast, stronger wage growth means RHDI per person growth is slightly higher on average.
1.12Average growth in nominal GDP from 2025-26 onwards is broadly unchanged relative to October. But we expect stronger growth in labour incomes, which have a high effective tax rate, thanks to wage settlement expectations continuing to hold up relative to weak productivity growth and falling inflation. Growth in nominal consumption and corporate profits, two of the other important tax bases, is weaker over the forecast than in October.
Fiscal outlook
1.13Before the impact of new policies, borrowing is projected to be £13.1 billion higher in 2029-30 than in the October forecast. The most significant drivers of this are higher forecast Bank Rate, gilt yields, and RPI inflation, which together raise debt interest costs by amounts rising to £10.1 billion in 2029-30 relative to October. Other spending areas are also higher in the near term, by £5.2 billion in 2025-26, mainly reflecting higher capital spending by local authorities and public corporations, but these increases taper off in the medium term. Receipts in 2024-25 are expected to be £7.6 billion below the October forecast mainly due to weaker-than-expected self-assessment and onshore corporation tax payments. But higher forecast growth in nominal earnings boosts income tax and NICs over the remainder of the forecast, offsetting much of this in-year shortfall. As a result, total pre-measures receipts are down only £0.6 billion in 2029-30 compared with October. By 2029-30, forecast changes to debt interest and tax drive a slightly larger deterioration in the current balance (revenues minus day-to-day spending) than in borrowing, from a surplus of £9.9 billion in October to a deficit of £4.1 billion, before policy changes.
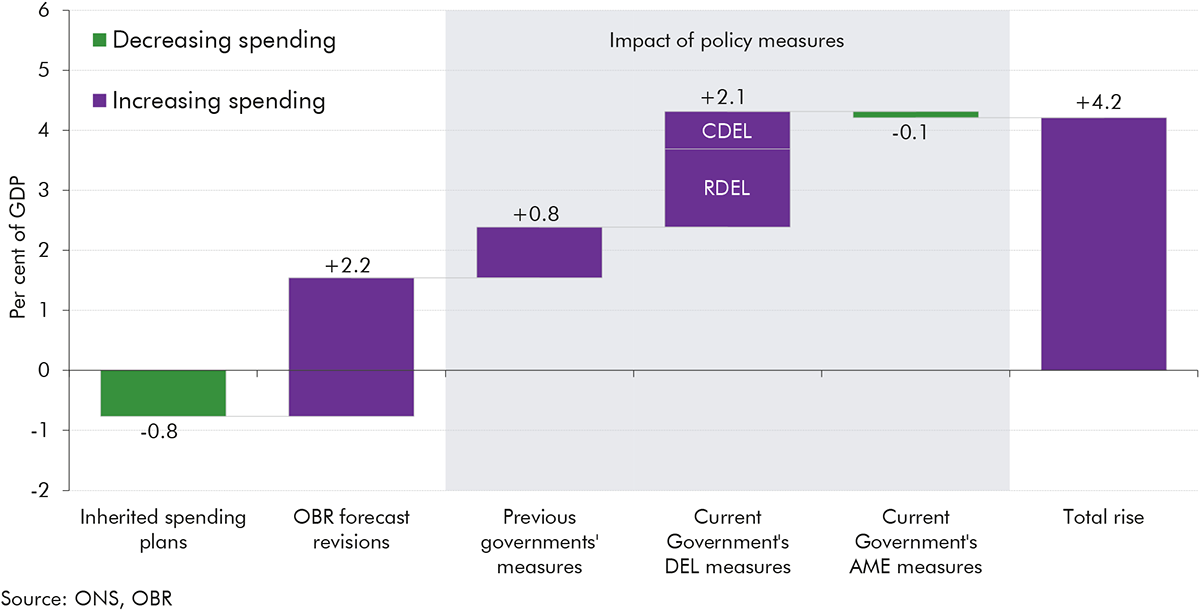
1.14Against this weaker pre-measures fiscal outlook, the Government has announced a set of policies which reduce borrowing by £9.7 billion and improve the current balance by £14.0 billion in 2029-30. These comprise:
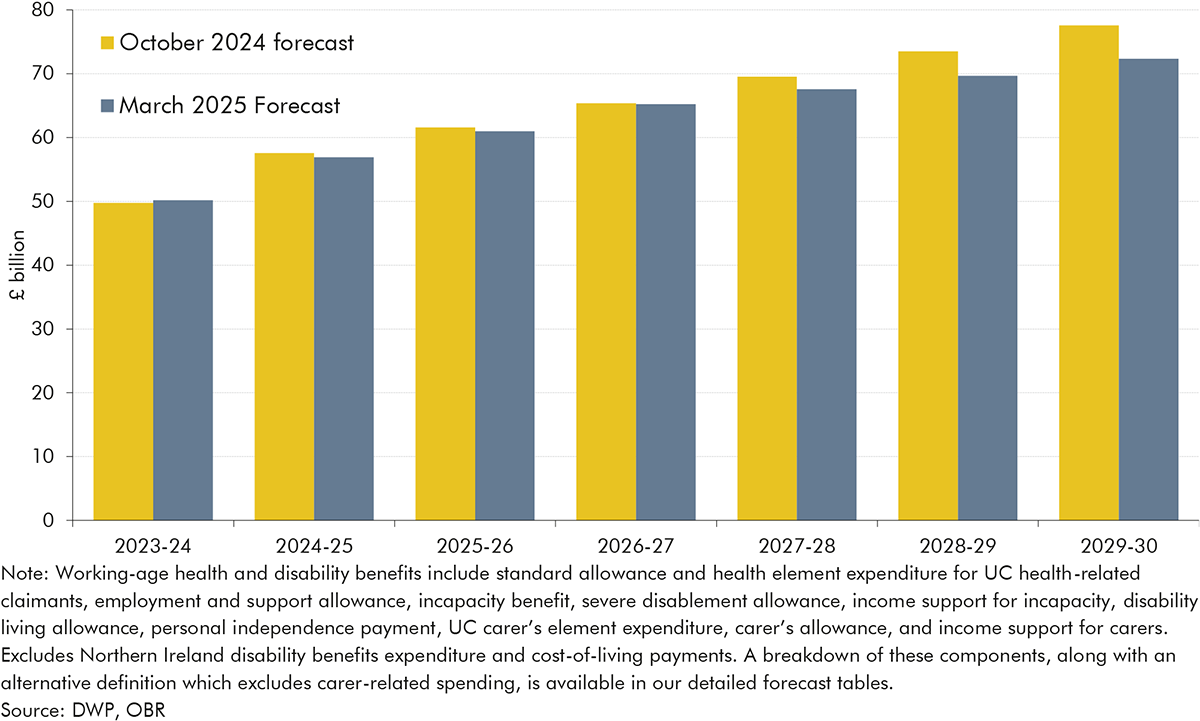
Welfare reforms, announced in the Pathways to Work Green Paper, which are estimated to reduce spending by £4.8 billion in 2029-30. The savings come principally from tightening the gateway for personal independence payment (PIP), which is estimated to reduce PIP awards for around 800,000 claimants, and from reducing the generosity of health-related universal credit (UC) for 3 million families. These reductions are partially offset by an increase in the standard allowance for all of the over 6½ million families on UC, and the decision to reverse the 2023 reforms that tightened the work capability assessment (WCA).
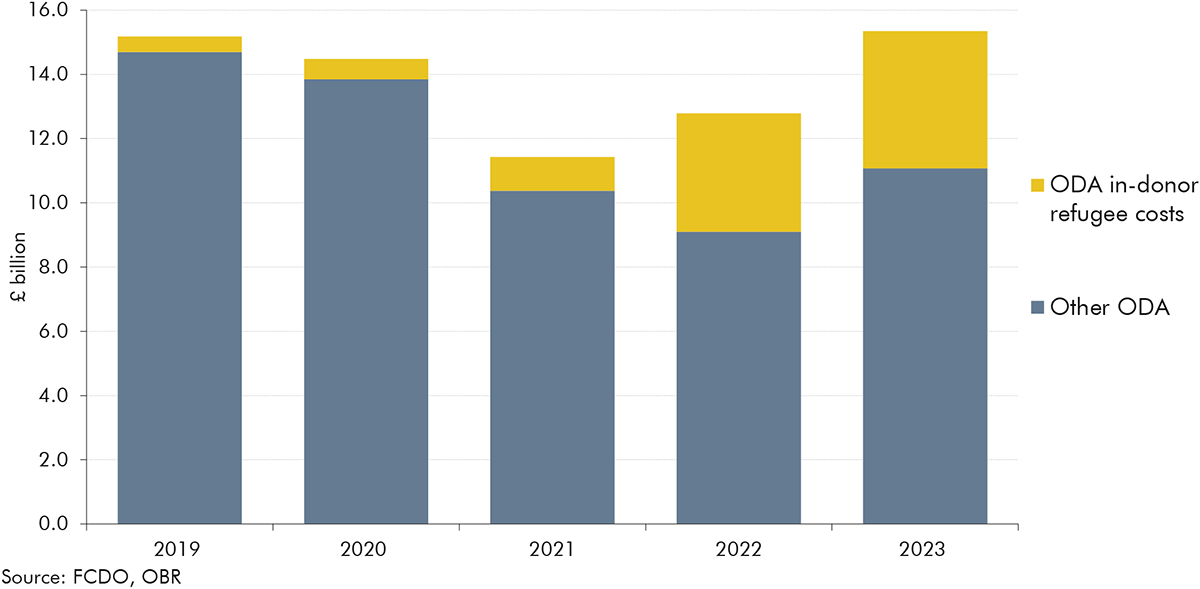
A change in the composition of departmental spending leaves it slightly higher overall by 2029-30. Capital spending is increased across the forecast, reaching £4.4 billion in 2029-30. Current spending is increased in the near term, by £1.7 billion at the peak in 2026-27, to fund new policy commitments including allocation to a ‘transformation fund’. But it is then cut in the final two years of the forecast and by £3.6 billion in 2029-30, despite £1.4 billion of commitments to a DWP employment support package and tax and welfare compliance. The current-to-capital shift in the composition of spending mainly reflects a capital-heavy increase in defence spending to meet the Government’s commitment to spend 2.5 per cent of GDP in 2027-28, which is funded by more current-heavy reductions to Official Development Assistance (ODA).
A small package of tax changes, which raise £2.2 billion in 2029-30. This includes £1.0 billion from tax compliance and debt recovery measures, and £0.7 billion from higher visa and passport fees and increases in council tax, which are offset by higher spending.
The indirect effects of policies lower borrowing by a further £3.4 billion in 2029-30, mainly due to higher receipts as a result of the estimated impact of the Government’s planning reforms on GDP and property transactions.
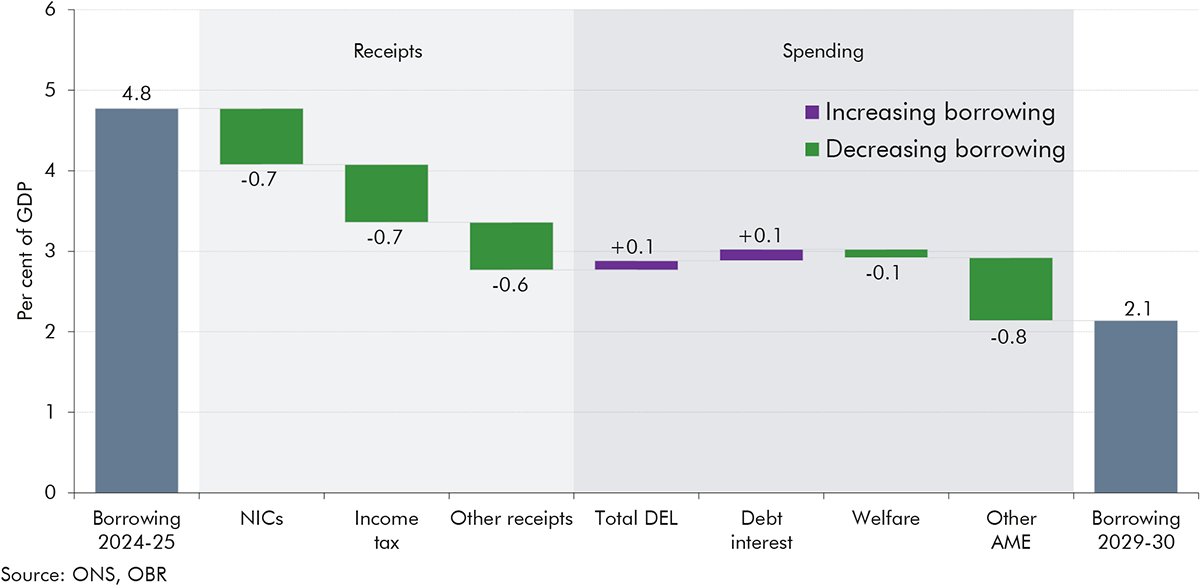
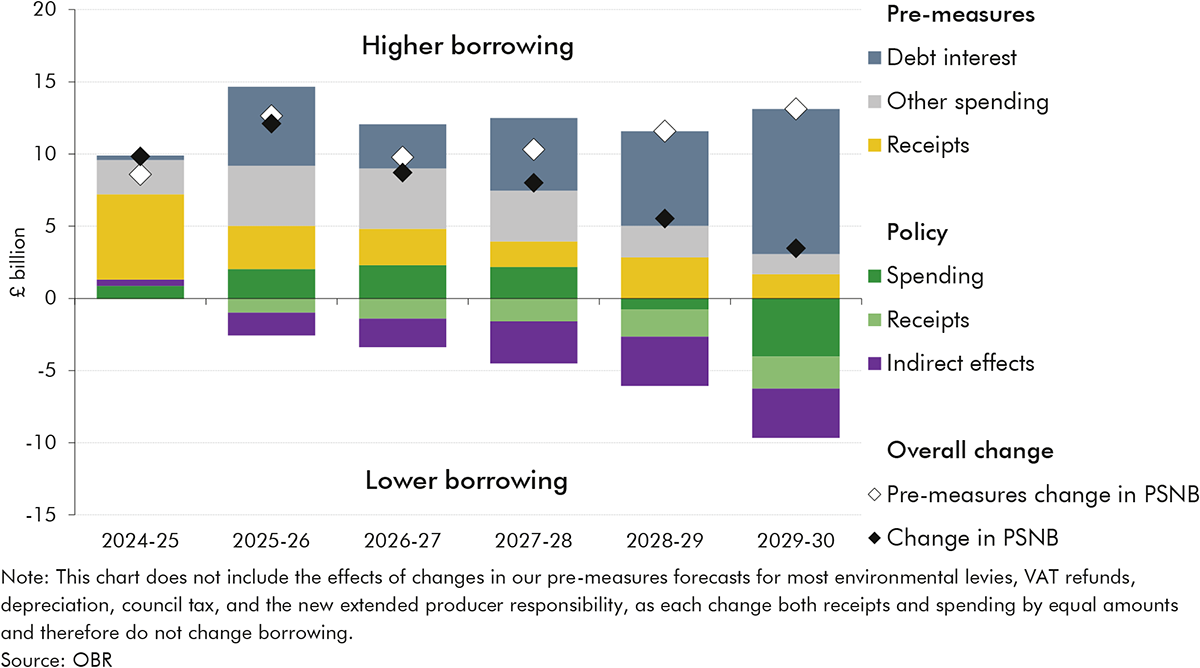
Chart 1.4: Public sector net borrowing: changes since October
1.15Taking account of both forecast and policy changes, public sector net borrowing (PSNB) is forecast to fall from £137.3 billion (4.8 per cent of GDP) this year to £74.0 billion (2.1 per cent of GDP) in 2029-30. Compared to the October forecast, it is higher by £12.1 billion (0.4 per cent of GDP) in 2025-26 falling to £3.5 billion (0.1 per cent of GDP) in 2029-30. A rising tax take contributes three-quarters to the fall in borrowing as a share of GDP over the next five years, with a reduction in spending as a share of GDP contributing the remaining quarter.
Chart 1.5: Public sector net borrowing
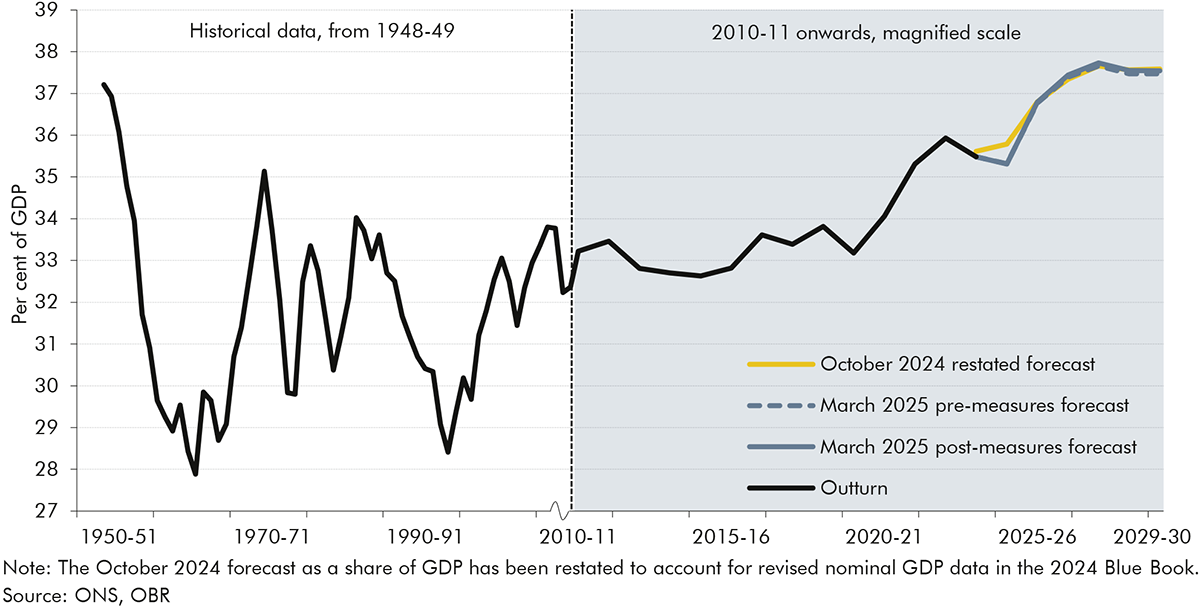
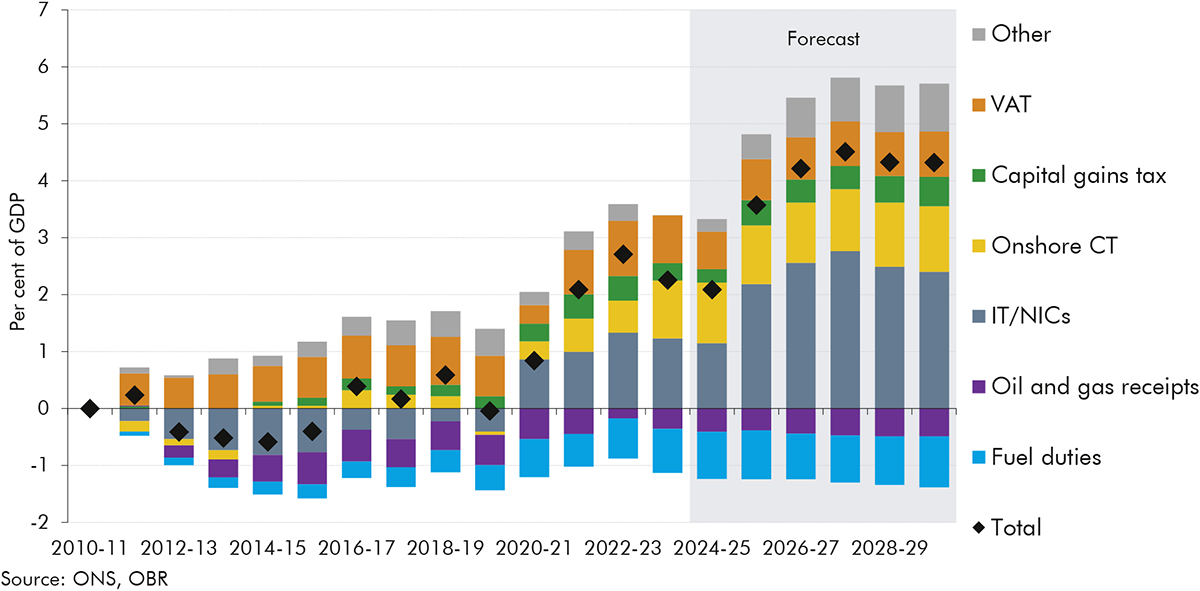
1.16Tax as a share of GDP is forecast to rise from 35.3 per cent this year to a historic high of 37.7 per cent in 2027-28 and remain at a high level for the rest of the forecast. The sharp forecast increase in 2025-26 is largely due to the Autumn 2024 Budget increase in employer NICs, which takes effect in April 2025, and an expected recovery in capital tax receipts. The further forecast rise in the tax take to 2027-28 is mainly due to growth in nominal earnings combined with frozen tax thresholds, further rises in capital taxes, and a boost to receipts from the Temporary Repatriation Facility (TRF) announced at the Autumn Budget as part of the reforms to the non-domicile regime. The tax take is then forecast to level off as personal thresholds are unfrozen, the TRF window closes, and the take-up of electric vehicles reduces fuel duty receipts.
Chart 1.6: National Accounts taxes as a share of GDP
1.17Public spending is forecast to rise to 45.0 per cent of GDP next year, before declining over the remainder of the decade to 43.9 per cent of GDP in 2029-30. Within total spending:
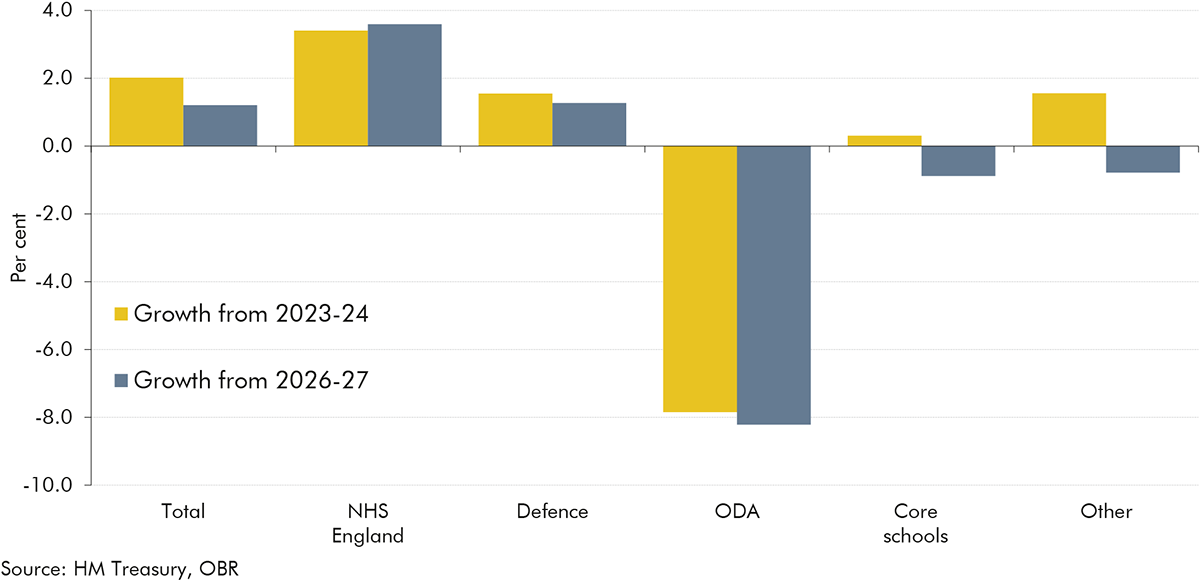
Departmental expenditure limits(DELs) rise over the next three years, from 18.9 per cent of GDP in 2023-24 to a peak of 19.9 per cent of GDP in 2026-27, and then fall back to 19.4 per cent of GDP in 2029-30. Real growth in resource DEL is 4.0 per cent in 2025-26 and then averages 1.2 per cent from 2026-27 onwards, 0.1 percentage points lower than in October. Real growth in capital DEL averages 2.2 per cent over the forecast, and is 1.0 percentage point higher from 2026-27 onwards than in October due to the increase in defence spending.
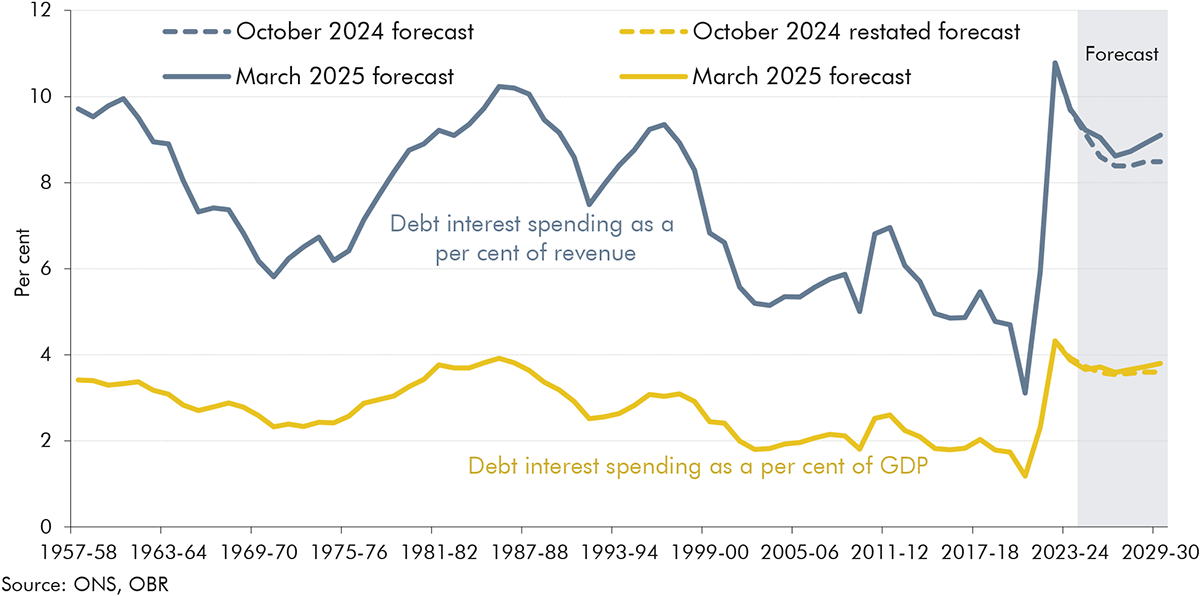
Annually managed expenditure (AME) falls from 25.8 per cent of GDP in 2023-24 to 24.5 per cent of GDP in 2029-30. In the medium term, the decline is driven by welfare spending, which as a result of the latest policy reforms now falls slightly as a share of GDP, and smaller elements of AME including unfunded pensions and student loans. Having risen by around 2 per cent of GDP since 2019-20, debt interest spending is now expected to be broadly flat across the forecast as a share of GDP, rising very slightly in the final years.
Chart 1.7: Public spending as a share of GDP
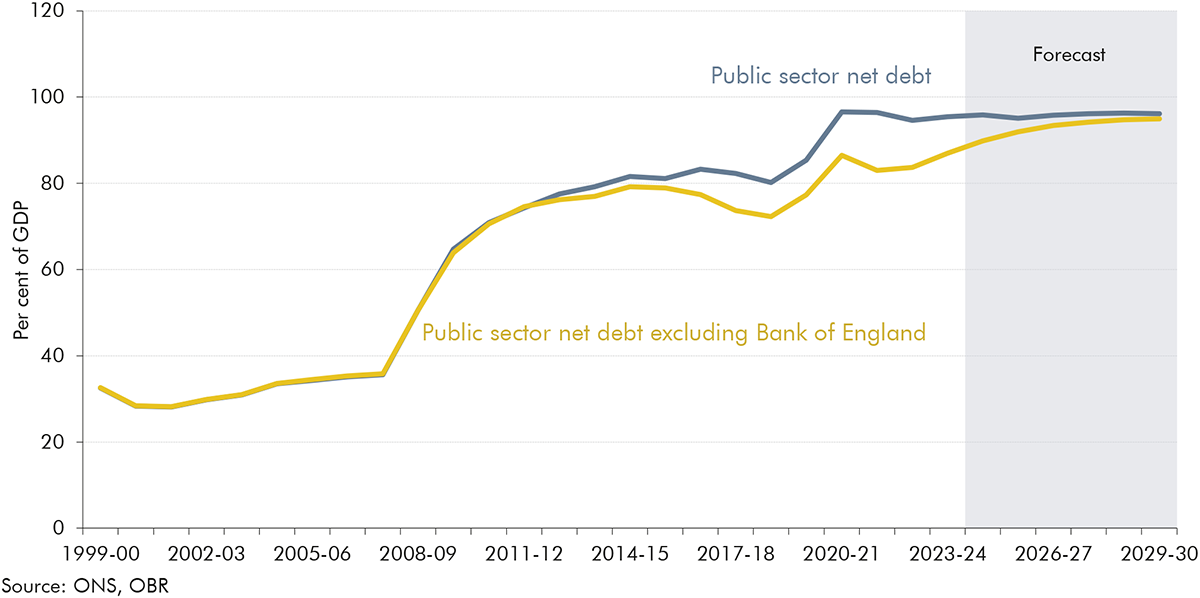
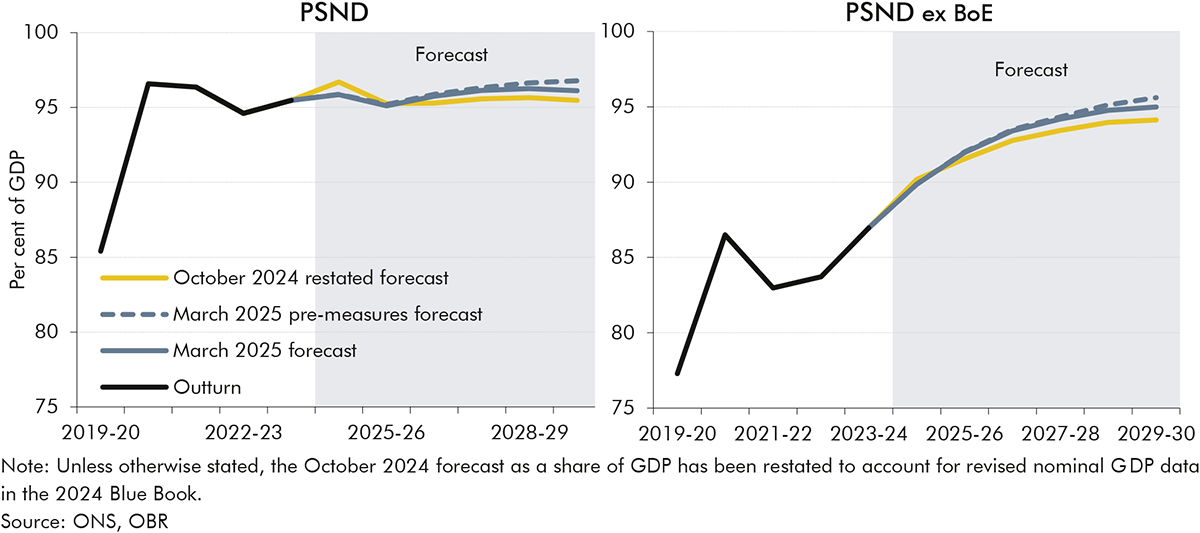
1.18Public sector net debt (PSND) is largely flat over the forecast at 95.9 per cent of GDP this year and 96.1 per cent of GDP in 2029-30. Compared to the October forecast, PSND is 0.8 percentage points lower this year due to ONS revisions, but 0.6 percentage points higher on average from 2026-27 onward mainly due to higher forecast borrowing. Net debt excluding the Bank of England rises in every year of the forecast as a share of GDP. It converges with PSND toward the end of the decade as the Term Funding Scheme and asset purchase facility unwind.
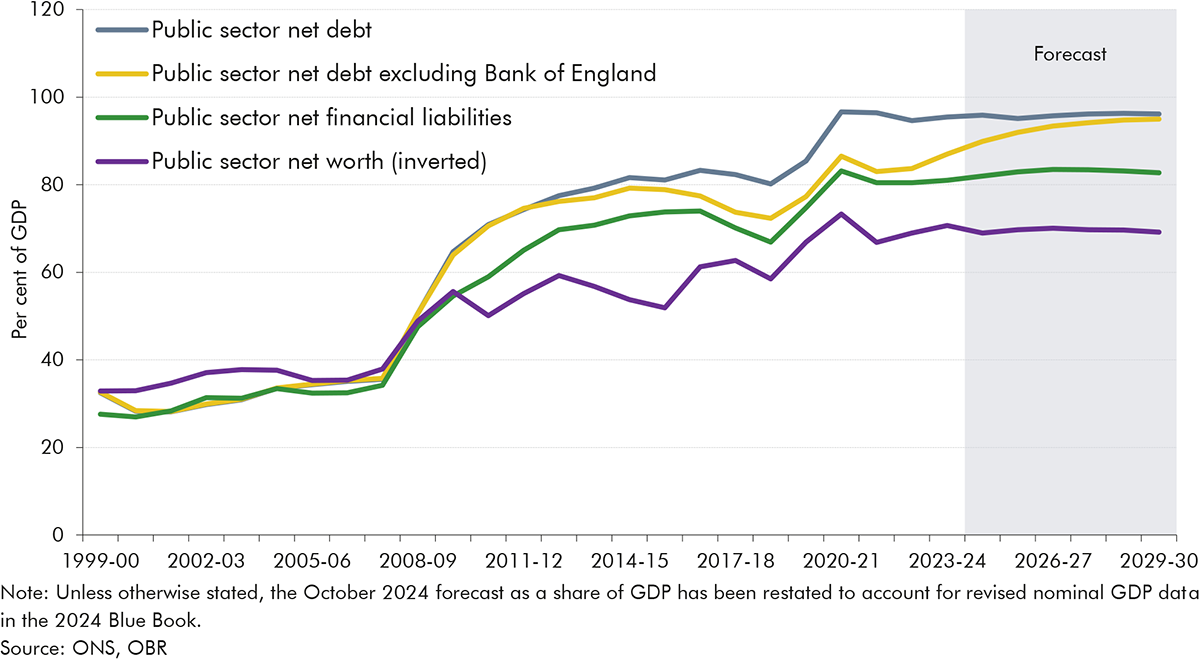
Chart 1.8: Measures of public sector debt
Performance against the Government’s fiscal targets
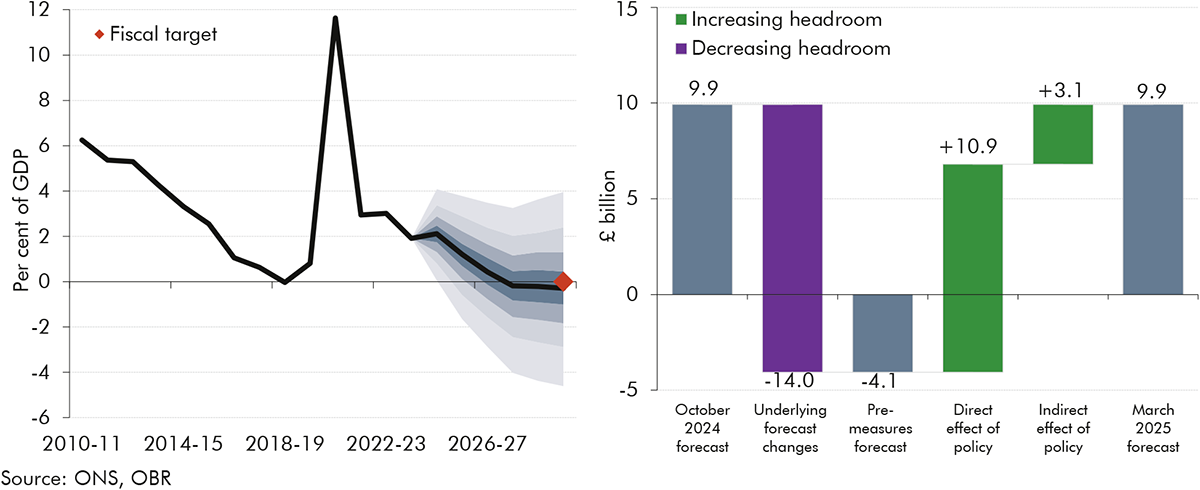
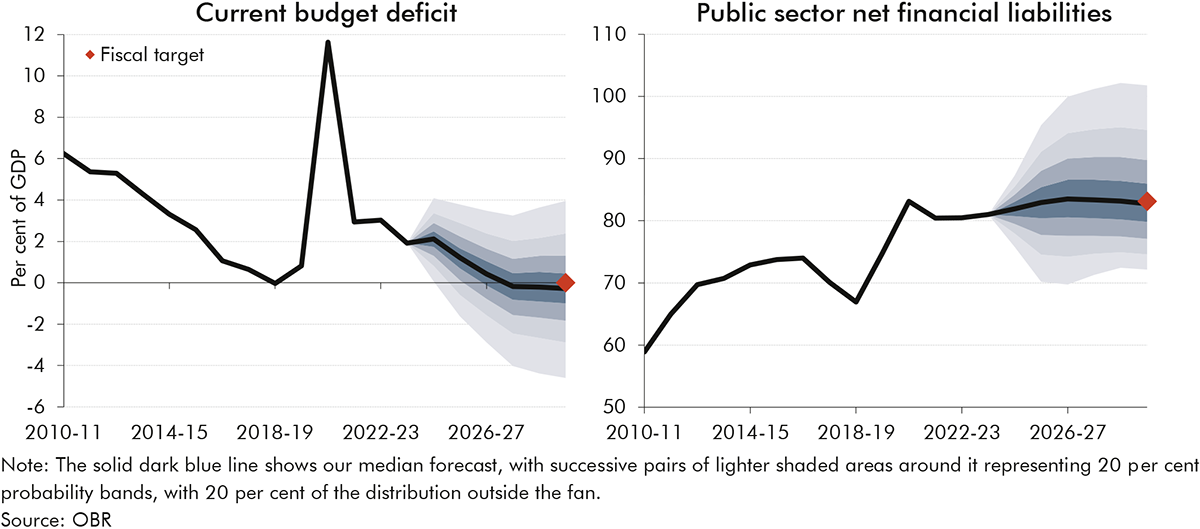
1.19The Government’s fiscal mandate for the current budget to be in balance in 2029-30 is met with headroom of £9.9 billion (0.3 per cent of GDP) in the central forecast. Underlying forecast changes reduced headroom against the current budget by £14.0 billion, so the fiscal mandate would have been missed by £4.1 billion in the pre-measures forecast. Government policies improved the current budget by £14.0 billion so that the mandate is met with identical headroom to October. As set out in the next section, there is significant risk around the central forecast for the current budget. Based on stochastic simulations, the probability of meeting the fiscal mandate is 54 per cent.
Chart 1.9: Current budget deficit fan chart and changes in headroom
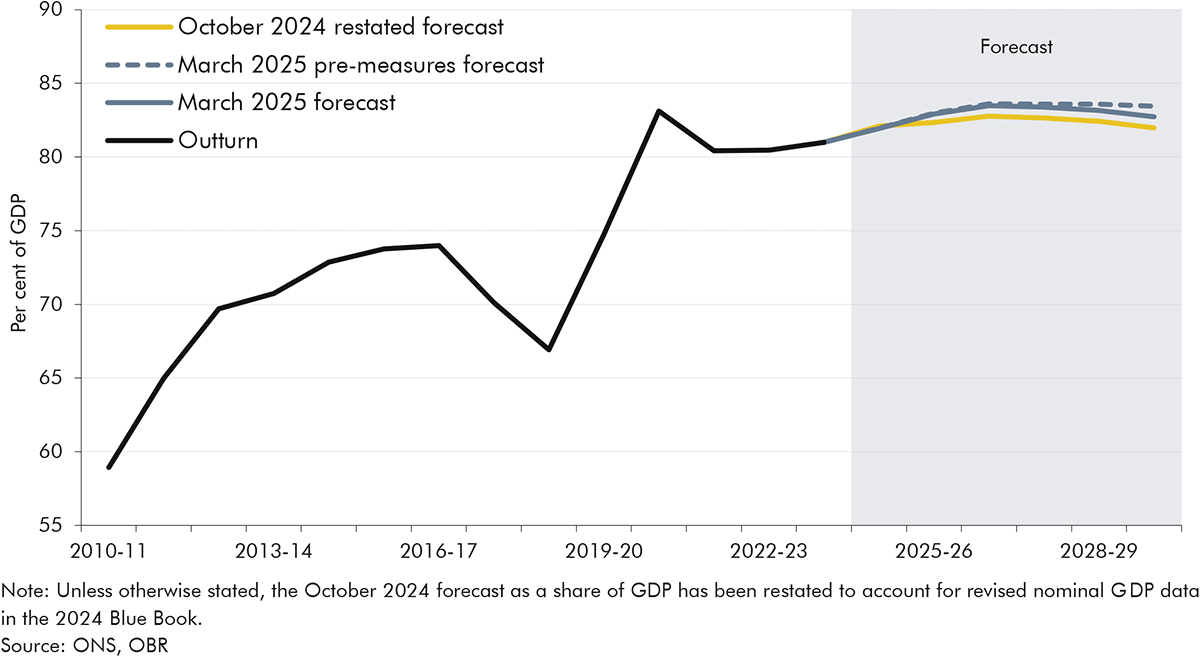
1.20The supplementary target for public sector net financial liabilities (PSNFL) to be falling in the final year of the forecast is also met in the central forecast, with headroom of £15.1 billion (0.4 per cent of GDP). On our central forecast, PSNFL rises from 81.9 per cent of GDP this year to a peak of 83.5 per cent in 2026-27, and falls thereafter to 82.7 per cent in 2029-30. Forecast changes reduced headroom by £10.8 billion, with measures restoring nearly all of it such that the target is met by a £0.6 billion smaller margin relative to October. Based on historical forecast errors, the probability of meeting the supplementary target is 51 per cent.
Chart 1.10: Net financial liabilities fan chart and changes in headroom
Risks and uncertainties
1.21Headroom of £9.9 billion against the fiscal mandate is only one-third of the average of £31.3 billion that Chancellors have set aside against their fiscal rules since 2010. It is also a very small margin compared to the risks and uncertainty inherent in any fiscal forecast. The average absolute final-year revision to pre-measures borrowing over the past ten forecasts has been £19.4 billion. And risks to the forecast are heightened at present given the significant uncertainty surrounding domestic and global economic developments.
1.22Key risks to our economy forecast include:
The outlook for productivity growth, one of the most important forecast judgements, is uncertain both in terms of its level and growth rate. Trend productivity growth averages 1.0 per cent a year in our central forecast. If the recent weakness in trend productivity growth persists and growth averages just 0.3 per cent a year, the current budget would be in deficit by 1.4 per cent of GDP in 2029-30. If the recent weakness proves to be entirely cyclical and so trend growth in output per hour averages 1.2 per cent a year, the current budget would be in surplus by 0.9 per cent of GDP in 2029-30.
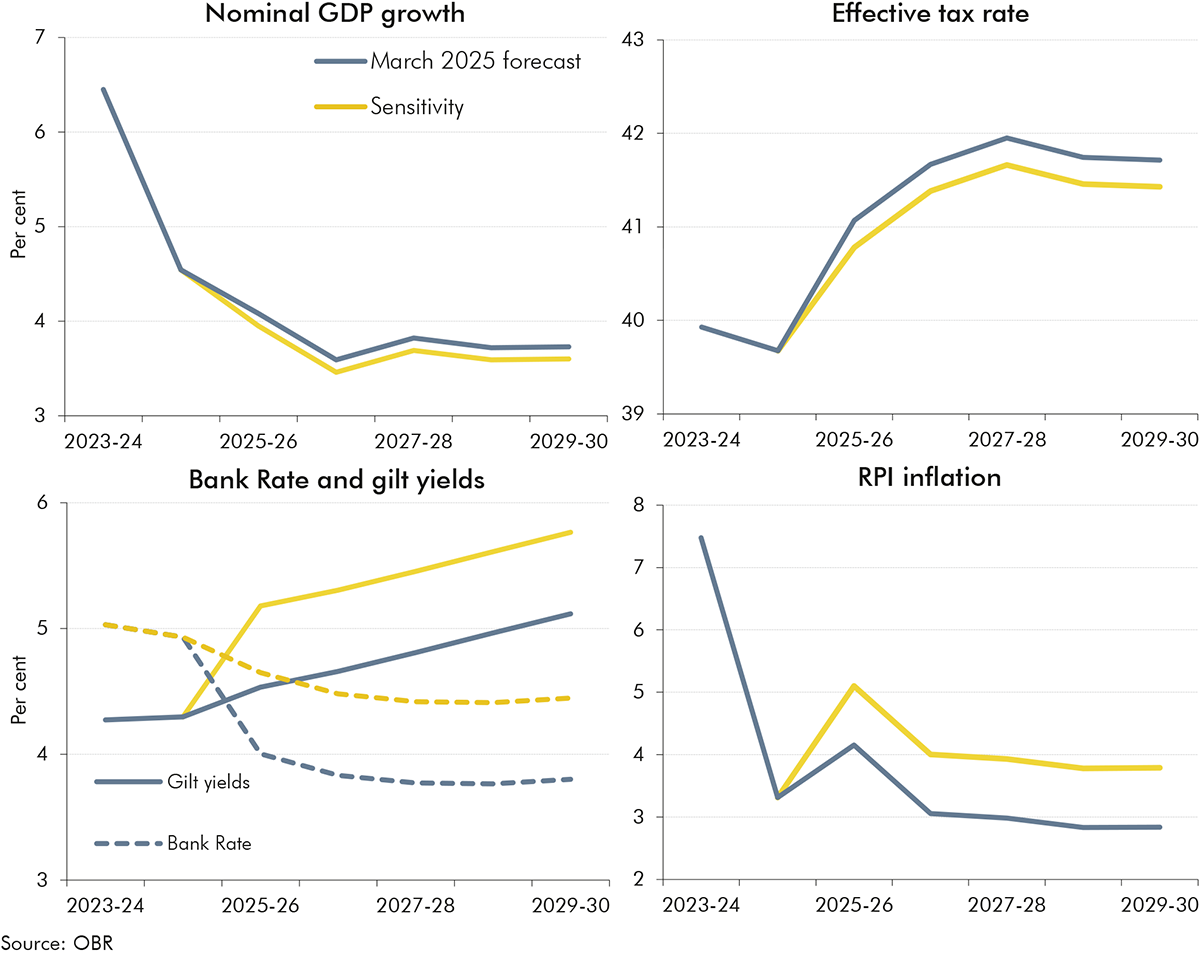
High and volatile market expectations for Bank Rate and gilt yields continue to shape the fiscal outlook. Higher debt interest costs just since October were enough to eliminate the current surplus in the pre-measures forecast. Were Bank Rate and yields on gilts issued across the forecast to both be 0.6 percentage points higher, less than the 1 percentage point volatility in 10-year gilt yields since early October, it would be enough to eliminate the headroom against the fiscal mandate.
Risks around the global outlook have intensified since October. This is particularly true for trade policy, and in Box 2.2 we explore the implications of three tariff scenarios. In the most severe of these scenarios, with a reciprocal 20 percentage point increase in tariffs between the US and the rest of the world, UK real GDP is 1 per cent lower than in our central forecast in the peak year of impact. This would almost entirely eliminate the headroom against the fiscal mandate, as additional tariff revenue is more than offset by lower receipts from income, corporation, and consumption taxes.
1.23Significant risks to the fiscal forecast over the medium term include:
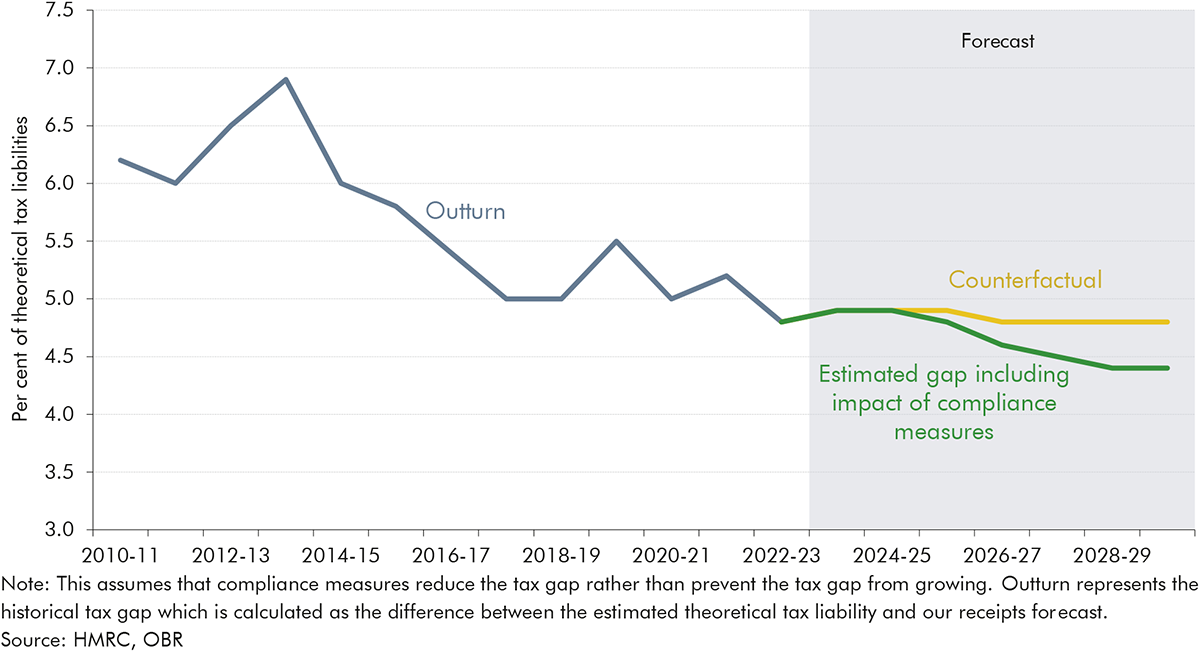
The tax-to-GDP ratio is forecast to increase to a post-war high of 37.7 per cent of GDP in 2027-28. Part of this increase is driven by the policies announced at the previous Budget, including the increases in employer NICs and capital taxes, with the estimated yield from several of these policies remaining highly uncertain. The forecast also assumes that seldom-implemented fuel duty indexation and the reversal of the 5p cut from 2026-27 raises £4.6 billion in 2029-30. There are also significant risks around key economic forecast assumptions which drive tax revenues, such as earnings and employment growth, and from the assumption that the implied tax gap, a measure of tax compliance, falls to a historic low due to recent compliance policy measures.
Departmental spending plans for the three years beyond 2025-26 will be set at the Spending Review this summer. The forecast for these years implies significant pressures on ‘unprotected’ departments, whose day-to-day budgets may need to be cut by 0.8 per cent a year in real terms from 2026-27 to accommodate assumed commitments in other areas. The Government has addressed a previously identified fiscal risk by raising defence spending from to 2.3 to 2.5 per cent of GDP by 2027-28, funded by a reduction in ODA from 0.5 to 0.3 per cent of GNI. But it also has ambitions to further increase defence spending to 3 per cent of GDP in the next Parliament, which would cost an additional £17.3 billion in 2029-30. Planned savings in ODA, particularly with respect to cuts in asylum spending, may drive spending pressures elsewhere.
The Pathways to Work Green Paper measures included in our forecast constitute the largest package of welfare savings since July 2015. The full impacts of these policies are very uncertain given the complexity of how trends in health, demography and the economy interact with the benefits system (as our 2024 Welfare trends report explored). Welfare reforms incorporated into previous OBR forecasts have in many cases saved much less than initially expected, such as the transition from disability living allowance to PIP, or taken far longer to implement than expected, as was the case for the roll-out of UC. And the July 2015 package of benefits freezes and reductions to tax credits and UC was subsequently reshaped or reversed over successive fiscal statements. We will undertake a full assessment of the potential impact of the Green Paper polices on the labour market ahead of our next forecast.
1.24The long-term fiscal outlook remains very challenging, with pressures from an ageing population, climate change, and rising geopolitical tensions putting the public finances on an increasingly unsustainable path. The baseline projection in our 2024 Fiscal risks and sustainability report would require fiscal tightening of 1.5 per cent of GDP per decade over the next 50 years to return debt to pre-pandemic levels. Leaving policy settings unchanged in the long term would see debt rise to over 270 per cent of GDP by the mid-2070s.
Chapter 2: Economic outlook
Introduction
2.1 This chapter describes our latest economy forecast, summarised in Table 2.1, including:
the conditioning assumptions, including interest rates, commodity and equity prices, the global economy, exchange rate, and fiscal policy (from paragraph 2.5);
the forecast for potential output and its components (from paragraph 2.14);
the output gap and real GDP (from paragraph 2.30);
inflation (from paragraph 2.36);
the labour market including employment, unemployment, and earnings (from paragraph 2.40);
the composition of economic activity, including households, businesses, government, and trade and the current account (from paragraph 2.46);
housing, including the impact of planning reforms (from paragraph 2.57);
nominal GDP (from paragraph 2.63); and
how our forecast compares to recent external forecasts (from paragraph 2.64).
Table 2.1: Key economy forecast assumptions and judgements
Key metric (per cent unless otherwise stated)
October 2024
March 2025
Change
Gilt yields
10-year gilt yields average from 2025 to 2029
4.4
4.8
↑
Bank Rate
Average from 2025 to 2029
3.7
3.9
↑
Gas prices
Average in 2025 (pence a therm)
97.3
128.8
↑
Inflation
Quarterly peak CPI inflation in 2025
2.7
3.7
↑
Real GDP
Growth in 2025
2.0
1.0
↓
Potential output
Cumulative growth from 2023 to 2029
10.2
9.7
↓
Labour supply
Cumulative growth from 2023 to 2029
3.9
4.3
↑
Trend productivity
Cumulative growth from 2023 to 2029
6.0
5.2
↓
Output gap
Output gap in 2025
0.1
-0.6
↓
Real GDP per person
Level in 2029 (Index, 2019=100)
105.4
105.4
–
Nominal earnings
Average annual growth from 2025 to 2029
2.5
2.7
↑
Nominal GDP
Level in 2029 (£ billion)
3,367
3,433
↑
Key: ↑ Higher, ↓ Lower, – Unchanged
Developments since the October forecast
2.2 Since finalising our October 2024 forecast, several key data releases have changed our view of the recent performance of the UK economy. This includes the Quarterly National Accounts released on 30 September consistent with Blue Book 2024, which contained revisions to GDP outturns between 2020 and the second quarter of 2024 (but was released too late to be included in our October forecast). Other releases include subsequent ONS population, labour force, and GDP estimates covering the remainder of 2024. The key changes in these releases were:
The size of the UK adult population has been revised up by ½ million (0.9 per cent) in 2024 following the reweighting of the ONS Labour Force Survey (LFS).[1] This reflects stronger population growth since mid-2022 driven by higher net migration than previously estimated. The size of the UK labour force was also revised up by around ½ million (1.5 per cent) in 2024. Average hours remained broadly in line with our October forecast for the year as a whole, despite significant volatility throughout the year. As a result, at the end of 2024, labour supply (measured as total hours worked) was 1.4 per cent higher than in the October forecast.
Real GDP growth from 2022 to mid-2024 was also revised up by the ONS, so that by the second quarter of 2024 the level of real GDP was 0.8 per cent higher than we thought in October.[2] But GDP growth slowed dramatically over the second half of 2024 to just 0.1 per cent combined across both quarters, 0.7 percentage points lower than expected in October. This means that the level of real GDP in the final quarter of 2024 was only 0.1 per cent higher than the October forecast.
A larger-than-expected labour force and a GDP level broadly in line with previous expectations mean that the level of productivity (measured output per hour worked) at the end of 2024 was 1.3 per cent lower than in the October forecast. In growth-rate terms, productivity fell 0.4 per cent in 2023 and a further 1.0 per cent in 2024.
Real GDP per capita at the end of 2024 was also 0.7 per cent below the October forecast and 1.1 per cent lower than its level at the end of 2019.
2.3 In addition to these developments in UK economic outturn data, the global economic outlook has also become more challenging and more volatile than in October. Market expectations for the future path of interest rates and energy prices have both increased. Bank Rate and 10-year gilt yields are 0.2 and 0.4 percentage points higher on average across the forecast period, respectively. Gas prices in 2025 are forecast to be around 30 per cent higher than in our October forecast. And following the election of a new US administration in November, US trade policies and those of its major trading partners remain in flux.
2.4 The higher starting point for the size of the workforce, weaker outturn data for productivity, the recent slowdown in GDP growth, and higher market expectations for energy prices and interest rates explain a large part of the changes in this forecast relative to October. But significant uncertainty continues to surround recent economic developments in the UK. This is partly due to issues with data measurement and volatility, demonstrated by the latest quarterly data showing a partial reversal of the earlier decline in productivity. And the global economic policy environment has been changing from day to day in the run-up to this forecast. Alongside the central forecast we therefore explore the economic and fiscal implications of alternative scenarios for UK productivity (Box 2.1 and Chapter 7), interest rates (Chapter 7), and global trade policy (Box 2.2 and Chapter 7).
Conditioning assumptions
Monetary policy, gilt yields, and equity prices
2.5 Based on market pricing, Bank Rate (taken over the 10 working days to 12 February) is expected to fall from its current level of 4.5 per cent to 3.8 per cent from mid-2026 onwards (Chart 2.1). The Bank of England cut Bank Rate by 0.25 percentage points in February, and market participants expect further cuts totalling 0.6 percentage points this year. However, the expected path of Bank Rate is both slightly higher and flatter than in October. It is 0.2 and 0.3 percentage points above the October forecast, respectively, in 2026 and 2029. Market participants’ expectations for Bank Rate have remained volatile since finalising our October pre-measures forecast. Expectations for 2029 have ranged by a full percentage point, from 3.1 to 4.1 per cent.
Chart 2.1: Bank Rate
2.6 Market pricing for 10-year gilt yields, taken over the same window, rise from 4.3 per cent at the end of 2024 to 5.2 per cent in 2029 (Chart 2.2, left panel). On average across the forecast, this is 0.4 percentage points higher our October forecast. Since early October, UK 10-year spot gilt yields have increased by around ½ percentage point. This increase was broadly in line with the increase in bond yields across many other advanced economies (Chart 2.2, right panel). 10-year gilt yields have also remained volatile, varying by a full percentage point between 3.9 and 4.9 per cent over the same period. We explore the sensitivity of the fiscal outlook to alternative paths for interest rates in Chapter 7.
Chart 2.2: 10-year bond yields
2.7 Equity prices, as measured by the FTSE All-shares index,increased by 6 per cent in 2024 and are 0.7 per cent higher than our October forecast on average across the forecast period. Equity prices are assumed to grow in line with nominal GDP. They are an important driver of both the capital taxes forecast and the value of equity assets within public sector net financial liabilities (PSNFL).
Commodity prices
2.8 Market-based expectations for gas and electricity prices, over the same window as described above, have risen significantly since the October forecast, particularly in the near term. Wholesale gas prices are expected to peak at an average of just under 130 pence a therm in 2025, which is around 30 per cent higher than forecast in October. Prices remain elevated in 2026 before falling to just under 90 pence a therm from mid-2027 onwards, though the average is still 15 per cent higher than our October forecast. Electricity prices are also higher than in October, up more than 20 per cent on average over 2025 and 2026 and over 5 per cent in the medium term. Oil prices are forecast to average 74 dollars a barrel in 2025, up 4 per cent from October, then gradually fall back to 71 dollars in 2029, down 1 per cent from October. The outlook for commodity prices is also uncertain. Gas price expectations for 2025 have ranged from a low of just under 90 to a high of around 135 pence a therm since the October forecast.
Chart 2.3: Gas and oil prices
World economy and the exchange rate
2.9 Our forecast for the world economy is based on the IMF’s 17 January World Economic Outlook Update (WEO). This did not incorporate recent developments in US and global trade policy but did include the, relatively modest, impact of a temporary increase in trade policy uncertainty in the run-up to January. We now expect global GDP growth of 3.3 per cent in 2025 and 2026, unchanged this year and up 0.1 percentage points next year relative to our October forecast. The slightly stronger global growth outlook is driven by stronger growth in the US, which is only partly offset by weaker growth in Europe and other advanced economies.
2.10 Even before taking account of tariffs announced since the start of the year, the January WEO expected global trade growth to slow from 3.4 per cent in 2024 to 3.3 per cent on average between 2025 and 2027. This is 0.1 percentage points lower than our October forecast as trade policy uncertainty temporarily weighs on growth. Cumulative growth in UK export markets between 2024 and 2029 is around 2 percentage points lower than anticipated in October, in line with weaker eurozone and US import growth. Given the considerable uncertainty over the global trade outlook, in Box 2.2 we explore alternative scenarios for the impact of different US and global trade policies on the UK economy.
2.11 The trade-weighted sterling effective exchange rate is 1 per cent lower across the forecast period than in our October projection.[3] Compared to our October outlook, the pound is around 5 per cent weaker against the dollar and ¾ per cent stronger against the euro over the forecast.
Fiscal policy
2.12 From a deficit of 1.9 per cent of GDP in 2024-25, the primary balance (public sector non-interest revenue minus non-interest expenditure) is projected to improve by 3.0 per cent of GDP over the forecast to a primary surplus of 1.0 per cent of GDP in 2029-30. This is primarily due to a rising tax take in 2025-26 and 2026-27, mainly due to frozen tax thresholds and the rise in employer National Insurance contributions (NICs). Public spending also falls slightly as a share of GDP over the forecast period. So, the boost to demand from past fiscal policy announcements wanes over the forecast, as the primary deficit becomes a surplus.[4] This consolidation stabilises debt, although at an elevated level, helping to ensure that borrowing costs and inflation are lower than they otherwise might be.
2.13 The path of overall borrowing is similar to that in our October forecast. This reflects a pre-measures deterioration due to a 0.1 per cent of GDP lower primary balance in 2029-30, and 0.2 per cent of GDP higher net interest payments. This is offset by the effect of government decisions, including tighter fiscal policy and the indirect effects of planning reform, which raise the primary balance by 0.2 per cent of GDP by our forecast horizon. We discuss the magnitude and composition of this fiscal tightening in Chapter 3, with the ‘indirect effects’ of government decisions on our economy forecast discussed in Box 3.1 in Chapter 3.
Potential output
2.14 In our central forecast, potential output growth falls from 1.5 per cent in 2024 to 1.2 per cent in 2025 and then picks up gradually to 1.8 per cent in 2029 (Chart 2.4). Most of the potential output growth in 2024 and 2025 comes from growth in the adult population. A slowdown in net migration from recent, exceptionally high, levels drags down growth in aggregate potential output in 2025. The rise in growth in later years is due mainly to a projected recovery in total factor productivity (TFP) growth, which more than offsets a further drop in the growth of the labour supply. We describe each component of potential output from paragraph 2.19 and the implications for output per person are discussed in paragraph 2.35.
Chart 2.4: Potential output growth
2.15 Compared to our October forecast, the level of potential output in 2029 (the final year of our forecast) is 0.3 per cent higher (Chart 2.5). This is the net result of a significant upward revision to trend total hours worked (1.5 per cent) and downward revision to the level of trend productivity (1.3 per cent). It is also the net result of upward revisions to historical data and downward revisions to a combination of recent data and our forecast.
2.16 The level of potential output in 2023 was 0.7 per cent higher than we assumed in the October forecast. This is based on upward revisions to historical data for real GDP and our judgement that spare capacity over this period is unchanged. This upward revision to the starting level of potential output was driven by a much higher level of labour supply (adding 1.2 percentage points), partially offset by a lower starting level of trend productivity (deducting 0.5 percentage points).
2.17Pre-measures potential output growth between 2023 and 2029 has been revised down by a cumulative 0.5 percentage points over the six years, or an annual average of 0.1 percentage points:
Potential output growth in 2024 and 2025 is a combined 0.5 percentage points lower. We think that part of the recent weakness in productivity growth is structural and will continue in the first half of 2025.
Before accounting for policy measures, potential output growth averages 1.6 per cent in the four years from 2026 to 2029, broadly in line with our October forecast. The decision to leave our assumption for medium-term potential output growth broadly unchanged reflects our current judgement that recent weakness in productivity growth reflects a combination of data volatility, measurement issues, and temporary factors (such as the drag from higher energy prices and lingering effects of Covid). These tell us little about how fast the economy’s supply capacity will grow in the medium term. While growth in productivity is little changed, the level is consistently lower over the forecast, as described in detail below.
2.18Policy measures incorporated in this forecast are estimated to raise potential output by 0.2 per cent in 2029, mainly driven by the effect of residential planning reforms (see Chapter 3 for more details).
Chart 2.5: Level of potential output: changes since October
Labour supply
2.19 Labour supply (measured by trend total hours worked) is projected to be 1.5 per cent higher than in October at the end of the forecast period.[5] This entirely reflects a higher starting point due to a larger population. Annual labour supply growth over the forecast period is unchanged from October. It falls from 1.2 per cent in 2024 to 0.5 per cent in 2029 as net migration falls, while participation and average hours worked slightly decrease due to an ageing population. Aside from a small negative impact on labour supply from reversing reforms to the work capability assessment (WCA) announced in 2023, we have not incorporated supply-side effects of policies in the Government’s Pathways to Work Green Paper in this forecast, due to insufficient information (see Box 3.2 in Chapter 3 for more details).
Adult population
2.20 The size of the adult population in the ONS LFS has been revised up by 0.5 million (0.9 per cent) to 55.7 million in 2024, mainly driven by higher historical net migration. There have been further revisions to migration which are not yet incorporated in the LFS data. Net migration is now estimated to have peaked at 906,000 in the year to mid-2023, 166,000 higher than the previous estimate. There are also some upward revisions to the years to mid-2021 and mid-2022, averaging 30,000 a year.[6] We use the ‘migration category variant’ of the latest ONS population projections in this forecast.[7]
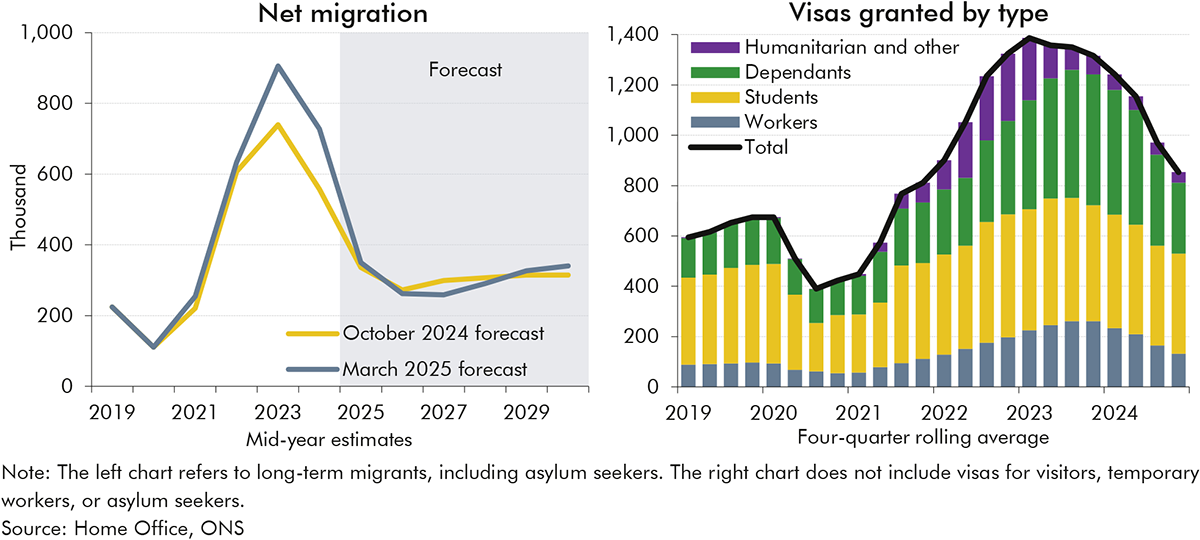
2.21 In this variant, net migration falls sharply from 728,000 in the year to mid-2024 to a trough of 258,000 in the year to mid-2027, before reaching 340,000 at the forecast horizon (Chart 2.6, left panel). This sharp fall in net migration over the forecast is consistent with the tightening of visa policies, mainly regarding dependants of students and care workers, and higher levels of emigration following recent high levels of immigration (especially among students). The effect of tighter visa policies is already evident in the latest visa data which show a sharp reduction across most visa types up to December 2024 (Chart 2.6, right panel). The medium-term level of net migration is slightly higher than in our October forecast (by 25,000). This is in line with evidence suggesting a higher share of immigrants are staying in the UK under the new migration system.
Chart 2.6: Net migration forecast and visas granted
2.22 Based on these latest ONS population projections, we now assume the adult population grows by 2.1 million people over the next five years to reach 57.8 million in 2029. Annual adult population growth averages 0.8 per cent over the forecast period, in line with the October forecast. In 2029, the adult population is ½ million higher than in the October forecast, almost entirely reflecting the higher starting level. Despite the LFS now using a more up-to-date population base, it is still not capturing the latest upward revisions to migration data. This means that there are likely to be some further upward revisions to the adult population in the next LFS reweighting, expected in 2026.
Trend labour force participation
2.23 The trend labour force participation rate is forecast to fall slightly from 63.0 per cent in 2024 to 62.8 per cent in 2029. Across the forecast period, this is 0.3 percentage points higher on average than the October forecast, largely reflecting a higher starting point and a broadly unchanged forecast profile.[8] This forecast incorporates a set of age-specific participation rates using the new ONS population projections. The decline in the participation rate over the next five years is driven primarily by the steady ageing of the population as the share of over-60s rises from 25 per cent in 2022 to 27 per cent in 2029. There is also a contribution from inactivity due to long-term sickness, consistent with the forecast for a further rise in incapacity benefits caseloads (see Chapter 5 for more details).
2.24 This decline is partly offset by three other factors. First, the increase in the state pension age from 66 to 67 in 2028 which boosts participation among this group (see Box 6.1). Second, a further decline in inactivity due to caring for young children as a consequence of falling birth rates and policy measures to increase childcare provision. Third, a boost from new migrants, as this group are more likely to be of working age than the domestic population, which more than compensates for their slightly lower participation rate for a given age.
Average hours worked
2.25 Trend average hours worked fall slightly over the forecast, from 32.0 hours in 2025 to 31.8 hours in 2029. This reflects the drag from the ageing population as older people work shorter hours on average. The LFS measure of average hours worked has been very volatile over the past year, which may be related to ongoing issues with the survey, making it difficult to identify trends in hourly productivity. While there is a lot of uncertainty around the estimates, on balance, we judge that the starting position of trend average hours is marginally higher than our October forecast. The cumulative fall in average hours worked over the forecast (and negative contribution to potential output growth) is similar to the October forecast, at around ½ per cent.
Trend productivity
2.26 Both the level and growth rate of measured productivity have been lower than we expected in October. That is because, between 2021 and the second quarter of 2024, the ONS revised up the total population and total hours worked by more than they revised up GDP, mechanically lowering the level of productivity. And in the second half of 2024, GDP growth was weaker than expected, while total hours worked were higher than forecast in October. As a result, measured output per hour fell by 0.4 per cent in 2023 and by 1.0 per cent in 2024, ending the year 1.3 per cent lower in level terms than in our October forecast.
2.27 We judge the weaker-than-expected productivity growth in 2023 and 2024 partly reflects cyclical factors. Survey indicators and inflation data suggest some spare capacity has opened up within firms, though not enough to fully explain the weakness in measured output per hour. We therefore estimate that trend (or underlying) productivity continued to grow in 2023 and 2024, but weakly and at a slower pace than assumed in the October forecast. However, as much of the downward revision to measured productivity growth was due to the ONS more accurately reflecting recent population growth, we think some of the recent weakness is structural. Therefore, the estimated level of trend productivity is lower than in our October forecast by 0.5 per cent in 2023 and by 0.9 per cent in 2024.
2.28 In our central forecast, we expect that the level of trend productivity will remain permanently below our October forecast, but growth will return to a similar medium-term rate (Chart 2.7). Trend productivity growth in 2025 is expected to be 0.3 per cent, compared to 0.8 per cent in October, largely reflecting base effects from the weakness in the second half of 2024. Trend productivity growth from 2026 onwards is little changed from the October forecast. It returns to 1¼ per cent by 2029, broadly the average of the higher growth in the decade before and lower growth in the decade after the global financial crisis. The level of trend productivity is therefore 1.3 per cent below our previous forecast in 2029. This forecast is comprised of:
Capital deepening (proxied by the change in the capital stock per hour worked), which contributes 0.2 percentage points to average annual trend productivity growth from 2025 to 2029, broadly unchanged from October. This reflects the fact that forecast growth in investment and hours worked has not changed significantly since October.
Total factor productivity (the economy’s efficiency at combining capital and labour to produce output), which contributes 0.8 percentage points to average annual productivity growth over the forecast. This is 0.1 percentage point less than in October, mostly reflecting lower growth in 2025 due to base effects from the weakness in the second half of 2024. TFP growth reaches around 1.0 per cent in 2029.
2.29 We expect that the impact of policies incorporated in this forecast will increase the level of trend productivity by 0.2 per cent in 2029. This increase is driven by the residential planning reforms, which we expect to increase construction sector productivity and housing services due to the higher housing stock.
Chart 2.7: Annual trend productivity level and growth
Box 2.1: Alternative scenarios for trend productivity
The outlook for trend productivity is one of the most important and uncertain forecast judgements. Successive past forecasts for trend productivity have proven to be too optimistic as productivity growth has continued to disappoint. So, over the past 10 years, we have lowered our medium-term productivity growth assumption from around 2.2 per cent to 1¼ per cent. Given the measurement and volatility issues with recent outturn data, alongside the wider economic risks that could impact future productivity (such as those surrounding global trade), the uncertainty around our productivity assumption remains high.
To illustrate this uncertainty, the following scenarios show how different judgements about the outlook for trend productivity would affect the economic and fiscal forecast (Chart A):
In an upside scenario, trend productivity growth averages 1.2 per cent a year from 2025 to 2029, 0.3 percentage points higher than in the central forecast. Under this scenario, the level of productivity in 2029 is unchanged from the October forecast and 1.3 per cent higher than in our current central forecast. This would be consistent with the view that the news since October only reflects temporary factors, such as cyclical weakness or measurement issues. Therefore, the level and growth rate of medium-term trend productivity are both unchanged after a period of higher catch-up growth.
In a downside scenario, trend productivity growth remains at 0.3 per cent a year throughout the forecast. Under this scenario, the level of productivity in 2029 is 3.2 per cent lower than the central forecast. This is consistent with the weakness in trend productivity growth in 2024 continuing over the whole forecast period. The level and the growth rate of trend productivity would both be lower in the medium term.
We discuss the fiscal implications of these scenarios in Chapter 7.
Chart A: Trend productivity scenarios
The output gap and real GDP
Output gap
2.30 The latest indicators suggest that there is currently a small amount of spare capacity (excess supply) in the economy, and slightly more than we forecast in October. Our estimate of the output gap (real GDP relative to our estimate of potential output) in the fourth quarter of 2024 is -0.5 per cent. This is 0.2 percentage points lower (more spare capacity) than in October. The negative output gap reflects subdued economic growth in recent quarters, capacity utilisation indicators falling slightly below their normal levels, and a loosening labour market. Given we cannot directly observe the output gap, there is always significant uncertainty around these estimates.
2.31 We expect that the output gap will trough in 2025 at -0.6 per cent before narrowing and closing by early 2027 as output returns to our estimate of potential (Chart 2.8). Over 2025 and 2026 we now expect excess supply, rather than excess demand as in October, with the output gap 0.6 percentage points lower on average over this period. This reflects the lower starting point, higher market expectations for interest rates, lower business and consumer confidence, and increased uncertainty, including around global trade policy. Government policy measures announced since October are expected to lift the output gap by around 0.1 percentage points through the middle of the forecast period, primarily reflecting the impact of planning reforms (see Chapter 3).
Chart 2.8: Output gap
Real GDP
2.32 Real GDP grew by 0.9 per cent in 2024, 0.2 percentage points lower than anticipated in October. We now expect similar growth of 1.0 per cent in 2025, half the 2.0 per cent growth assumed in our October forecast (Chart 2.9, right panel). Around one-third of this difference in 2025 reflects the lower growth in potential output due to structural weakness in productivity, as discussed above. The remaining two-thirds reflects cyclical weakness due to higher interest rate and energy price expectations, rises in uncertainty, and a fall in confidence. The latter is shown by measures of consumer and business confidence having generally trended lower in recent months. The S&P Global/CIPS UK composite PMI also points to only a modest expansion in activity in the first couple of months of 2025 as it remains below the historical average.
2.33 Our central forecast has GDP growth accelerating to 1.9 per cent in 2026 then averaging 1.8 per cent a year over the rest of the forecast, broadly in line with our potential output forecast. The projected acceleration in 2026 reflects monetary policy loosening, falls in energy prices, and a gradual easing of uncertainty resulting in spare capacity in the economy being used up. While the forecast for GDP growth is much weaker in the near term, in line with recent data developments, our forecast for medium-term GDP growth is slightly higher than in October. This is due to the more negative starting output gap providing more scope for above-trend GDP growth and the impact of planning reforms. From 2023 to 2029, cumulative real GDP growth is around ½ percentage point lower than the October forecast.
Chart 2.9: Real GDP growth
2.34 The risks around our forecast for real GDP growth are substantial, with considerable uncertainty regarding both the domestic and international outlook. As always, productivity growth is one of the most important and uncertain forecast judgements, and Chapter 7 sets out the fiscal implications of the alternative productivity scenarios described in Box 2.1. Since October, market expectations for interest rates have been volatile across advanced economies, underscoring the continued uncertainty around the monetary and fiscal policy outlook. Developments in global trade policies represent another significant forecast risk. We explore the effect of potential changes in global trade policy on real GDP in Box 2.2. Purely based on historical forecast errors, there is roughly a three-in-ten chance that real GDP will fall in 2025, and roughly a similar chance that growth will exceed 2 per cent this year (Chart 2.9, left panel).
GDP per person
2.35 After falling by 0.9 per cent in 2023 and by another 0.1 per cent in 2024, real GDP per person is expected to grow by 0.3 per cent in 2025. Growth then rises to an average of 1.4 per cent a year over the rest of the forecast, driven by the recovery in productivity growth. Real GDP per person recovers to its early 2022 pre-energy crisis level by the start of 2026 (Chart 2.10). This is around a year later than we forecast in October, reflecting weaker near-term productivity growth. By the end of the forecast, we expect real GDP per person to be broadly in line with our forecast from October.[9]
Chart 2.10: Real GDP per person
Inflation
2.36 CPI inflation is forecast to rise from 2.5 per cent in 2024 to 3.2 per cent in 2025, but then fall rapidly to around the 2.0 per cent target from mid-2026 onwards. Monthly CPI inflation is expected to peak at around 3.8 per cent in July 2025. This is driven by increases in the Ofgem price cap due to higher energy prices, higher food prices due to an increase in domestic costs, and the increase in regulated water bills from April 2025. From 2026 onwards, CPI inflation is forecast to fall rapidly as increases in household energy bills fall out of the annual comparison and more spare capacity in the economy opens up.
2.37 Compared to October, CPI inflation is forecast to be 0.6 percentage points higher in 2025, then marginally lower from 2026 to 2028. This would leave the CPI price level 0.2 per cent higher at the end of the forecast period in 2029. Chart 2.11 illustrates that, based on historical forecast errors, there is roughly a one-in-five chance of CPI inflation being below 2.6 per cent or above 4.0 per cent in 2025.
Chart 2.11: CPI inflation
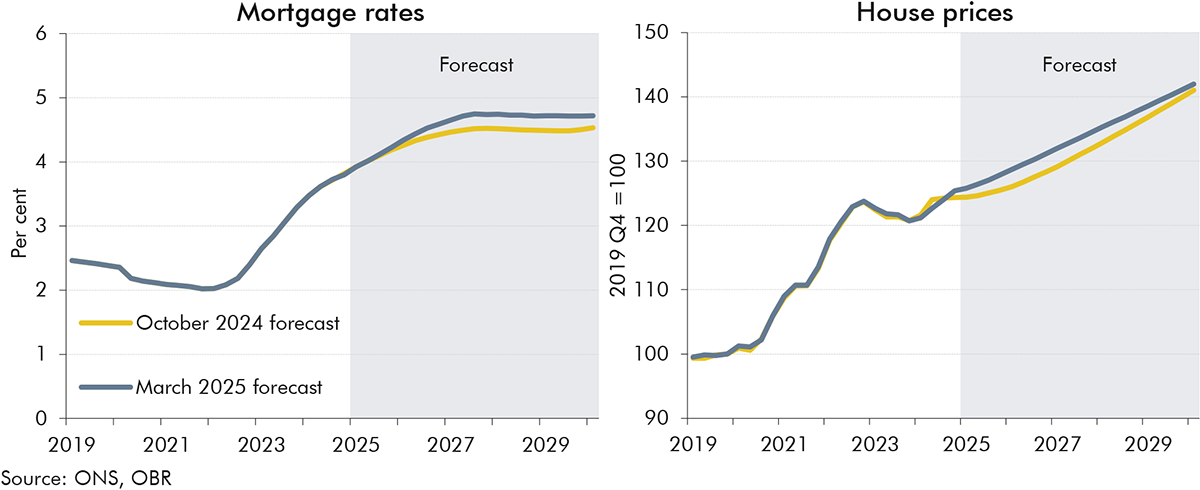
2.38 RPI inflation is forecast to average 4.1 per cent in 2025, before falling rapidly to 3.2 per cent in 2026 and to 2.9 per cent on average thereafter. Our forecast for RPI inflation in 2025 has been revised up 0.6 percentage points relative to the October forecast, in line with the upward revision to CPI. However, in 2026 and 2027 we forecast a slightly larger gap between RPI and CPI inflation than in October, because of stronger growth in house prices and mortgage interest payments which affect RPI but not CPI.
2.39 The GDP deflator – which measures the price of all domestically produced goods and services – is forecast to grow largely in line with CPI inflation throughout the forecast. We expect the GDP deflator to grow by 3.2 per cent in 2025, before slowing down to 1.7 per cent in 2026. The latter is slightly lower than our forecast for CPI inflation of 2.1 per cent as higher energy prices temporarily lower the UK terms of trade, given the UK is a net importer of energy. From 2027 onwards, GDP deflator growth averages around 2 per cent a year, in line with CPI inflation. Compared to our October forecast, cumulative growth in the GDP deflator between 2024-25 and 2029-30 is forecast to be marginally lower as there is more spare capacity in the domestic economy in the first two years of our forecast.
Labour market
2.40 Recent data suggest that the labour market continues to loosen, with vacancies falling and the unemployment rate rising, although wage growth remains strong. The loosening likely reflects weak economic growth and subdued business confidence weighing down on labour demand. The increase in employer NICs is also likely to be contributing to falling recruitment and rising redundancies. In this forecast, we have not incorporated any impact of the Government’s Plan to Make Work Pay as there is not yet sufficient detail or clarity about the final policy parameters. Aside from WCA reforms, we were also unable to incorporate supply-side effects of the policies in the Government’s Pathways to Work Green Paper due to, as yet, insufficient information on their effects (see Box 3.2 in Chapter 3). We plan to include the effects of both in our next forecast.
2.41 Issues with the LFS remain, which currently make labour market forecasts particularly uncertain. Following the recent reweighting, the LFS now uses a more up-to-date population base (see paragraph 2.20). But it is still not capturing the latest upward revisions in migration outturn data, which are expected to further increase the LFS population base in the next reweighting. Additionally, sampling issues and resulting biases remain in the LFS, which mean that participation and employment rates are likely to still be underestimated.
Employment and unemployment
2.42 The employment rate is forecast to decline slightly from 60.5 in the second half of 2024 to 60.2 per cent in 2029 as population ageing weighs on participation (Chart 2.12, left panel). The starting point is 0.6 percentage points higher than previously forecast and up from 60.2 in the first half of 2024. This is likely in part due to issues with the LFS as other employment measures, such as the RTI and workforce jobs, suggest employment growth slowed in 2024. Population growth means that cumulative employment growth over the forecast is around 1.2 million, broadly the same as in October. However, due to historical LFS revisions, the level of employment is estimated to be around ½ million higher in the outturn than in October, and this gap is retained throughout the forecast.
2.43 We expect the unemployment rate to peak at 4.5 per cent (1.6 million people) in 2025 as spare capacity opens up, before falling to its estimated structural rate of 4.1 per cent in 2028 (Chart 2.12, right panel). The unemployment rate has been trending up since the post-pandemic trough of 3.8 per cent in 2022, albeit with some volatility likely due to issues with the LFS. The general trend is in line with wider indicators of a cooling labour market as labour demand weakens. Compared to the October forecast, the unemployment rate is 0.4 percentage points (around 160,000 people) higher in 2025, in line with a more negative output gap, while our estimated structural rate is unchanged.
Chart 2.12: Employment and unemployment rates
Average earnings
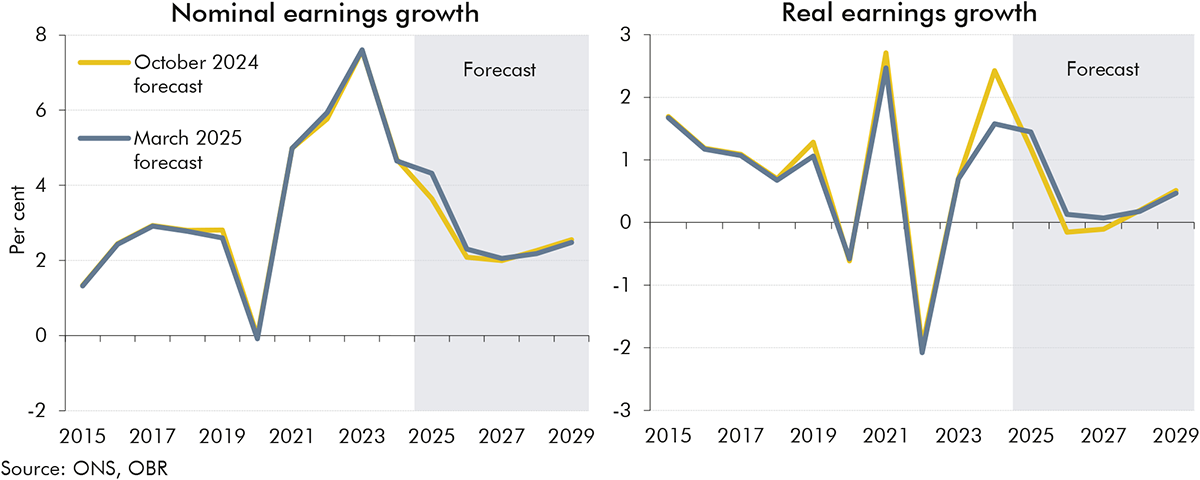
2.44 We forecast nominal earnings growth to ease from 4.7 per cent in 2024 to 4.3 per cent in 2025 (Chart 2.13, left panel). Nominal earnings growth remained strong in the second half of 2024 and annual growth was 5.5 per cent in the fourth quarter.[10] The recent strength has been driven by a combination of the timing of backdated public sector pay settlements and resilient private sector growth. The near-term outlook remains relatively strong, with the forecast for the last quarter of 2025 broadly in line with surveys of pay settlement growth expectations of around 3 to 4 per cent. Across 2025, average nominal wage growth is 0.7 percentage points higher than the October forecast. However, the ongoing loosening in labour market conditions, the recent hit to business sentiment, compressed company margins, and the rise in employer NICs should eventually weigh on the outlook for wage growth. From 2026 onwards, nominal earnings growth slows further, averaging between 2 and 2½ per cent.
2.45 In our central forecast, real earnings grow by 1.4 per cent in 2025 before stagnating in 2026 and 2027 (Chart 2.13, right panel). Real wage growth is below productivity growth in the middle years of the forecast as firms rebuild profit margins, which have recently been compressed. We expect firms to have more scope to pass on higher costs from increased employer NICs to workers as the labour market continues to loosen. Real wage growth then begins recovering towards productivity growth in the medium term. Compared to our October forecast, real earnings growth is 0.3 percentage points higher in 2025, as wage settlement expectations have held up relative to weak productivity growth and falling inflation. Growth is broadly unchanged from October over the rest of the forecast.
Chart 2.13: Nominal and real earnings growth
Composition of economic activity
2.46 Over the last few years, a series of significant shocks has contributed to falls in labour market participation, weak productivity growth, and high consumer price inflation, with much of the latter imported from abroad. However, real household disposable incomes have held up surprisingly well. This was initially a result of substantial government support and, more recently, due to a higher share of income going to labour as company profit margins have been squeezed. Eventually, we assume that these shocks will be passed onto households and recent experience suggests this will occur through real wage adjustment rather than through higher unemployment. Therefore, over the forecast, we expect firms to rebuild profit margins and the labour share of income to fall back slightly.
Households
Household disposable income
2.47 We expect real household disposable income (RHDI) per person to grow at an average of around ½ per cent a year in the five years from 2025-26 to 2029-30 (Chart 2.14, left panel).[11] But growth is projected to vary significantly around this average, first slowing sharply from 2½ per cent in 2024-25 to almost no growth in 2027-28. This is driven by four factors: (i) lower real wage growth as firms rebuild profit margins; (ii) non-labour income growth returning to medium-term trends; (iii) an increase in household taxes as firms pass employer NICs onto wages and income tax thresholds remain frozen; and (iv) slower benefits growth due to a rising state pension age and welfare measures announced since October. After the sharp slowdown, RHDI per person growth picks up to average ⅔ per cent a year in 2028-29 and 2029-30 as the freeze on income tax thresholds ends and real wage growth increases. Compared to the October profile, stronger real wage growth means RHDI per person grows slightly more quickly across the forecast. Aggregate RHDI growth averages 1 per cent a year across the forecast, while population growth averages just under ½ per cent a year.
2.48 Policy measures lower RHDI per person slightly – around ¼ per cent by 2029-30. The main driver is lower benefit income due to the Government’s welfare reforms. Planning reforms boost incomes, offsetting some of the hit, as higher productivity raises wages and a larger housing stock means more compensation for housing services. Yet three quarters of the extra income from housing services comes as ‘imputed rent’ – what homeowners would receive if they rented out their home. This makes the boost less tangible for households.
Chart 2.14: Real household disposable income per person
Household saving
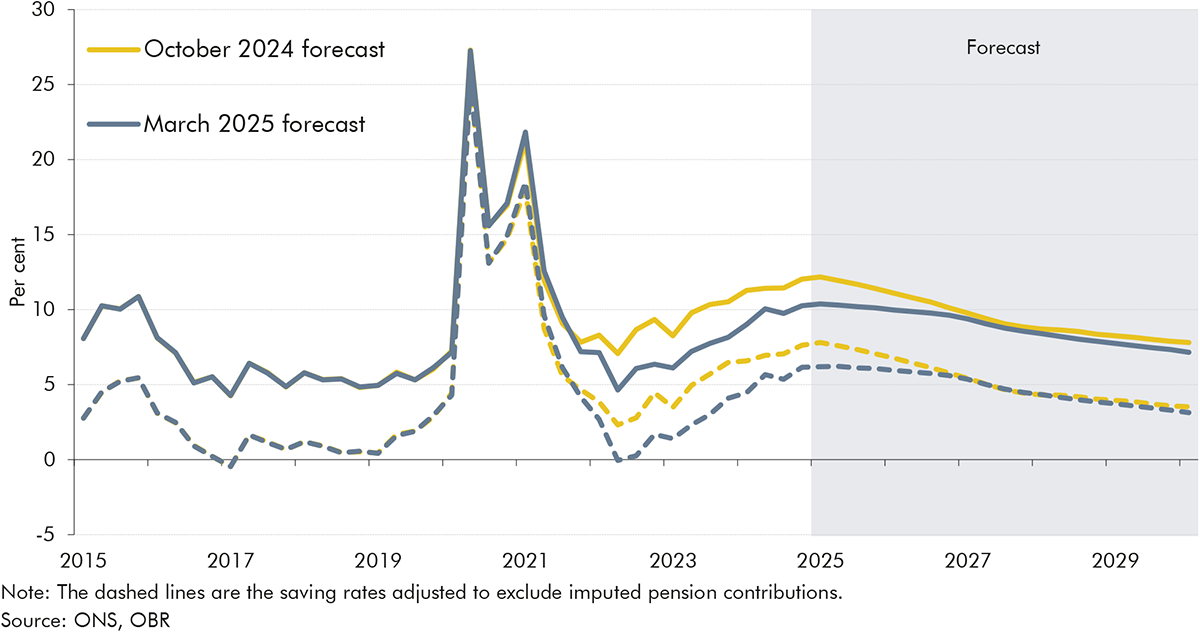
2.49 The household saving rate (adjusted to exclude imputed pension contributions) rose from 2¾ per cent in 2023 to an estimated 6¼ per cent at the end of 2024. We expect the saving rate to hold around this level in 2025 before falling steadily over the rest of the forecast, going below 3¼ per cent by the start of 2030 (Chart 2.15). Household saving has risen in recent years as resilient real wages and rising net interest income have supported RHDI, while higher interest rates and greater uncertainty have incentivised saving. We expect these factors to unwind over the forecast, prompting households to lower their saving rate back towards historical averages. This allows households to maintain a steady share of consumption in GDP, despite a falling labour share in income. Policy measures boost the saving rate slightly, as households look to fund higher residential investment driven by the planning reforms. But the difference is less than ¼ percentage point by the start of 2030. Compared to our October forecast, downward revisions to outturn mean we expect a lower saving rate across most of the forecast.
Chart 2.15: Saving rate
Household consumption
2.50 Real private consumption is expected to grow by 1.5 per cent a year on average over the forecast. This is broadly in line with the October forecast as higher growth in household income is offset by slightly shallower fall in the household saving rate. Consumption growth was weak in 2024 and near-term indicators, including consumer sentiment surveys and intelligence from the Bank of England’s Agents network, suggests consumer demand remains subdued. However, we expect consumption growth to increase from 1.2 per cent in 2025 to 1.8 per cent in the final year of the forecast, supported by the falling saving rate. Policy measures are expected to weigh slightly on consumer spending in the latter half of the forecast as a reduction in welfare benefits lowers household incomes, and the saving rate is slightly higher to help fund the increase in residential investment. There are risks in both directions around our consumption forecast, reflecting uncertainty around future real wages and household saving.
Profits and business investment
2.51 Profits as a share of GDP are forecast to fall to 14.3 per cent in 2025, a level last seen in 2010 after the global financial crisis, before recovering to 15.4 per cent in 2029 (Chart 2.16, left panel). The profit share dropped from 16.2 per cent in 2019 to 15.1 per cent in 2024 as margins were eroded by firms granting workers above-productivity increases in real wages. The net rate of return on business sector capital has also been on a steady downward trend, from 12 per cent in 2015 to 9 per cent in the first half of 2024. We expect the profit share of GDP to fall further in 2025 as wage settlement expectations have continued to outpace productivity growth and inflation and as the employer NICs rise initially hits profits. The profit share then gradually increases over the rest of the forecast as we assume firms rebuild their margins and pass on more of the costs from the employer NICs rise to higher consumer prices and lower nominal wages.
2.52 Real business investment is expected to grow by an annual average of 1.3 per cent over the forecast period. Downward revisions to the level of business investment over the past three years left it only 0.6 per cent above its pre-pandemic level in the fourth quarter of 2024, compared to 3.9 per cent higher in our October forecast. Recent falls in business sentiment mean we think investment growth will remain weak in the near term. This relatively subdued recovery in business investment from the pandemic is consistent with the drop in the rate of return on capital and rises in interest rates. As profitability and the rate of return recover and interest rates fall, we expect business investment growth to pick up from 2026 and return to around the same level as our October forecast by 2027 (Chart 2.16, right panel).
Chart 2.16: Profits and business investment
Government
2.53 As a share of real GDP, real government consumption and investment is expected to rise from 24.2 per cent in 2024 to 24.7 per cent in 2029, broadly in line with our October forecast. Real government consumption, the largest part of government expenditure, is expected to grow by 2.0 per cent a year on average over the forecast, broadly unchanged since October. Real government investment is expected to grow by 1.4 per cent on average over the forecast, an increase of 0.7 percentage points on our pre-measures and October forecast. Stronger growth in 2025 relative to October, largely reflects historical ONS revisions to outturn which we think are mostly noise and provide no signal about the medium-term level. From 2026 onwards, the difference reflects a change in the composition of departmental spending (DEL). This is driven by increased defence spending which is relatively capital intensive and a reduction in Official Development Assistance which is less capital intensive (see Chapter 5 for details).
Trade and the current account
2.54 The forecast assumes continued weak growth in trade volumes over the coming years. Exports fell 2.2 per cent in 2024, but we expect the level of exports to recover in 2025 and growth to average 0.8 per cent a year over 2026 to 2029. Imports rose 1.6 per cent in 2024, but we expect the level to stabilise in 2025 and growth to average 1.0 per cent over 2026 to 2029. Weak growth in imports and exports over the medium term partly reflect the continuing impact of Brexit, which we expect to reduce the overall trade intensity of the UK economy by 15 per cent in the long term.[12] Our central forecast does not explicitly account for the impact of recently announced tariff increases by the US and other countries. In Box 2.2, we explore alternative scenarios assessing how different US and global trade policies could impact the UK economy.
Box 2.2: Alternative trade policy scenarios
The new US administration has announced new tariffs on a range of imports from its trading partners, prompting responses from some countries affected. Both US and other countries’ trade policies have been subject to frequent changes over recent weeks and the future direction for trade policy is highly uncertain. Our central forecast for global output aligns with the IMF’s January World Economic Outlook Update so does not take account of the new tariffs announced by the US and other countries since January. In this box, we outline three illustrative scenarios to show the potential impact of higher US and global tariffs on UK output and inflation, highlighting the primary transmission channels and their probable effects. The fiscal impacts of these scenarios are presented in Chapter 7.
The UK’s trading relationship with the US and rest of the world
The UK economy is relatively trade-intensive compared with other economies in the G20. UK trade (imports plus exports) as a share of GDP is around 64 per cent, above the G20 average of 55 per cent and far higher than the US at 25 per cent.a
While the US is the UK’s second-largest trading partner (after the EU), the composition of our trade with the US is skewed toward services rather than goods. The US accounted for 15 per cent of the UK’s goods exports and 10 per cent of its goods imports in 2023. In the services sector, the US has a larger role, representing 27 per cent of the UK’s exports and 19 per cent of its imports. The EU as a whole remains by far the UK’s largest trading partner, contributing about 50 per cent of the UK’s trade, roughly two-thirds of which is trade in goods. China, the UK’s third-largest trading partner, accounts for less than 10 per cent of UK trade and is heavily skewed towards goods imports.
The UK’s trade in goods with the US is broadly in balance.b The major broad categories of goods which the UK exports to the US include machinery, transport equipment, and chemicals. Meanwhile UK imports from the US are mainly machinery, transport equipment, and fuel.
Chart B: Composition of UK trade in 2023
Mechanisms through which tariffs could affect the economy
Economic theory and empirical evidence suggest that higher tariffs reduce the trade intensity of output and so reduce productivity and real GDP over the long run.c Lower overall trade intensity tends to reduce productivity as, among other channels, it restricts a country’s ability to exploit its comparative advantage and the economies of scale that come from accessing overseas markets.
For a country imposing tariffs, there are a number of channels through which this can affect their economy, including:
Tariffs increase the cost of importing goods from overseas, which generally lowers the quantity of goods imported. There could be offsetting effects by importing from countries on which tariffs are not applied (trade diversion) and changes in the exchange rate.
The increases in import costs are generally passed onto households and result in a temporary increase in consumer price inflation, though the effect on the level of consumer prices will be permanent if the tariffs are permanent. This will lower real household incomes and consumption. But the effect on inflation is very uncertain, as movements in exchange rates and trade diversion could apply downward pressure.
Uncertainty around future trade policy can cause firms to delay or even cancel investment or hiring plans, which can push output temporarily below its potential level and have longer-lasting effects. Temporarily pushing output below its potential level will put downward pressure on consumer price inflation.
Slower growth in the economies of key trading partners subject to tariffs could have indirect effects on demand for a country’s exports, and therefore on GDP and inflation.
The impact on the UK, and relative importance of these channels, depends on the constellation of tariff policies in place.
Scenarios for the UK economy under different tariff regimes
To explore the potential impact of rising US and global tariffs on the UK economy, we construct three stylised scenarios for trade policy in the US, UK, and rest of the world.d These estimates are drawn from a range of models, empirical estimates, and trade scenarios from other institutions. For all scenarios, we assume that tariff rates rise at the start of the financial year 2025-26 (1 April 2025) and remain permanently elevated. As tariffs provide a one-time shock to the price level, any inflation is likely to be short lived, and we assume that the Bank of England looks through the initial increase in inflation. In addition to the direct impact of higher tariffs, there is an increase in trade policy uncertainty which further dampens economic activity in the first few years of the scenarios.e
In the first scenario, the US increases tariffs levied on goods arriving from China, Canada and Mexico by 20 percentage points, and these countries retaliate equivalently. GDP growth in these countries slows while prices rise. This leads to UK GDP being around 0.2 per cent lower than in our central forecast in 2026-27 as demand for UK exports slows and uncertainty weighs on UK economic activity. However, after the initial disruption, this is broadly offset by trade diversion, where demand for UK goods rises as they are relatively cheaper. Overall, UK GDP is largely unchanged from our central forecast by 2029-30.
In addition to the above, in the second scenario, the US goes further by increasing tariffs on goods arriving from all other countries, including the UK, by 20 percentage points. In this case:
Initially, higher US tariffs would increase the cost of imported goods to US consumers relative to US-produced goods. This is likely to decrease demand for UK exports and dampen UK economic activity. Using a price elasticity of -0.4 implies that for a 20 percentage point increase in prices of US goods imports (assuming the tariff rise is fully passed through to consumer prices), demand for goods exports to the US would fall by 8 per cent, all else equal.f In the UK, where goods exports to the US make up 2 per cent of GDP, this is equivalent to a little under 0.2 per cent of GDP. Higher US import tariffs would also reduce US demand for foreign currency which could cause a moderate depreciation in sterling, mitigating some of this effect. Overall, UK GDP in this scenario is 0.6 per cent lower than in our central forecast in 2026-27, the peak year of impact as lower demand for UK exports from the US, weaker global GDP growth, and heightened uncertainty dragging on investment weigh on UK GDP.
In the medium term, reduced trade openness leads to a permanently lower GDP level by around 0.3 per cent. This is only partly offset by the opportunity for trade diversion (for customers in the UK to find alternative sources for goods and for firms to seek markets where tariffs are not significant) and the fading impact of uncertainty.
We assume that UK inflation peaks at 0.3 percentage points higher than our central forecast in 2025-26. But it is below our central forecast in 2027-28 and 2028-29 as weaker UK GDP growth means spare capacity opens up. It then returns to the 2 per cent target.
The third scenario assumes that, in addition to the above, all US trading partners, including the UK, retaliate against the US by imposing their own equivalent tariffs on US goods. In this case:
UK inflation rises by 0.6 percentage points above our central forecast in 2025-26 as the price of UK imports of US goods increases. Goods make up around half of the CPI basket with roughly 3 per cent of these imported from the US. Therefore (all other things equal) the 20 per cent increase in US goods import prices could add around 0.3 percentage points to CPI, if it is fully passed through to consumer prices. However, the size and direction of overall the inflation impact is very uncertain, for example due to the impact of movements in the exchange rate and trade diversion.
We assume tariffs on imports from the US lowers imports (and therefore trade intensity), while the impact of higher inflation on real incomes and slowdown in global growth is likely to mean GDP quickly falls below our central forecast. Alternatives to US goods may be more expensive which could lower living standards further. The peak impact on GDP is around 1 per cent in 2026-27. As GDP growth weakens, there are limited second-round effects on inflation, which then falls to 1.8 per cent in 2027-28.
Even higher global barriers to trade and reduced global productivity in this scenario mean medium-term UK GDP is around ¾ per cent lower than in our central forecast.
Chart C: Three trade policy scenarios for UK GDP
Sources of uncertainty around these effects
The effects of these channels are highly uncertain in both magnitude and even direction. The impact of tariffs crucially depends on the ability of importers and consumers to substitute away from goods whose prices increase due to tariffs. For example, in a scenario where the UK imposes tariffs on US imports, the impact on UK output and inflation would be smaller if domestic or non-US substitutes were more readily available.
There will also be frictions as new trading regimes are implemented. In the short term, sudden increases in trade barriers could disrupt supply chains, causing shortages and price volatility, but predicting these effects is challenging due to the complexity of global value chains. Uncertainty about future changes in trade policies may delay investment, hiring decisions, and output, potentially reducing not just activity in the near term but potential output in the medium term.
Our scenarios incorporate estimates consistent with the static effects of increased trade barriers on the medium-term productivity level. But in the long term, dynamic effects on productivity (longer-lasting effects on growth rates) are likely to further weigh on UK and global output. Reduced openness to trade would hinder access to the new technologies and knowledge sharing that support innovation. However, the size of these effects remains uncertain.
Comparison with other estimates
Various external bodies have also estimated the potential impact of higher tariffs on UK GDP under differing tariff regimes, time horizons, and modelling assumptions. Our 2022 Fiscal risks and sustainability report also included estimates of a more severe ‘trade war’ scenario involving reciprocal tariffs levied by all countries on each other. Chart D shows that our estimates for the GDP impact of the three scenarios described above are quite close to the average of other estimates for that level of tariffs.
Chart D: External estimates of the effects of higher tariffs on UK GDP
a) Greene, M., Not such an island after all, Bank of England, February 2025.
b) According to the ONS, the UK is a net exporter to the US. However, variations in trade data due to differing methodologies, especially in classification and pricing methods, make the precise trade balance uncertain. See for example: DBT, HMRC and United States Census Bureau, Asymmetry analysis for trade in goods statistics between the UK and the USA, 2017 to 2022, March 2024.
c) See OBR, Discussion paper No. 3: Brexit and the OBR’s forecasts, October 2018, for more information on the theoretical and empirical links between trade intensity and economic growth.
d) These are scenarios and do not reflect stated government policy.
e) Caldara, D., et al., Does Trade Policy Uncertainty Affect Global Economic Activity?, FEDS Notes. Washington: Board of Governors of the Federal Reserve System, September 2019.
f) This is in line with empirical evidence for the elasticity of demand for UK exports in the long run. See Kamath, K., and V. Paul, Understanding recent developments in UK external trade, Bank of England, 2011
2.55 We expect the current account deficit to widen from 2¾ per cent of GDP in 2024 to an average of around 3¼ per cent from 2025 onwards. While the trade deficit slightly improves, going from 1 per cent of GDP in 2024 to ¾ per cent by 2029, investment income pulls the current account further into deficit. As global short-term interest rates fall further below UK rates, the investment income deficit widens from 1¼ per cent of GDP in 2024 to nearly 2 per cent by the start of 2030.
Sectoral net lending
2.56 Strong earnings growth and precautionary saving together mean we forecast the household sector to remain in a surplus of around 3½ per cent of GDP in 2025 (Chart 2.17). This surplus then falls back towards historical averages, reaching ¾ per cent in 2029. A persistent current account deficit means we forecast the overseas sector to lend an average of 3¼ per cent of GDP across the forecast. The corporate sector deficit widens further over the next two years in our forecast, reaching 3 per cent of GDP in 2026 as the squeeze on profit margins continues. This deficit then narrows steadily to 1½ per cent of GDP by 2029 as firms rebuild margins and pass on tax increases to wages and prices. We expect the public deficit to narrow gradually across the forecast, from around 5½ per cent of GDP in 2024 to 2¼ per cent in 2029.
Chart 2.17: Sectoral net lending
The housing market
2.57 In this forecast we have incorporated the effects of the revised National Planning Policy Framework (NPFF) announced in December 2024. Most of the difference from our October housing market forecast is driven by these measures, which we expect to have a material, additional, and durable impact on housebuilding, property transactions, and potential output, and a modest impact on house prices. In this section we present our central forecast for housing supply, which is a combination of a little-changed pre-measures forecast and the impact of the residential planning reforms. We present a more detailed analysis of the demand and supply impact of these reforms in Chapter 3.
Housing supply
2.58 Cumulative net additions to the UK housing stock are forecast to be 1.3 million from 2025-26 to 2029-30, reaching 305,000 a year by 2029-30 (Chart 2.18). Relative to our October forecast, total net additions across the five-year forecast period are 137,000 higher. This difference reflects the combination of a small downward revision in our pre-measures forecast and a large positive impact from the planning reforms:
In our pre-measures forecast, net additions fall from 265,000 in 2023-24 to 192,000 in 2025-26, the lowest point since 2013-14. This is driven by the lagged impact of the recent fall in private housing starts. This fall was a result of higher interest rates and the higher cost of building homes due to building regulatory standards introduced in June 2022 and applied to housing starts after June 2023. We expect a recovery in the rest of the pre-measures forecast, with net additions reaching 238,000 in 2029-30, as housebuilders adjust to the new regulations and interest rates fall. Compared to October, the pre-measures forecast averages 7,000 a year lower over the five years.
We judge that the planning reforms incorporated in the revised NPPF will increase net additions by 170,000 across the forecast period. This is equivalent to a 0.5 per cent increase in the housing stock in 2029-30. This increased housebuilding over the forecast period is driven mainly by requirements for local authorities to release land to meet development needs as well as the strengthened presumption in favour of sustainable development which, if triggered, requires local authorities to release land for further development unless the adverse impacts of doing so significantly outweigh the benefits. Most of this increase takes place from 2027-28 as it takes time for developers to identify sites, local authorities to bring forward local plans, capacity constraints in the sector to be overcome, and additional houses to be built. If sustained, the effects of planning reforms on net additions to the housing stock would build further beyond 2029-30, as explained in Chapter 3.
Chart 2.18: Net additions and private housing completions
Transactions
2.59 Property transactions are forecast to rise from around 290,000 a quarter at the end of 2024 to around 370,000 a quarter by 2029. On average, this is 9,000 higher each quarter than our October forecast largely due to the planning reforms. In the pre-measures forecast, transactions are volatile due to movements in sales around the stamp duty rises at the end of March 2025. Thereafter, we assume that the turnover of the housing stock returns towards historical average rates. We expect that the planning reforms will increase housing transactions, on average by 4.0 per cent in the last three years of the forecast as additional completed homes are transacted. This means we now assume that around 1.2 per cent of the total housing stock gets transacted every quarter in the medium term.
Residential investment
2.60 Residential investment growth is expected to pick up materially over the forecast, rising from -1.9 per cent in 2025 to a peak of 8.8 per cent in 2027. The increase reflects the expected monetary policy loosening over this period and reforms to the planning system announced by the Government. These reforms are expected to increase the level of residential investment by 10 per cent at the end of the forecast. This captures the net impact of a rise in investment in new buildings and higher resulting transfer costs, partly offset by lower investment in improvements. These effects are discussed in more detail in Chapter 3.
Mortgage rates
2.61 Average interest rates on the stock of mortgages are expected to rise from around 3.7 per cent in 2024 to a peak of 4.7 per cent in 2028, then stay around that level until the end of the forecast. The high proportion of fixed-rate mortgages (around 85 per cent) means increases in Bank Rate feed through slowly to the stock of mortgages. The Bank of England estimates around one-third of those on fixed rate mortgages have not refixed since rates started to rise in mid-2021, so the full impact of higher interest rates has not yet been passed on.[13] Compared to our October forecast, mortgage rates are around 0.2 percentage points higher on average over the forecast, driven by higher interest rate expectations (Chart 2.19, left panel).
House prices
2.62 The average house price in the UK is expected to rise over the forecast from around £265,000 in the final quarter of 2024, to around £295,000 in 2029. House prices rose at an annual rate of 3.9 per cent in the final quarter of 2024, 0.9 percentage points higher than in our October forecast. We expect this momentum to ease over the year as higher interest rates continue to weigh on demand. House price growth is 2.8 per cent in 2025 and averages 2.5 per cent thereafter, broadly in line with growth in nominal earnings. We expect the 0.5 per cent increase in the housing stock as a result of the planning reforms will reduce the average house price by around 0.8 per cent in 2029.
Chart 2.19: Mortgage rates and house prices
Nominal GDP and its composition
2.63 In our central forecast, average annual nominal GDP growth in the fiscal years 2025-26 to 2029-30, an important driver of our fiscal forecast, is broadly unchanged from our October forecast. In level terms, ONS revisions mean nominal GDP in both 2024-25 and 2029-30 is 2 per cent higher than our October forecast. In terms of the composition, compared to our October forecast:
On the income side (Chart 2.20, left panel), growth in labour incomes – which has the highest effective tax rate of all the nominal tax bases – has been revised up. This is due to wage settlement expectations continuing to hold up relative to weak productivity growth and falling inflation. But higher earnings growth is expected to squeeze corporate profits further, particularly in the near term.
On the expenditure side (Chart 2.20, right panel), nominal consumption growth – a key driver of the VAT forecast – has been revised down in almost every year of the forecast. Other revisions to our forecast are in expenditure components concentrated in areas that are not directly taxed.
Chart 2.20: Change in cumulative nominal GDP growth since October
Comparison with external forecasters
2.64 Our central forecast for cumulative real GDP growth from 2024 to 2029 is 0.8 percentage points higher than the average of other forecasters (Chart 2.21). This likely reflects differences including underlying productivity growth assumptions, assumptions around US trade policy, and the effects of policy measures included in this Spring Statement – most notably the impact of the planning reforms. The Bank of England’s forecast for average annual real GDP growth over the next three years is 0.3 percentage points lower than our central forecast. This likely reflects the Bank’s weaker productivity growth assumption and a more persistent negative output gap.
Chart 2.21: Comparison of forecasts for cumulative growth in real GDP
2.65 Our forecast for average annual CPI inflation over the next three years is lower than the Bank’s forecast by 0.3 percentage points, reflecting factors such as lower expected wage growth. Compared to the average of other forecasters, our CPI inflation forecast is 0.1 percentage points higher this year and 0.3 percentage points lower next year. This likely reflects different energy price and wage growth assumptions. Our unemployment projection for this year is broadly similar to the Bank’s forecast and slightly lower than the average of other forecasters. However, this difference increases in future years, likely reflecting different assumptions about the level of slack in the economy over the forecast period.
Table 2.2: Comparison of forecasts for GDP, inflation, and the unemployment rate
Per cent
2024
2025
2026
2027
GDP growth
OBR
0.9
1.0
1.9
1.8
Bank of England
0.8
0.7
1.5
1.5
External average
1.0
1.3
CPI inflation
OBR
2.5
3.2
2.1
2.0
Bank of England
2.5
3.4
2.7
2.2
External average(1)
3.1
2.4
Unemployment rate
OBR
4.3
4.5
4.3
4.2
Bank of England
4.3
4.5
4.6
4.8
External average(2)
4.7
4.7
1) CPI inflation in the fourth quarter.
2) Unemployment rate in the fourth quarter.
Source: Bank of England, HM Treasury, ONS, OBR
Chapter 3: Policy measures
Introduction
3.1 This chapter:
sets out the total effect of Government policy measures included in the Spring Statement and in the period since the Autumn Budget in October 2024, on public sector net borrowing, the public sector balance sheet, and the economy;
describes the costings of the most fiscally significant of these measures including how they have been incorporated into our forecasts and the uncertainties around them;
provides analysis on the long-run impacts of government policy decisions;
provides an update on selected previously scored measures; and
discusses policy risks, which include measures that are yet to impact our central forecast.
3.2 In the run-up to any fiscal event, the Government provides us with draft estimates of the fiscal cost or gain of each policy measure it is considering, which then undergo an iterative scrutiny process. After this process is complete, the Government chooses which measures to announce and which costings to include in its policy decisions table. For these costings we choose whether to certify them as ‘reasonable and central’, and whether to include them – or alternative costings of our own – in our forecast. We have certified all but two measures in this forecast. Relatively small changes were made to the policy parameters of the universal credit standard allowance increase and the reduction in the generosity of the universal credit health element measures following the costings certification deadline. As a result, we were not able to certify the final version of these costings, but have used the Government’s estimates in this forecast and will finalise the certification process for our next forecast. We do not expect this will have a material impact on the costings we have used.
Total effect of Government decisions
The impact of fiscal policy decisions on borrowing
3.3 This forecast incorporates the economic and fiscal implications of fiscal policy measures that have been announced since the Autumn 2024 Budget. Overall, the direct effect of these measures delivers a reduction in spending and increase in tax revenues over the medium term which together reduce borrowing by £6.3 billion (0.2 per cent of GDP) in 2029-30. Because some of the changes to departmental expenditure reduce current spending but increase capital spending in the final year of the forecast, the direct effect of policy measures on the current balance is greater at £10.9 billion (0.3 per cent of GDP in 2029-30).
3.4 The largest components are changes to public spending, which lower borrowing by £4.0 billion in 2029-30:
This decrease in spending is more than explained by a package of welfare measures which reduces spending by £4.8 billion in 2029-30. Within this, changes to incapacity and disability benefits reduce spending by £6.4 billion by 2029-30. This is partly offset by an increase to the generosity of universal credit for all claimants, which raises spending by £1.9 billion in 2029-30.
Changes to departmental spendingincrease total spending by £2.2 billion per year on average and by £0.7 billion in 2029-30. The main components are a frontloaded increase in day-to-day departmental spending (RDEL) over the next two years, including the creation of a ‘transformation fund’ that peaks at £1.8 billion in 2026-27. There is then a reduction in the overall RDEL envelope by £3.6 billion in 2029-30, despite an additional £1.4 billion in commitments to a new DWP employment support programme and tax and welfare compliance activities. Capital departmental spending (CDEL) is higher after 2025-26 due to an increase in defence spending and an unspecified increase to the overall CDEL envelope which by 2029-30 reach £6.4 billion and £1.6 billion, respectively. Net of reductions to Official Development Assistance (ODA) capital spending, this leaves overall CDEL spending £4.4 billion higher by 2029-30.
3.5Tax decisions raise an average of £1.6 billion a year over the forecast period, and £2.2 billion in 2029-30:
Measures which are fiscally neutral for borrowing because they are offset by an equal increase in spending raise £0.7 billion in revenue a year on average. These include an increase in visa and passport fees and additional flexibility for local authorities on council tax rates in 2025-26.
Measures to increase compliance and reduce tax debt raise £0.7 billion a year on average and £1.0 billion in 2029-30.
3.6 In addition to the direct fiscal effects of measures, Table 3.1 also includes their indirect effects on the public finances via the wider impacts they have on the economy. As well as the spending and tax measures set out above, this forecast includes estimates of the indirect effects of the Government’s residential planning reforms. As set out in Box 3.1, overall policy changes are judged to deliver a small boost to demand in the near term, while the planning reforms are estimated to increase potential output by 0.2 per cent in the medium term. These effects drive an increase in tax receipts and reduction in debt interest costs, which reduce borrowing by £3.4 billion by 2029-30.
Table 3.1: Total effect of Government decisions since October
£ billion
Forecast
2024-25
2025-26
2026-27
2027-28
2028-29
2029-30
Total effect of Government decisions
1.2
-0.5
-1.1
-2.3
-6.1
-9.7
of which:
Direct effect of spending measures
0.9
2.0
2.3
2.2
-0.8
-4.0
Direct effect of tax measures
-0.1
-1.0
-1.4
-1.6
-1.9
-2.2
Indirect effects of Government decisions
0.4
-1.6
-2.0
-2.9
-3.4
-3.4
Direct effect of Government decisions(1)
0.8
1.0
0.9
0.6
-2.6
-6.3
of which:
Spending measures(2)
0.9
2.0
2.3
2.2
-0.8
-4.0
of which:
Welfare changes
0.0
-0.1
-0.1
-1.8
-3.6
-4.8
of which:
Disability benefit changes
0.0
0.0
-0.2
-1.8
-3.5
-4.7
Incapacity benefit changes
0.0
0.0
-0.6
-0.9
-1.3
-1.7
Changes to UC standard allowance
0.0
0.0
0.8
1.1
1.5
1.9
DWP fraud and error measures
0.0
-0.1
-0.2
-0.2
-0.2
-0.2
Changes to departmental spending
-0.4
0.9
2.5
4.0
2.7
0.7
of which:
RDEL spending changes
-0.9
0.9
1.7
0.6
-1.2
-3.6
CDEL spending changes
0.4
0.0
0.8
3.4
3.9
4.4
Fiscally neutral spending changes(3)
0.0
0.2
0.2
0.2
0.2
0.3
Other spending measures
1.3
1.0
-0.3
-0.2
-0.1
-0.2
Tax measures
-0.1
-1.0
-1.4
-1.6
-1.9
-2.2
of which:
HMRC tax debt and compliance
-0.1
-0.3
-0.6
-0.7
-0.8
-1.0
Fiscally neutral tax changes(3)
0.0
-0.6
-0.6
-0.6
-0.6
-0.7
Other tax measures
0.0
-0.1
-0.2
-0.3
-0.4
-0.6
Indirect effects of Government decisions
0.4
-1.6
-2.0
-2.9
-3.4
-3.4
of which:
Receipts
-0.1
-1.0
-1.7
-2.7
-3.5
-3.5
Debt interest
0.0
0.0
0.1
-0.1
-0.3
-0.7
Welfare
0.0
0.0
0.0
0.1
0.1
0.2
Other spending changes
0.5
-0.5
-0.4
-0.2
0.2
0.5
Memo: total effect of Government decisions on current budget deficit
1.0
-0.4
-1.8
-5.7
-9.9
-14.0
Note: A positive sign implies an increase in borrowing. Our online detailed scorecard contains a measure-by-measure breakdown of every line, alongside our subjective assessment of each costing’s uncertainty.
1) The 2025-26 direct effect of policy includes £10 million in mechanical changes to our departmental expenditure forecast which are not included on the Treasury’s presentational scorecard. We detail these in our supplementary scorecard.
2) The effect of spending measures in this table includes the consequences of decisions on the block grant adjustment.
3) The effect of fiscally neutral spending measures is smaller than that of fiscally neutral tax measures, as some effects are included in the RDEL changes line above.
Source: HM Treasury, OBR
3.7 The measures in the policy package and their indirect effects offset all of the deterioration in the current budget in the pre-measures forecast by 2029-30, and around three-quarters of the deterioration in borrowing. Chart 3.1 shows that policy responses to forecast changes since 2010 have generally been asymmetric: when forecasts have improved, governments have almost always spent at least some of the windfall, but forecast deteriorations have been met by a mix of tightenings, loosenings, and broadly neutral policy responses. On only five of 15 occasions since June 2010 have fiscal policy tightenings been sufficient to offset all the additional borrowing from a final-year forecast deterioration.[14]
Chart 3.1: Policy responses to net borrowing revisions in final year of the forecast
3.8 The profile of the fiscal tightening at this event is backloaded, with material reductions in borrowing only in the final years of the forecast. Chart 3.2 compares the policy package at this event, including the indirect effects, against other contractionary policy events since June 2010. This shows that the impact of policy follows a relatively typical profile, with the reduction in borrowing increasing over the forecast, and is relatively modest in scale. Several factors are likely to influence the profile of fiscal tightenings, including the macroeconomic context, the timing of individual tax and spend changes, and the nature of fiscal rules which often bind in the later years of the forecast.
Chart 3.2: Impact of policy measures on borrowing over the five-year forecast
Box 3.1: Economic effects of policy changes
Our economy forecast accounts for the economic impacts of announced government policies. The demand-side effects of fiscal policy are calculated using a set of fiscal ‘multipliers’ which are drawn from empirical literature and reviewed periodically.a These capture the impacts of measures on demand, through changes to private incomes and consumption. We typically assume these effects taper to zero as the Bank of England uses monetary policy to bring the economy back to the trend path of potential supply. The impact of policies on the supply side of the economy is also accounted for if credible evidence suggested that measures will have a significant, additional, and durable impact on potential output.
As set out in Table 3.1, the direct effects of the fiscal policies incorporated in this forecast increase borrowing very slightly in 2025-26 before reducing borrowing from 2028-29 onwards. As a result of the reallocation of spending from mainly overseas Official Development Assistance (ODA) to mainly domestic spending on defence, the small near-term demand-side boost to the economy is larger than might otherwise be expected, increasing real GDP by a peak of 0.06 per cent in 2026-27 (Chart A, purple bars).b
As described from paragraph 3.36 of this chapter, we have also incorporated an estimate of the impact of the Government’s residential planning reforms on both supply and demand. We estimate these reforms will increase housebuilding, which leads to a modest temporary boost to demand by raising near-term residential investment (blue bars). In the medium term, these reforms provide a permanent boost to the supply capacity of the economy, via increases in construction sector productivity and the flow of housing services, which reaches 0.2 per cent of GDP in 2029-30 (green and yellow bars).
In this forecast, we have only made one adjustment to the forecast on the supply side of the economy in relation to the welfare reform package announced in the March Pathways to Work Green Paper.c This is the reversal of work capability assessment (WCA) reforms announced by the previous Government in Autumn 2023. As we had previously adjusted the forecast to account for the original policy, we are now reducing labour supply by 8,000 in average-hours-equivalent terms to remove its effect. This reduces potential output by 0.01 per cent in 2029-30 (Chart A, orange bars). We have not incorporated the labour supply effects of any other new welfare and employment support measures in our forecast, due to insufficient information on both the specification of policies and their effects in time for us to do so. As discussed in Box 3.2, we will fully assess the employment implications of the wider welfare reform package ahead of our next forecast.
Chart A: Real GDP impact of Government decisions
We also expect the policies in this forecast to provide a very small boost to CPI inflation, increasing the price level by less than 0.1 per cent by the end of the forecast.
a) See Box 2.2 in our December 2019 Forecast evaluation report and Box 2.1 in our November 2020 Economic and fiscal outlook.
b) This is because, as set out in paragraph 3.28, we assume that the reallocation of funding from ODA to defence spending means that a greater share of public spending will be spent in the UK than would otherwise be the case.
c) DWP, Pathways to Work: Reforming Benefits and Support to Get Britain Working Green Paper, March 2025.
Policy measures included in this forecast
3.9 In this section, we assess the most significant new policies announced since the Autumn 2024 Budget and their fiscal implications. We focus on measures with the largest direct or indirect fiscal impacts, those with complex interactions with other policies, or those that are particularly uncertain.
Welfare measures
3.10 In the Pathways to Work Green Paper, published on 18 March, the Government announced plans for a wide range of welfare reforms including to: the standard allowance in universal credit (UC), the main means-tested benefit paid to people both in and out of work; the UC health element (UCHE), the main incapacity benefit which tops up the incomes of those on UC with health conditions that limit their ability to work; and personal independence payment (PIP), the extra costs disability benefit for people of working age.[15]
3.11 Overall, our provisional estimate is that the direct impact of the welfare measures included in this forecast reduce AME spending by £4.8 billion by 2029-30.[16] This includes a £4.5 billion reduction in welfare spending due to changes to benefit entitlement and generosity and a £0.2 billion reduction due to fraud and error measures.[17] This is the largest package of welfare savings since the July 2015 Budget, which included a four-year freeze to most working-age benefits and a package of reductions to tax credits and UC. It puts overall welfare spending on a slightly downward trajectory as a share of GDP over the medium term, rather than the flat path in the October forecast (see Chapter 5).
3.12 The economic and fiscal impacts of these policies are very uncertain due to the complex interaction between trends in health, demography, and the economy and the operation of the benefits system (as our 2024 Welfare trends report explored). In addition, in a number of areas we currently have limited evidence available to assess the full impact of policy changes. Welfare reforms incorporated into previous OBR forecasts have, in many cases, saved much less than initially expected, such as the transition from disability living allowance to PIP, as explored in our January 2019 Welfare trends report. Others have taken far longer to implement than expected, as was the case for the roll-out of universal credit. And others have been reshaped or reversed at subsequent fiscal events, as was the case for the July 2015 package.
3.13 We will update these costings at our next forecast alongside assessing the impact of other reforms in the Green Paper, which we have not incorporated in this forecast because of a lack of firm details or due to ongoing consultations (see Box 3.2). Some of these wider reforms, for example the proposed abolition of work capability assessments (WCA), will also likely affect the cost of measures included in this forecast. Box 3.2 also explains why at this event we have not yet made a full assessment of the potential implications of all the welfare measures on labour supply.
Universal credit standard allowance
3.14 The Government has increased the universal credit standard allowance rates. This decision increases rates by 2.3 per cent in 2026-27, rising to 4.8 per cent in 2029-30, relative to a baseline assumption of annual CPI uprating. Over 6.5 million families projected to be in receipt of UC in 2026-27 will be entitled to the standard allowance.[18] By 2029-30, this change increases the average UC award including all UC elements from £244 to £249 per week, relative to the baseline uprating assumption, at a provisionally estimated total cost of £1.9 billion.
3.15 The static cost of this measure, which reaches £1.8 billion by 2029-30, reflects the cost of higher UC awards being made to the projected baseline stock of UC recipients in the forecast.[19] The costing also includes a behavioural assumption that around 8,000 eligible non-recipient families newly take up UC due to the slightly greater financial incentive to do so, which slightly increases the cost of the measure by almost £50 million in 2029-30.
Incapacity benefits
3.16 The Government has announced a series of changes to the universal credit health element, which 2.7 million families are projected to receive as part of their UC award in April 2026 when these policies take effect. Most claimants are currently required to undertake a work capability assessment which assesses how their reported health condition restricts their capability to work, with claimants who are classified as having ‘limited capability for work and work-related activity’ (LCWRA) eligible to receive the UCHE. Overall, the policy changes to the value of the UCHE and to the WCA are estimated to reduce spending by £1.7 billion in 2029-30. The policies included in this Spring Statement, and described in more detail below, are the:
reduction in the generosity of the UC health element;
removal of the WCA descriptors change (reversing 2023 reforms); and
reintroduction of DWP-led reassessments.
Reduction in the generosity of the UC health element
3.17 The value of the UCHE has been frozen at £97 per week for the four years from April 2026, rather than CPI uprating assumed in the baseline (which would have taken it to £107 per week by 2029-30), for those who joined the LCWRA caseload prior to that date. For people newly classified as LCWRA from April 2026 onwards, the UCHE is halved and then frozen for four years at £50 per week.
3.18 These changes are estimated to reduce spending by £3.0 billion in 2029-30, reflecting a £1,100 average reduction in overall annual UC awards for the 3.0 million individuals expected to be in receipt of the UCHE by that date.[20] The additional premium, mentioned in the Green Paper, to protect the incomes of UCHE recipients after April 2026 with the most severe, lifelong conditions, has not been costed in this forecast. This is because DWP has confirmed to us that key components of the policy, including the value of the premium and the groups of people impacted, are still being considered (see Box 3.2).
3.19 This is a provisional costing which is highly sensitive to judgements on the composition of the baseline LCWRA caseload and on the behavioural impacts of the measures. The static costing assumes that, by 2029-30, four-fifths of the pre-April 2026 caseload remains in receipt of the UCHE. With the overall LCWRA caseload expected to rise gradually over the forecast, by 2029-30 this means that 73 per cent of the LCWRA caseload is estimated to be pre-April 2026 caseload, and the remaining 27 per cent is estimated to be new claimants receiving the lower UCHE rate. The savings in 2029-30 are nearly six times as large for individuals in the latter group (because they receive the halved UCHE award) as the former, demonstrating the sensitivity of these ‘stock’ vs ‘flow’ shares for the estimated savings.
3.20 There are several potential behavioural responses to this policy, all of which are uncertain. We provisionally estimate that behavioural responses reduce the static saving by £0.4 billion through four channels:
Fewer UC claimants after April 2026 will undertake a WCA and flow into the LCWRA caseload in response to the reduced financial incentive, which is estimated to reduce the caseload by around 40,000 in 2029-30 and increase savings by £0.1 billion.
Fewer claimants in the pre-April 2026 stock are assumed to leave the caseload because they would lose the higher award and only be eligible for the lower UCHE award for new claimants if they were to claim the UCHE again in future. This increases the caseload by around 30,000 in 2029-30 and reduces the savings by £0.1 billion.
Some claimants will also claim PIP in response to the reduced income support provided by the lower UCHE for new claimants. This is estimated to increase the PIP caseload by 50,000 by 2029-30 and reduce savings by £0.3 billion.
The equivalent of one month’s worth of claims are estimated to be brought forward into 2025-26 to access the higher UCHE rate before the reduced award takes effect, which increases the caseload on the higher UCHE rate by around 30,000 in 2029-30 and reduces the savings from the measure by £0.1 billion.
Removal of the WCA descriptors change (reversing 2023 reforms)
3.21 The Government has announced that the three changes to the WCA descriptors, which the previous Government announced in November 2023, will not go ahead.[21] We have therefore removed from the forecast the previously estimated savings from this measure which reached £1.6 billion by 2029-30. We have also reduced labour supply by 8,000 in average-hours-equivalent terms to remove the effect of the original policy from the forecast.
Reintroduction of DWP-led reassessments
3.22 The Government will reintroduce reassessments for claimants placed in the LCWRA group prior to April 2026 with certain short-term prognoses (such as high-risk pregnancies or cancer treatment) or who, without LCWRA, faced substantial risk to their physical or mental health. The savings from this policy are estimated to reach £0.3 billion in 2029-30, due to reassessments leading to more claimants leaving the LCWRA caseload. The key uncertainties in this costing are the level of off-flows following reassessment and whether there is sufficient workforce capacity for the reassessments to take place.
Table 3.2: Costing of changes to incapacity benefits
£ billion
Forecast
2025-26
2026-27
2027-28
2028-29
2029-30
Reduction in generosity of UCHE
0.0
-0.7
-1.5
-2.3
-3.0
of which:
Static costing
0.0
-0.9
-1.8
-2.6
-3.4
Direct behavioural response
0.0
0.2
0.3
0.3
0.4
Reversal of 2023 WCA reforms
0.0
0.2
0.7
1.2
1.6
of which:
Static costing
0.0
0.3
1.1
1.9
2.7
Direct behavioural response
0.0
-0.1
-0.3
-0.7
-1.1
WCA reassessments for claimants with short-term prognoses
0.0
0.0
-0.1
-0.2
-0.3
Total changes to incapacity benefits
0.0
-0.5
-0.8
-1.2
-1.5
Note: The figures in this table differ from those in Table 3.1 because they do not include the consequences of decisions for the block grant adjustment, and are on a Great Britain basis.
Source: OBR
Disability benefits
3.23 The Government has also announced reforms to personal independence payment, the main disability benefit for working-age adults, which are estimated to save £4.1 billion in 2029-30. These reforms focus on the PIP gateway assessment of claimants’ ability to perform certain everyday tasks (10 daily living descriptors) and to get around (two mobility descriptors). For both the daily living and mobility components, a claimant is currently entitled to the standard PIP rate if they receive eight points across the relevant descriptors, and to the enhanced PIP rate if they receive 12 points. In January 2025, 3.7 million people received PIP, of which 1.6 million received the standard rate for daily living and 1.9 million the enhanced rate. The policies included in this Spring Statement, and described in more detail below, are:
tightening the qualifying criteria for the daily living component of PIP; and
Tightening the qualifying criteria for the daily living component of PIP
3.24 From November 2026, in addition to current rules, claimants will be required to score four points in at least one of the 10 daily living descriptors to qualify for the daily living component. The static costing of this policy would reduce spending by an estimated £7.9 billion by 2029-30, and would reduce the number receiving the PIP daily living component by an estimated 1.5 million people (32 per cent). This is estimated simply on the basis that 58 per cent of onflows and 52 per cent of award reviews among the existing stock of claimants qualify for the daily living component without scoring four points or more in any descriptor.
3.25 The behavioural response significantly reduces the estimated number of people who lose the PIP daily living component to 800,000 (16 per cent of those receiving the daily living component), with 400,000 of these leaving the PIP caseload entirely due to not receiving the mobility component.[22] This reduces the static savings by around half (£4.0 billion) by 2029-30. This is a highly uncertain judgement which reflects:
the strong financial incentive to qualify for the daily living component, with the standard rate currently £3,800 a year and the enhanced rate £5,600 a year, and to therefore demonstrate four points in at least one descriptor at assessment;
that assessing whether a claimant qualifies for four points in any descriptor is a judgement that heavily relies on an assessors’ interpretation of the relevant criteria, and one which depends primarily on self-reported evidence rather than external medical evidence; and
that these changes will lead to higher levels of mandatory reconsiderations and appeals among unsuccessful claimants, along with higher volumes of reclaims.
Table 3.3: Estimated caseload impact of tightening the qualifying criteria for PIP in 2029-30
Caseload, thousand
Pre-measure
Post-measure
Change
Daily living only
1,050
650
-400
Mobility only
200
600
400
Both awards
3,950
3,550
-400
Total
5,200
4,800
-400
Memo: total daily living award
5,000
4,200
-800
Note: Caseload estimates rounded to nearest 50,000.
Source: DWP
3.26 In addition to the behavioural effects on the PIP caseload outlined above, we have also assumed that a proportion of those whose PIP entitlement is affected by the policy will claim universal credit to compensate for their income loss. The magnitude of all of these behavioural responses is highly uncertain and therefore means there are significant upside and downside risks to the costing of this policy.
3.27 This measure aims to boost the number of assessments completed per day by around 15 per cent from 5,200 to 6,000 daily assessments, which is estimated to save £0.2 billion in 2029-30. This implies an increase of 30 full-time equivalent (FTE) healthcare professionals each month between March 2026 and May 2028. DWP previously increased FTE healthcare professionals by an average of 40 per month between 2021-22 and 2023-24. However, there is a risk that further expansion will be more difficult to deliver given the current higher starting point and the intention (set out in the Pathways to Work Green Paper) to move away from remote assessments.
Table 3.4: Costing of changes to disability benefits
£ billion
Forecast
2025-26
2026-27
2027-28
2028-29
2029-30
Tightening the qualifying criteria for the daily living component of PIP
Note: The figures in this table differ from those in Table 3.1 because they do not include the consequences of decisions for the block grant adjustment, and are on an England and Wales basis.
Source: OBR
Box 3.2: The potential impacts of welfare reforms that have not been incorporated into this forecast
In this forecast we have incorporated the direct fiscal impacts of several welfare policies recently announced in the Pathways to Work Green Paper published on 18 March, as set out in paragraphs 3.10 to 3.27.a The Green Paper includes some additional measures that we have not incorporated into this forecast because policy parameters were not sufficiently specified or because significant aspects of the measures would be the subject of consultation, which is consistent with our standard approach to policy costings. We will incorporate an estimate of the costs of these policies in a future forecast once the final details have been confirmed.
The most significant policy that has not been costed at this forecast is the stated intention to remove work capability assessments (WCA). Under this proposal, eligibility for the universal credit (UC) health element would be decided through the personal independence payment (PIP) assessment. Several key policy details are still outstanding on the proposal. This includes how entitlement will be decided for the stock currently in receipt of the UC health element but not PIP, how UC conditionality will operate, and how entitlement for the UC health element will be decided in Scotland where working-age disability benefits are devolved. We would expect this policy to have a material fiscal impact on incapacity and disability benefit spending, but potentially also to affect the costings of some of the measures included at this event.
Several other policy ambitions announced in the Green Paper could affect the costings of the changes to the PIP gateway and the UC health element. The Government has said that it intends to fully review the PIP assessment which could potentially lead to a wider reshaping of eligibility, and also that it will increase face-to-face PIP assessments which could affect both approval rates at assessment and assessment capacity. The Government has also said it will consult on what support those who lose PIP due to the tightened qualifying criteria should receive. The proposed additional premium for new UC health element recipients after April 2026 will reduce the savings from the reduced UC health element generosity measure in this forecast, but the value of the premium and eligibility criteria have not yet been set.
Labour supply impact of Spring Statement welfare and employment support measures
We have not made a comprehensive assessment of the labour supply impacts of those elements of the Green Paper that we have incorporated into the fiscal forecast. The individual measures’ labour market impacts are complex to assess and would have interacting effects. The Government did not provide us with a comprehensive and robust analysis of these potential effects, and we were not, in the very limited time available, able to develop our own analysis of their net impact on labour supply. In addition, some of the wider Green Paper reforms set out above, which are not included in the fiscal forecast, could also have labour market implications. We will make a full assessment of the Green Paper policies’ effects ahead of our next forecast, following engagement with government analysts and external experts. So far, we judge that their effects fall into three groups:
The increase in the generosity of the universal credit standard allowance poses a downside risk to labour supply. Higher incomes for recipients are likely to lower financial incentives to enter or remain in employment, and, for some individuals, becoming subject to the UC taper may decrease the incentive to work extra hours. We expect to apply our standard labour supply elasticities when we are able to incorporate this into the forecast.b
The larger reductions in the generosity of and eligibility for health and disability benefits would be expected to reduce income and so increase work incentives for existing claimants.c However, PIP can be received both in and out of work, lowering the effect of changes in its eligibility on work incentives. Members of the limited capability for work and work-related activity (LCWRA) group and individuals in receipt of disability benefits also generally have restricted capacity to work and may have been out of the labour market for some time. Our standard labour supply elasticities will therefore provide a less useful starting point than we anticipate will be the case for the standard allowance changes.
The £1 billion in funding for employment support by 2029-30 – which will provide new or additional forms of support to individuals with health problems (such as the LCWRA group) via work coaches or intensive employment support, with the aim of facilitating their entrance into the labour force – could raise labour supply. Here, the policy details that we would require to assess the effectiveness of these plans have not yet been specified sufficiently clearly. Once they have been finalised, we might draw on relevant evidence from previous DWP interventions to estimate the potential labour supply effects.d
The only welfare policy in this Spring Statement whose effects have been incorporated into our employment forecast at this event is therefore the reversal of the previous Government’s November 2023 policy to change elements of the WCA criteria. We have taken the equivalent increase in employment out of the forecast, which reduces employment by 16,000 (and labour supply by 8,000 in average-hours-equivalent terms) in 2029-30.
a) DWP, Pathways to Work: Reforming Benefits and Support to Get Britain Working Green Paper, March 2025.
b) We use these to assess responses to changes in financial work incentives. See OBR, The labour supply effects of the Autumn 2023 National Insurance Contributions cut, February 2024.
c) Specifically, these are changes to the UC health element, which reduce new claimants’ awards and freeze existing claimants’ awards; and changes to disability benefits, which introduce more stringent criteria to access PIP. We expect that other measures, such as introducing WCA reassessments for claimants with a short-term prognosis and increasing the volume of PIP assessments, would have negligible effects on our labour supply forecast.
d) For instance, DWP’s now-published evaluation of a previous disability employment scheme, DWP, Work Choice impact evaluation, February 2025, which we previously drew on in forming our indirect effects judgements around the intervention that is currently known as ‘Connect to Work’. The Government has also recently published analysis of the effect of some of its other interventions, which we could also consider: DWP, The impact of additional Jobcentre Plus support on the employment outcomes of disabled people, March 2025.
Departmental expenditure limits
3.28 The Government’s revised spending plans at this event include several policy decisions which affect the current (day-to-day) and capital spending of central government departments. Overall, these increase total departmental spending by £2.2 billion a year on average and by £0.7 billion in 2029-30. We discuss departmental spending in more detail in Chapter 5, but the main changes reflect:
frontloaded increases in RDEL over the next two years to establish a ‘transformation fund’ that peaks at £1.8 billion in 2026-27, before reducing the overall envelope by £3.6 billion in 2029-30 despite £1.4 billion commitments to a new DWP employment support programme and additional tax and welfare compliance activity;
higher capital departmental spending after 2025-26 from higher defence spending and an unspecified increase to the overall CDEL envelope, which increase CDEL spending by £6.4 billion and £1.6 billion respectively in 2029-30, partially offset by £3.6 billion of ODA savings. Net of reductions to ODA capital spending this leaves overall CDEL spending £4.4 billion higher by 2029-30; and
that the offsetting increase in capital-heavy defence and reduction in ODA,[23] which has a higher proportion of current spending, is near-neutral for total departmental spending and public sector net borrowing, but results in an improvement in the current budget of £2.6 billion by 2029-30.
HMRC compliance and debt collection
3.29 The Government has announced a further set of HMRC compliance and debt collection measures in the Spring Statement which are estimated to raise an additional £1.0 billion by 2029-30. The main measures are:
Funding to place additional tax debts with private debt collection agencies from 2025-26, which is estimated to raise around £0.6 billion in 2029-30. The estimate of additional recoveries is based on current recovery rates by collection agencies and the forecast of the flow of debt. A diminishing returns adjustment is then added which rises to 50 per cent by 2029-30 because the value and collectability of debt is expected to decline over the forecast period, reducing recovery rates.
Hiring additional HMRC debt and compliance staff, which is estimated by 2029-30 to raise £150 million from new debt staff and £95 million from new compliance staff. These estimates are based on the marginal yield gained per enforcement and compliance staff member under previous measures. These are also adjusted with an attrition assumption that reaches 75 per cent for debt staff and 50 per cent for compliance staff by 2029-30, reflecting the falling stock of debt and the lower forecast tax gap.
3.30 The overall tax gap – a measure of the difference between tax collected and theoretical tax liabilities – was estimated to be 4.8 per cent of tax liabilities in 2022-23, the latest year for which HMRC publishes an estimate, and has been stable around this level since 2017-18. Chart 3.3 shows that the cumulative effect of compliance policies announced since the March 2023 Budget is estimated to reduce this by 0.4 percentage points by 2029-30.[24] HMRC has estimated an illustrative counterfactual tax gap by projecting the current tax gap across the forecast period assuming it remains constant as a share of tax liabilities.
Chart 3.3: HMRC tax gap as a per cent of theoretical tax liabilities
3.31 The historic and estimated future path of the tax gap suggest both upside and downside risk to the forecast. The projected decrease in the tax gap would follow a period since around 2017-18 where it has been relatively stable, despite previous governments introducing a wide range of measures aimed at increasing tax compliance over this period. However, HMRC has been successful in previous periods, in particular between 2013 and 2017, in significantly reducing the tax gap, though this may in part have been driven by wider economic trends such as diminishing use of cash, as we discussed in Box 4.1 of our March 2024 Economic and fiscal outlook (EFO).
3.32 Tax debt available for pursuit has been at historically high levels since the pandemic. The value of tax debt available for pursuit stood at £147 billion in 2023-24, well over twice the average pre-2020 level of £63 billion. Tax debt is expected to decline over the medium term both as new debt falls back toward pre-pandemic levels and as a result of existing HMRC debt collection activity.
3.33 To account for these risks in our policy costings, we assume that the returns from targeting tax debt and compliance diminish over the forecast. However, there remains significant uncertainty around the yield that will be generated from these measures. We intend to undertake further work with HMRC on the approach to tax debt collection and compliance costings, including by reviewing the interaction between the overall receipts forecast, the estimated tax gap, and the forecasts for both tax debt stocks and flows.
3.34 The measures which increase the numbers of HMRC compliance and debt officers require significant additional DEL funding across the forecast period. As HMRC’s full DEL settlement has not been agreed beyond 2025-26, consistent with our approach in previous EFOs we requested additional information from the Government to satisfy ourselves that these scorecard measures would be truly additional to the baseline activity. We also asked the Treasury to provide assurances that HMRC would receive the funding necessary to achieve the baseline compliance activity implicit in our forecast. The Treasury has provided this assurance and the funding provision is set out in Table 3.5. We will look to revisit HMRC’s compliance funding provision in the autumn following the Spending Review.
Table 3.5: DEL costs for HMRC baseline and policy compliance
£ million
2025-26
2026-27
2027-28
2028-29
2029-30
Baseline compliance funding
1,772
1,863
1,937
2,046
2,180
Baseline debt funding
250
267
282
294
281
AB24 additional compliance funding
134
231
372
435
434
AB24 additional debt funding
54
80
83
92
111
SS25 additional compliance funding
5
13
20
28
34
SS25 additional debt funding
16
23
34
45
83
Cost of total HMRC measures(1)
2,231
2,477
2,728
2,940
3,123
1) This is £0.5 billion higher in pre-SS25 baseline compliance funding each year due to a miscalculation in Autumn Budget 2024.
Source: HM Treasury
The long-run impact of Government policy
3.35 The Charter for Budget Responsibility requires us to assess the long-term impacts of new government policies, where these are material. We therefore report on new policies with long-run economic and fiscal impacts, especially where these differ from the effects that will have occurred by the five-year timeframe at which we are required to produce our medium-term forecasts. In this forecast, these include the Government’s residential planning reforms, the Comprehensive and Progressive Agreement for Trans-Pacific Partnership (CPTPP) trade agreement, and the changes to the universal credit health element.
Residential planning reform
Effects on housebuilding
3.36 At this event we have estimated the economic and fiscal impacts of the revised National Planning Policy Framework (NPPF) announced in December.[25] The NPPF contains several measures including changes to local housebuilding targets, requirements for some local authorities to meet their targets by releasing parts of the green belt for housebuilding, the strengthened presumption in favour of sustainable development, and ‘Golden Rules’ which set out affordability and public infrastructure requirements for developments on the green belt. As this is largely a regulatory policy change it does not have a direct fiscal impact but nonetheless affects the fiscal forecast via its effect on the economy.
3.37 In our central forecast, we judge that these reforms could boost housebuilding by 170,000 in total over the next five years, resulting in cumulative UK-wide net additions to the stock of 1.3 million from 2025-26 to 2029-30 (a 16 per cent increase). At the forecast horizon annual net additions to the UK housing stock are projected to reach a forty-year high of 305,000 per year. While this would represent a significant acceleration in the pace of housebuilding, it would amount to a modest 0.5 per cent increase to the UK housing stock of over 32 million by the end of the decade.[26] This increased housebuilding over the forecast period is driven mainly by requirements for local authorities to release land to meet development needs. In addition, the strengthened presumption in favour of sustainable development, if triggered, requires local authorities to release land for further development unless the adverse impacts of doing so significantly outweigh the benefits. Given the uncertainties around these estimates, in Box 3.3 we present alternative scenarios for both higher and lower rates housebuilding in response to these reforms.
Chart 3.4: Net additions to the UK housing stock
3.38 As discussed in Chapter 2, the pre-policy housebuilding forecast shown in Chart 3.4 takes into account higher interest rates and the effect of environmental and building safety legislation. In our fiscal forecast, we have also accounted for the direct fiscal revenues associated with the building safety levy, which was legislated for in the Building Safety Act 2022, and is a tax paid by developers on new build homes requiring building control approval in England. The levy will come into effect in October 2026 and is estimated to raise an average of £0.3 billion in the final two years of the forecast.
Effects on GDP
3.39 Greater housebuilding affects both the demand and supply sides of the economy. On the demand side, we estimate that the effect of more housebuilding is worth 0.6 per cent of GDP by 2029-30, due to greater residential investment. Most of this increase (the 0.5 per cent shown in the blue bars in Chart 3.5) does not reflect an increase in the economy’s supply capacity.[27] So, given little spare capacity in the economy in the medium term, we expect there to be some ‘crowding out’ of this increased demand, via adjustments in interest rates and relative prices, which lower consumption, net trade and other residential investment to improve existing dwellings (purple, aqua and grey bars).
3.40 On the supply side, we estimate that these reforms could raise the level of potential output by 0.2 per cent by 2029-30, which is the combined effect of increased construction sector productivity and increased housing services:
Construction sector productivity: we judge that a 0.14 per cent increase in economy-wide GDP could result from an increase in the construction sector’s ability to produce houses. Around half of the value of a house reflects the value of land rather the construction costs of building a house on it. Green belt land release and planning permission should enable labour and capital to be put to more productive use on land released for development than if these factors were employed elsewhere in the economy and the land left undeveloped.[28]
An increase in the flow of housing services is estimated to lead to a further 0.07 per cent increase in potential output, over two-thirds of which is from owner-occupied housing. A larger housing stock increases the economy’s capacity to produce housing services, the value of which is captured in the national accounts as both actual and imputed rents. As discussed below, the fiscal implications of this, however, are limited as the imputed rent from owner-occupied houses is not taxed directly.
3.41 We would expect the GDP effects that operate through these channels to increase as the housing stock increases over time. In addition, further increases to potential GDP from labour mobility and agglomeration effects may become more material over time. The potential long-run impact of these reforms on GDP is further discussed in paragraph 3.44.
Chart 3.5: The economic impacts of planning reform
Box 3.3: Alternative scenarios for housebuilding
Our central forecast assumes cumulative net additions to the housing stock in the period to 2029-30 are under 1.3 million. Of this, we estimate 170,000 additions are due to the Government’s residential planning reforms and these raise GDP by 0.2 per cent at the forecast horizon. However, there are several significant uncertainties around this estimate. For instance, capacity constraints in the housebuilding sector could prove more binding than assumed if, for example, growing demands on a limited construction workforce hinder housebuilders’ ability to deliver a rapid acceleration in the flow of new houses. Or local opposition to reforms could prevent or delay housebuilding by more than we have assumed, particularly given much of the additional development in the next five years is assumed to take place on current green belt land. Conversely, growing economies of scale and greater adoption of modular construction methods may enable sustained improvements in the sector’s efficiency and its capacity to build houses.
To illustrate the possible range of outcomes for housebuilding and potential output, we consider two alternative scenarios:
In the low scenario, cumulative net additions are 1.2 million over the forecast period, a 0.1 million decrease relative to our central forecast. This results in a 0.1 per cent increase to GDP in 2029-30, as a smaller increase in investment leads to less of a pickup in construction sector productivity and, as the stock of houses is smaller, so are the housing services it generates.
In the high scenario, cumulative net additions are over 1.3 million over the forecast period, a 0.1 million increase relative to our central forecast. The symmetric impacts result in a 0.3 per cent increase in GDP in 2029-30, primarily from the higher investment and associated increase in construction sector productivity, but also from the increased flow of services from a larger housing stock.
Chart B: Alternative housebuilding scenarios and their GDP impacts
House prices
3.42 We judge that the 0.5 per cent increase in housing supply will lead to a small reduction in house prices relative to our pre-measures baseline, reducing the average house price by around 0.9 per cent by 2029-30, consistent with the range of external evidence on the elasticity of house prices relative to changes in the housing stock.[29] While there may be a reduction in the (mix-adjusted) average house price recorded by the ONS given the increase in housing supply, we would also expect some upward pressure on the average transacted house price, as new builds typically transact at a higher price than the existing stock.
Effects on the public finances
3.43 The planning reforms have no associated direct fiscal implications, but we estimate that the indirect effects will lower borrowing. By 2029-30, the £3.5 billion increase in receipts in from the indirect effects of Government decisions, shown in Table 3.1, is primarily due to the planning reforms. This is driven by the increase in GDP boosting general tax receipts and higher property transactions boosting stamp duty receipts. Around a quarter of the increase in GDP due to planning reform reflects the higher imputed rents from a larger stock of owner-occupied housing, which the Government does not tax directly, and therefore has no direct impact on the fiscal forecast.
Long-term effects on the economy
3.44 Should these reforms continue to be in place beyond 2030, the corresponding impact on housebuilding should continue to grow, potentially allowing yearly net additions to reach 320,000 by 2034-35. As shown in Chart 3.6, the resulting impact on potential GDP of higher construction sector productivity and housing services would increase from 0.2 to 0.4 per cent.
3.45 In addition, over this longer-term horizon we would expect a small additional benefit primarily from labour mobility and agglomeration effects, as individuals move to more productive areas. The planning reforms are likely to result in more houses being built in or near higher-productivity areas, notably urban centres that already benefit and would benefit further from agglomeration effects, which some empirical work suggests are material.[30] While we judge that these effects are likely to be limited in the near term, and uncertain in magnitude, they could add a further 0.1 per cent to GDP by 2034-35.[31]
Chart 3.6: The long-term economic impacts of planning reform
Comprehensive and Progressive Agreement for Trans-Pacific Partnership
3.46 The UK’s accession to the Comprehensive and Progressive Agreement for Trans-Pacific Partnership came into force on 15 December 2024, lowering tariffs on UK imports from, and exports to, member countries. The CPTPP is a trade agreement across twelve countries mostly bordering the Pacific Ocean, including Japan and Australia. Together, CPTPP countries (excluding Canada and Mexico) accounted for 4 per cent of total UK imports and 6 per cent of exports in 2023.[32]
3.47 Over the forecast period, the CPTPP is estimated to lower customs duty revenues by around £30 million a year. Over the longer term, lowered customs revenues will likely be more than offset by gains to both domestic producers and consumers from trade liberalisation. The Government has estimated that the agreement will lead to an increase in GDP of £2 billion (around 0.1 per cent of GDP) in the long run.[33]
Welfare measures
3.48 Changes to welfare policy are expected to reduce welfare spending by £4.8 billion by the forecast horizon. Most of these savings are likely to continue beyond the forecast period in a relatively predictable way. However, savings from the reduction in generosity of the universal credit health element, discussed in paragraphs 3.17-3.20, will significantly differ in the long term. This is because most of the savings from this measure arise from halving the UCHE for claimants newly classified as LCWRA from April 2026 onwards. However, durations in the LCWRA group are long and off-flow rates low, so this will take significant time to work its way through the caseload. In steady state, when all claimants have flowed onto the benefit after April 2026, we estimate this measure will save £8.5 billion a year (in 2029-30 prices).
Measures with highly uncertain costings
3.49 We assign an uncertainty rating to all policy costings.[34] The measures that we have given a ‘high’ or ‘very high’ uncertainty rating are set out in Table 3.6. All highly uncertain measures included in this Statement are discussed in more detail elsewhere in this chapter.
Table 3.6: Costings of measures with high degrees of uncertainty
£ million
Head
2024-25
2025-26
2026-27
2027-28
2028-29
2029-30
Uncertainty
PIP qualifying crieria changes
Spend
0
0
-185
-1,703
-3,296
-4,455
Very high
UC health element changes
Spend
0
0
-749
-1,533
-2,294
-3,007
Very high
CTG: debt collection agencies
Tax
-45
-144
-151
-167
-239
-522
High
CTG: HMRC debt management staff
Tax
-23
-120
-413
-388
-332
-115
High
Note: A positive sign implies an increase in borrowing. See our online detailed scorecard for the full, measure-by-measure breakdown of every costing.
Source: OBR
Classification treatment of new policies
3.50 Since our October forecast the Government has introduced a number of new measures, and policy has become sufficiently firm to incorporate some previously announced measures. On the advice of Treasury classification experts and pending a decision by the ONS we are recording the following transactions in the following ways:[35]
Receipts from the extended producer responsibility, building safety levy, a gambling levy, and various visa and passport fees as taxes on production; and
Receipts from firearms licenses as the sale of government services.
Updates on previous measures
3.51 We cannot review and re-cost all previous measures at each fiscal event, but we do look at those where the original (or revised) costings seem to be under- or over-performing, and costings that were identified as particularly uncertain. Furthermore, and in line with a recommendation of the OBR’s 2025 external review, we use a coordinated monitoring and evaluation process across government to assess the judgements we have made since the Spring Budget 2023 on the indirect effects of supply-side policies. We will publish an initial assessment of this and of our approach to assessing indirect effects as part of our response to the external review later this year.[36] This will include a review of the de minimis threshold we have set for assessing labour supply impacts.
Employer NICs changes
3.52 In the October 2024 EFO, we assumed that firms would pass on most, but not all, of the higher cost resulting from the increase to employer NICs to their employees via lower real wages. In 2025-26, the year in which the tax change is introduced, we assumed firms pass on 60 per cent of the higher costs to workers and consumers, via lower nominal wage increases and higher prices, with the remaining 40 per cent absorbed by the employer in lower post-tax profits. Thereafter, we assumed, based on demand and supply elasticities for labour, that 76 per cent of the total cost is passed through to employees via lower real wages, leaving 24 per cent of the cost to affect profits, and leading to a 50,000 downgrade to employment in average-hours-equivalent terms by 2029-30. Of the long-run pass-through of this cost to employees’ real wages, we assumed four-fifths comes through lower nominal wages and one-fifth via higher prices.
3.53 The policy will not be implemented until April, but surveys released since our October forecast indicate that firms do indeed anticipate reacting to higher costs via these margins of adjustment. That said, surveys provide mixed evidence on the precise balance between them (and indeed other margins, such as productivity and changes in non-labour costs). Most surveys do point to a substantial reduction in nominal wages relative to what would otherwise have occurred, including, in particular, the Bank of England’s Agents’ pay survey and Brightmine’s Pay Trends report.[37] A few suggest that higher prices may be a slightly more prominent near-term adjustment mechanism than lower nominal wages, while the Decision Maker Panel and Institute of Directors’ surveys also suggest responses via employment will be relatively common. This could be because the low-paid, for whom demand may be relatively elastic, will be subject to wage rigidities due to the national living wage, and because the industries that are most affected by the NICs increase tend to be relatively labour-intensive.[38] There is a risk that responses via prices and employment are larger than is currently assumed in our forecast. We will monitor the available evidence and adjust our judgements if enough evidence to do so emerges.
Other changes to previously announced measures
3.54The extended producer responsibility (EPR) is a scheme which requires packaging producers to pay a fee for the packaging they supply to or import into the UK market, effectively compensating local authorities for the cost of packaging waste management. We previously captured EPR revenues as a fee received and spent within DEL, so the new treatment of EPR revenues as a tax boosts receipts and decreases DEL fees by an equal and offsetting amount. While the policy was announced in 2021, there was previously not enough detail on the fees for this to be reflected as a tax in our receipts forecast. It will come into effect from April 2025 and is estimated to raise on average £1.6 billion a year between 2025-26 and 2029-30. The costing includes only a very small behavioural response to the policy from packaging producers and local authorities. This is based on assessments by the Department for Environment, Food and Rural Affairs, the responsible department, that the policy is unlikely to have a material impact on rates of recycling or packaging waste volumes in the next five years.
3.55 The Government has introduced technical changes to the rules around the Temporary Repatriation Facility (TRF), which relate to a subset of foreign income and gains that have previously been remitted to the UK and distributions from trusts. These changes do not materially affect the costing of the TRF or any of the key behavioural judgements in the costing of the new non-domicile regime.
Policy risks
3.56 Parliament requires that our forecasts only reflect current government policy. As such, when the Government sets out ‘policy ambitions’ or ‘intentions’, we ask the Treasury to confirm whether they represent firm policy. We use that information to determine what should be reflected in our forecast. Where they are not yet firm policy, we note them as a source of risk to our central forecast. A full database of risks to this forecast and changes from previous updates is available on our website. As discussed in further detail in Box 3.2, the Pathways to WorkGreen Paper contains several policy risks, in particular from the abolition of the WCA. Two other measures which pose risks to our forecast are:
We are yet to reflect the impact of the Government’s Employment Rights Bill (ERB) in the forecast. While the ERB outlines the key policy intentions set out in the Government’s Plan to Make Work Pay, and gives the Government powers to implement additional legislation, there is not yet sufficient detail or clarity about final policy parameters to allow us to robustly assess the economic and fiscal impacts. Many important design elements will only be clarified in secondary legislation following royal assent. Employment regulation policies that affect the flexibility of businesses and labour markets or the quantity and quality of work will likely have material, and probably net negative, economic impacts on employment, prices, and productivity. Given these potentially significant impacts, we will incorporate a central estimate of the aggregate impacts of the policy package in our next forecast.
The Planning and Infrastructure Bill (PIB) was introduced to parliament in March 2025, but details were not yet sufficient to incorporate fully into the forecast. As outlined above, many of the measures in it are likely to support the delivery of the NPPF residential planning reforms. Other parts of the PIB, such as changes to the Nationally Significant Infrastructure Projects regime and electricity network connections, have broader impacts on infrastructure and could have effects on business investment. We will consider the full impacts in our forecast when the policy is sufficiently progressed.
Chapter 4: Public sector receipts
Summary of the receipts forecast
4.1 Total public sector receipts are forecast to rise as a share of the economy from 39.9 per cent of GDP (£1.1 trillion) in 2023-24 to 41.7 per cent of GDP (£1.4 trillion) in 2028-29 and 2029-30. Within this, National Accounts taxes as a share of GDP (the ‘tax take’) are forecast to increase from 35.5 per cent in 2023-24 to 37.7 per cent of GDP in 2027-28, before stabilising at 37.5 per cent of GDP over the remainder of the forecast period. This peak would be a historic high and a 4.6 percentage point increase on the pre-pandemic level of 33.2 per cent of GDP in 2019-20.
4.2 The main drivers of the 2.1 per cent of GDP increase in the tax take from 2023-24 to 2029-30 are personal taxes, particularly income tax and National Insurance contributions (NICs). The rise in personal taxes next year is driven by the employer NICs measures from the Autumn 2024 Budget, and in the following two years by a combination of stronger average earnings growth and the freezing of personal tax thresholds until April 2028. There is also a boost to receipts from the Temporary Repatriation Facility (TRF) announced at Autumn 2024 Budget as part of the reforms to the non-domicile regime. The tax-to-GDP ratio falls slightly over the final two years as the personal tax threshold freeze ends, the TRF comes to an end, and there is a decline in some smaller taxes, including fuel duty due to the rising share of electric vehicles.
4.3 Relative to our October 2024 forecast (restated for Blue Book 2024 nominal GDP revisions),[39] National Accounts taxes as a share of GDP are 0.5 percentage points lower in 2024-25, but broadly unchanged over the remainder of the forecast. The shortfall in 2024-25 against the October forecast is mainly due to lower-than-expected outturn receipts from corporation tax, self-assessed income tax, and capital gains tax. Much of this shortfall relates to 2023-24 liabilities and suggests that small company profits, partnership income, and dividends were more depressed than we expected by that year’s high and externally driven inflation and high interest rates. The weakness in corporation tax also likely reflects weaker-than-expected profits growth in the second half of 2024-25. Over the medium term, the shortfall in total receipts in 2024-25 is broadly offset mainly by stronger forecast growth in nominal earnings which pushes up income tax and NICs receipts. The direct and indirect effects of policy included in this forecast increase the tax take by less than 0.1 per cent of GDP on average.
Chart 4.1: National Accounts taxes as a share of GDP
Table 4.1: Public sector receipts as a share of GDP
Per cent of GDP
Outturn
Forecast
2023-24
2024-25
2025-26
2026-27
2027-28
2028-29
2029-30
Income tax
10.1
10.8
11.0
11.5
11.8
11.5
11.5
NICs
6.5
5.8
6.7
6.7
6.6
6.6
6.5
Value added tax
6.1
6.0
6.0
6.0
6.1
6.1
6.1
Onshore corporation tax(1)
3.2
3.3
3.3
3.3
3.3
3.4
3.4
Council tax
1.6
1.7
1.7
1.7
1.7
1.8
1.8
Capital taxes(2)
1.4
1.4
1.6
1.7
1.8
2.0
2.1
Business rates
1.1
1.1
1.1
1.2
1.2
1.1
1.1
Fuel duties
0.9
0.8
0.8
0.9
0.8
0.8
0.8
Alcohol and tobacco duties
0.8
0.7
0.7
0.7
0.7
0.7
0.7
Other taxes
3.8
3.7
3.8
3.8
3.7
3.6
3.6
National Accounts taxes
35.5
35.3
36.8
37.4
37.7
37.5
37.5
Interest and dividend receipts
1.6
1.5
1.4
1.4
1.4
1.3
1.3
Other receipts
2.9
2.9
2.9
2.9
2.9
2.9
2.8
Current receipts
39.9
39.7
41.1
41.7
41.9
41.7
41.7
1) Includes electricity generator levy and Pillar 2 taxes.
2) Includes capital gains tax, inheritance tax, property transaction taxes, and stamp taxes on shares.
Source: ONS, OBR
4.4 The tax-to-GDP ratio is forecast to be 4.3 percentage points higher in 2029-30 than it was in 2010-11 following the financial crisis. Over this period the tax-to-GDP ratio evolves in the following ways:
2010-11 to 2019-20: The tax-to-GDP ratio was broadly flat over this period. Income tax and NICs decreased as a share of GDP due to subdued earnings growth and increases to the personal allowance. Fuel duty and oil and gas receipts fell due to successive fuel duty rate freezes and declining oil and gas prices and North Sea production. VAT receipts increased more than any other tax as a share of GDP due to the increase in the standard rate of VAT from 17.5 per cent to 20 per cent in January 2011, and successive falls in the ‘VAT gap’, which measures VAT non-compliance (see Box 4.1 of the March 2024 Economic and fiscal outlook (EFO) and Chapter 3 of this EFO for more detail on how the tax gap forecast has evolved over time).
2019-20 to 2023-24: Nearly all major taxes grew as a share of GDP in the period immediately after the pandemic, adding 2.3 percentage points to the tax-to-GDP ratio. Income tax and NICs rose significantly due to the freeze to personal tax thresholds and the subsequent period of high inflation. The rise in onshore corporation tax was driven by the increase in the main rate from 19 per cent to 25 per cent in April 2023 and resilient profits in higher tax-paying sectors. Oil and gas receipts rose sharply in 2022-23 due to the introduction of the energy profits levy and rising gas prices, but subsequently fell back as prices declined. Fuel duty was the only major tax to see a persistent fall over this period as a result of successive duty rate freezes, the 5p rate cut, and increasing uptake of electric vehicles.
2023-24 to 2029-30: The further forecast increase of 2.1 percentage points over the forecast period is mainly driven by expected growth in personal and capital taxes. The fall in the tax-to-GDP ratio in 2024-25 is mainly due to the cuts to employee NICs introduced by the previous Government. The subsequent rise in 2025-26 reflects the increase in employer NICs and changes to the capital gains tax regime announced by the current Government, and continued strong forecast nominal earnings growth. The final two years of the forecast see a slight fall in the tax-to-GDP ratio, driven by lower fiscal drag due to the unfreezing of personal tax thresholds from April 2028, more subdued nominal earnings growth, the end of the Temporary Repatriation Facility in April 2028,[40] and further small decreases in fuel and tobacco duties due to vehicle electrification and declining tobacco consumption, respectively.
Chart 4.2: Changes in the composition of the tax take relative to 2010-11
4.5 Chart 4.3 shows the contribution of government policy decisions to the 4.4 percentage point increase in the tax-to-GDP ratio from 33.2 per cent in 2019-20 before the pandemic to 37.5 per cent in 2029-30:
The inherited, pre-2019 tax system adds 0.8 percentage points to the tax-to-GDP ratio between these years.
Forecast revisions add an additional 0.5 percentage points.
The direct impacts of the previous Governments’ policy decisions between Spring 2020 and the March 2024 Budget increase it by a further 1.8 percentage points of GDP between 2019-20 and 2029-30, primarily through freezes to the personal tax thresholds and the increased headline rate of corporation tax.
The direct impacts of the current Government’s policy decisions add a further 1.3 percentage points to the tax-to-GDP ratio between 2024-25 and 2029-30, primarily through the increases to employer NICs, tax compliance measures, and increases to capital taxes, which were announced at the Autumn 2024 Budget.
Chart 4.3: The rise in the tax-to-GDP ratio from 2019-20 to 2029-30
4.6 There is significant uncertainty around the forecast increase in the tax take. Historically, the average absolute five-year forecast error for receipts as a share of GDP is 0.9 percentage points. Chart 4.3 shows that, in addition to the substantial recent tax policy changes, changes to the outlook for the tax-to-GDP ratio have been driven by revisions to the underlying forecast. These revisions can be driven by changes to the economic drivers of tax receipts or by wider behavioural factors. Chart 4.2 shows that much of the increase over the forecast period is expected to come from higher income tax (IT), NICs, and capital gains tax (CGT). The forecast for IT and NICs is very sensitive to nominal earnings growth which is assumed to grow by 18.7 per cent over the current forecast. The CGT forecast is very sensitive to financial asset prices, which are volatile and hard to forecast, as well as to behavioural responses to policy changes. The forecasts for all major taxes are also sensitive to the evolution of the tax gap, a measure of the degree of tax compliance and debt, which is discussed further in Chapter 3 of this EFO.
Change in receipts since the October 2024 forecast
4.7 Relative to the October 2024 forecast, and including the impact of policy measures, total public sector receipts are forecast to be £7.5 billion lower in 2024-25 (0.4 per cent of GDP) but an average of £3.2 billion a year higher between 2025-26 and 2029-30 (0.1 per cent of GDP)[41]:
Underlying forecast differences reduce receipts by £2.4 billion a year on average from 2025-26. Lower-than-expected 2024-25 receipts outturn reduces the starting point for the forecast, particularly for corporation tax, self-assessed income tax (SA IT), and CGT (see Box 4.1). Over the medium term this is partly offset, mainly by a stronger forecast for nominal earnings growth boosting the income tax and NICs forecast.
Fiscally neutral receipts, which are those offset in spending, are £1.4 billion a year higher on average through the forecast than in October. This is largely due to the full reflection of previously announced extended producer responsibility fees in this forecast, which increases receipts by £1.8 billion in 2029-30 (see paragraph 3.54 for more details).
The direct effect of policy measures announced at the Spring Statement adds £0.1 billion to receipts this year, rising to £2.2 billion in 2029-30. This is mainly from the tax compliance measures and fiscally neutral changes discussed in paragraphs 3.29 and 3.5.
The indirect effect of policy measures increases receipts by £3.5 billion in 2029-30. This is largely due to increased housebuilding as a result of the Government’s planning reforms, which drives slightly higher earnings and additional stamp duty revenue, discussed further in paragraph 3.43.
Table 4.2: Receipts: changes since October 2024
£ billion
Outturn
Forecast
2023-24
2024-25
2025-26
2026-27
2027-28
2028-29
2029-30
October 2024 forecast
1,101
1,149
1,229
1,291
1,346
1,390
1,440
March 2025 forecast
1,099
1,141
1,229
1,292
1,351
1,394
1,445
Difference
-2.2
-7.5
0.0
1.8
4.7
4.3
5.1
By policy and forecast differences
of which:
Underlying forecast differences(1)
-2.2
-5.9
-3.0
-2.5
-1.8
-2.8
-1.7
PSNB-neutral forecast differences(2)
0.0
-1.7
1.0
1.2
2.1
1.7
1.1
Direct effect of Government decisions
0.0
0.1
1.0
1.4
1.6
1.9
2.2
Indirect effects of Government decisions
0.0
0.1
1.0
1.7
2.7
3.5
3.5
By tax head
of which:
Income tax
0.0
-1.4
2.1
2.7
5.8
5.7
6.1
NICs
0.0
0.3
1.8
2.1
2.5
2.7
3.1
Onshore corporation tax
-3.3
-5.5
-5.9
-5.1
-4.3
-4.0
-3.7
VAT
0.0
0.1
-0.8
-1.8
-2.4
-2.6
-2.6
Capital taxes(3)
0.0
-1.4
-2.8
-1.8
-3.4
-3.4
-3.9
Oil and gas revenues(4)
0.4
-0.3
1.0
0.3
0.0
-0.3
0.3
Fuel duties
0.0
0.0
0.1
0.0
-0.1
-0.3
-0.4
PSNB-neutral receipts
0.2
-1.7
1.3
1.6
2.9
2.8
2.3
Other receipts
0.5
2.4
3.2
3.6
3.6
3.7
3.9
Memo: changes in receipts ex PSNB-neutral
-2.5
-5.8
-1.3
0.1
1.8
1.5
2.8
1) Excludes PSNB-neutral forecast changes.
2) Includes depreciation, VAT refunds, most environmental levies, extended producer responsibility, community infrastructure levy, and council tax.
3) Includes property transactions taxes, capital gains tax, inheritance tax, and stamp duty on shares.
4) Offshore corporation tax, petroleum revenue tax, and energy profits levy.
Source: ONS, OBR
Box 4.1: The in-year shortfall in 2024-25 receipts and its impact on the forecast
The latest forecast for 2024-25 public sector receipts is £7.5 billion (0.6 per cent) lower than we expected in October, with much of the shortfall in self-assessed income tax, capital gains tax (CGT), and corporation tax. As Chart A shows, in percentage terms this in-year change is the largest downward revision to receipts between an autumn and spring forecast since 2012. There have been larger recent upward revisions of 1.4 per cent in 2016-17, 1.5 per cent in 2022-23, and of much greater magnitude in 2020-21 and 2021-22 during the pandemic.
Chart A: Revisions to in-year receipts at Spring forecasts
The shortfall in self-assessed income tax and CGT, and a portion of the shortfall in corporation tax, pertains to 2023-24 liabilities (as these taxes are paid in the year after the liabilities arise). Initial evidence on the composition of the shortfall suggests it has been concentrated in receipts from small company CT, income tax from partnerships and dividend income, and CGT from financial assets. This may be because the high inflation and interest rates in 2023-24 decreased the profitability of small businesses by more than we anticipated. This high inflation was externally driven and so for many small businesses will have increased costs by more than revenues. Further, the tax forecast models may not have adequately captured the effects of higher interest rates on small business expenditure and profits.
A significant portion of the CT shortfall relates to payments on profits in this financial year, with CT from large companies £4.2 billion lower than expected in October. This reflects weaker-than-anticipated profits in the second half of 2024-25, due in part to more persistent earnings growth squeezing profits. This can also be seen in outturns for other taxes where stronger-than-anticipated nominal earnings mean that PAYE receipts are £1.2 billion higher than expected in October.
The latest year’s receipts data provide the starting point for the medium-term forecast. Therefore, changes such as these will typically drive a proportional change in the forecast across the medium term by effectively raising or lowering the level of the effective tax rate across the forecast. The exception to this is where there is reasonable evidence to suggest that changes to the current year’s outturn reflect temporary or volatile factors. In this forecast, we made two such adjustments:
We judged that half of the shortfall in small company corporation tax at this event should not be pushed through to later years. This is because some of the weakness in 2023-24 may be linked to the deferral of writing off losses from previous years against a CT liability until 2023-24, due to the pre-announcement of the CT rate increase.
CGT liabilities in both 2022-23 and 2023-24 were much weaker than expected after unusually high gains realised in 2020-21 and 2021-22. Because CGT is inherently a more volatile revenue stream, we assume that in the medium term it will return to its pre-pandemic growth trend as share of GDP, and so have tapered off some of the 2023-24 weakness over the forecast period.
After accounting for these two adjustments, £4.5 billion of the overall £7.5 billion shortfall compared to October is assumed to be structural.
We are seeking to improve our approach to forecasting in-year estimates ahead of our next forecast in the autumn. We will audit the existing range of approaches used to produce in-year estimates across the receipts forecasts to identify which produce the most reliable results. We will also seek to use more timely sources of economic data and information from near-term economic forecasts to better inform the estimates. We plan to discuss this further in future Forecast evaluation reports.
Tax-by-tax analysis
Income tax and NICs (excluding self-assessment)
4.8 Income tax (excluding self-assessment) is forecast to raise £260.3 billion in 2024-25 (9.0 per cent of GDP), a 10.9 per cent increase from 2023-24. This rise is driven by strong nominal earnings growth and frozen tax thresholds. Receipts are then forecast to rise to £310.0 billion (9.6 per cent of GDP) in 2027-28, with growth continuing to be driven by the freezing of personal tax thresholds. Thereafter, growth slows and receipts decline slightly as a share of GDP to £322.0 billion (9.3 per cent) in 2029-30. This is due to the end of the personal tax thresholds freezes in April 2028 and slower nominal earnings growth driven by the assumed fall back in the labour share to its historical average from its peak in 2025-26.
4.9 Relative to the October forecast, non-SA IT is forecast to raise £2.0 billion more in 2024-25, and an average of £6.9 billion a year more over the rest of the forecast. This is driven by stronger-than-expected PAYE receipts in 2024-25 and higher forecast nominal earnings growth in 2025 and 2026.
4.10 NICs are forecast to raise £167.8 billion in 2024-25 (5.8 per cent of GDP), a 6.3 per cent decrease from 2023-24. This is primarily due to the reductions to employee NICs announced by the previous Government, with the second cut introduced in April 2024. The increase to employer NICs announced by this Government at the October 2024 Budget causes forecast NICs to rise by nearly 20 per cent to £200.6 billion in 2025-26 (6.7 per cent of GDP). NICs receipts are then expected to increase broadly in line with wages and salaries growth over the rest of the forecast to £226.2 billion in 2029-30 (6.5 per cent of GDP). The impacts of these policy changes were discussed in more detail in paragraphs 3.8-3.12 of the October 2024 EFO.
4.11 Relative to the October forecast, NICs receipts are £0.3 billion higher in 2024-25, and an average of £2.4 billion a year higher over the rest of the forecast. This is due to stronger 2024-25 receipts raising the starting point for the forecast and higher earnings growth, particularly in 2025. Our assessment of the impacts of the employer NICs increase announced at the October 2024 Budget has not changed materially at this event as discussed in Chapter 3, with higher forecast earnings growth increasing the amount raised by the policy by an average of just £0.2 billion a year from 2025-26.
Table 4.3: Non-SA income tax and NICs: changes since October
£ billion
Outturn
Forecast
2023-24
2024-25
2025-26
2026-27
2027-28
2028-29
2029-30
October 2024 forecast
413.8
425.7
471.0
492.5
513.5
522.3
536.9
March 2025 forecast
413.8
428.0
478.1
500.9
523.0
532.7
548.2
Difference
0.0
2.4
7.1
8.4
9.5
10.4
11.3
of which:
Forecast changes to earnings and employment
4.8
7.3
8.0
8.7
8.6
9.0
Pre-measures effective tax rate
-2.4
-0.9
-0.5
-0.7
-0.4
-0.3
Direct effect of Government decisions
0.0
0.0
0.1
0.2
0.2
0.3
Indirect effects of Government decisions
0.0
0.5
0.8
1.3
2.1
2.3
Source: ONS, OBR
Self-assessed income tax
4.12 Self-assessed IT is forecast to raise £49.7 billion in 2024-25 (1.7 per cent of GDP), a 16.5 per cent increase from 2023-24. As 2024-25 SA IT receipts mainly relate to activity in 2023-24, this is due to growth in savings and self-employment incomes in that year combined with frozen tax thresholds. These receipts are then forecast to rise to £76.2 billion in 2029-30 (2.2 per cent of GDP).
4.13 Relative to the October forecast, SA IT receipts are £3.5 billion lower this year, and an average of £2.4 billion a year lower over the remainder of the forecast. The October forecast assumed that receipts would grow 25 per cent this year compared to 2023-24, due to: (i) the reduction in April 2023 of the threshold for the additional rate of income tax and the freezes in the personal allowance and higher-rate thresholds; (ii) high interest rates boosting savings income; and (iii) a return to a more usual level of dividend income after it had been depressed in 2022-23 by the unwinding of forestalling ahead of the increase to dividend rates in April 2022. Provisional analysis suggests that while self-employment and savings income grew in line with the forecast, both partnership and dividend income were significantly weaker than expected. As set out in Box 4.1, this may be related to high inflation and rising interest rates in 2023-24.
4.14 The shortfall in SA IT receipts in 2024-25 lowers the starting point for the forecast and so reduces receipts by a similar amount each year over the medium term. As announced in October 2024, from April 2026, carried interest income will be taxed under the income tax regime rather than as capital gains. This leads to an average £2.3 billion per year reclassification of receipts from CGT to IT from 2027-28.[42]
Table 4.4: SA income tax: changes since October
£billion
Outturn
Forecast
2023-24
2024-25
2025-26
2026-27
2027-28
2028-29
2029-30
October 2024 forecast
42.7
53.2
56.5
65.5
69.7
74.1
78.3
March 2025 forecast
42.7
49.7
53.3
61.9
68.4
72.0
76.2
Difference
0.0
-3.5
-3.2
-3.5
-1.2
-2.0
-2.1
of which:
Forecast changes to self-assessed income
-0.2
-0.5
-0.8
-0.9
-0.9
-0.9
Inclusion of carried interest receipts(1)
0.0
0.0
0.0
2.5
2.1
2.3
Calibration to 2024-25 outturn
-3.1
-2.6
-2.9
-3.0
-3.2
-3.3
Other changes
-0.2
-0.1
0.0
0.1
0.1
0.1
Direct effect of Government decisions
0.0
0.1
0.2
0.1
0.1
0.4
Indirect effects of Government decisions
0.0
0.0
0.0
-0.1
-0.4
-0.7
1) Carried interest figures are slightly different from Table 4.5 due to the different payment profiles for SA IT and CGT.
Source: ONS, OBR
VAT
4.15 VAT receipts are forecast to raise £171.3 billion in 2024-25 (6.0 per cent of GDP), a 1.4 per cent increase from 2023-24.[43] This relatively low growth is due to a lower share of consumption on goods receiving the standard rate of VAT than was the case in 2023-24. Receipts are then forecast to rise to £211.1 billion by 2029-30 (6.1 per cent of GDP). This modest rise as a share of GDP over the forecast is a result of the policies in this Spring Statement and in the Autumn 2024 Budget to charge VAT on private school fees and reduce non-compliance. Otherwise, VAT receipts broadly grow in line with nominal consumption.
4.16 Relative to the October forecast, receipts are £0.1 billion higher in 2024-25, and then lower by an average of £2.0 billion over the rest of the forecast period. This is due to lower forecast nominal consumption growth over this period, and a lower forecast proportion of spending on goods that pay the standard rate of VAT, mostly due to higher forecast rent, electricity, and gas prices crowding out standard-rated consumption.
Onshore corporation tax
4.17 Onshore corporation tax is expected to raise £92.7 billion (3.2 per cent of GDP) in 2024-25, an increase of 5.5 per cent from 2023-24. This increase is mainly driven by companies being subject to a full year of the higher 25 per cent rate of corporation tax. It is then forecast to rise to £115.8 billion (3.3 per cent of GDP) by 2029-30, as from 2026-27 onwards profits recover from their recent weakness and grow slightly faster than GDP.
4.18 Relative to October, onshore corporation tax is expected to be £4.6 billion lower each year across the forecast. We now expect that 2024-25 receipts will be £5.5 billion (5.6 per cent) below the October forecast. This is due to weaker profits in 2024-25 than expected in October, in part due to persistent earnings growth squeezing profits, and higher-than-anticipated inflation and interest costs for small companies in 2023-24, which pay on a one-year lag (discussed further in Box 4.1).
4.19 Onshore corporation tax is expected to stabilise at around 3.3 per cent of GDP over the forecast period, a significant increase from 2.2 per cent of GDP in 2019-20 prior to the pandemic. As shown in Chart 4.4, in 2021-22 and 2022-23, onshore corporation tax receipts rose faster than could be explained by profits and policy changes, implying a rising effective tax rate on profits. This was likely due to the strong performance of sectors with high effective tax rates on their profits such as the financial, retail, and professional services sectors after the pandemic. However, the reverse is true in 2023-24 where growth is driven by profits and the introduction of the 25 per cent corporation tax rate from April 2023, while the effective tax rate falls. Around two-thirds of this weakness is from small companies, discussed further in Box 4.1. The remaining one-third comes from the financial sector, as our models appear to have over-estimated the increased income in the financial sector arising from higher interest rates. The year-on-year growth in 2024-25 can be mostly explained by companies paying a full year of the higher 25 per cent rate of corporation tax, with only a very small contribution from profits and the effective tax rate remaining stable.
Chart 4.4: Growth in corporation tax receipts by source
Oil and gas receipts
4.20 Offshore corporation tax, petroleum revenue tax (PRT), and the energy profits levy (EPL) are expected to raise £4.2 billion (0.1 per cent of GDP) in 2024-25, a 21.9 per cent decrease from 2023-24. This is due to the decline in oil and gas receipts as prices return to historic norms following the sharp rise in 2022-23. Receipts are then forecast to decline to £2.3 billion (0.1 per cent of GDP) in 2029-30 primarily due to the expected continued fall in oil and gas production.
4.21 Relative to the October forecast, oil and gas receipts are £0.3 billion lower this year, but an average of £0.3 billion higher over the rest of the forecast. These changes reflect higher oil and gas prices and increased production, partially offset by upward revisions to capital expenditure (which reduce the forecast).
4.22 The increased expenditure and production forecasts mostly reverse the decreases applied at the October forecast, which were on the basis of policy announcements and other uncertainties around the licensing regime and ongoing legal cases at that time. In the October 2024 Budget, a series of changes were announced to extend the EPL for another year to 2029-30, increase its rate by 3 percentage points, and remove the investment allowance for all expenditure except that related to decarbonisation, as well as lower the rate of the decarbonisation allowance from 80 per cent to 66 per cent. Since October, outturn data and external projections have indicated greater strength than anticipated for production and expenditure, offering some early evidence that we over-estimated the response of expenditure and production to these changes. There is a risk that some of the increased expenditure represents a potential forestalling impact in response to announced policy changes, though there is uncertainty regarding the extent of this response.
Fuel duties
4.23 Fuel duty is expected to raise £24.4 billion (0.8 per cent of GDP) in 2024-25, a 1.8 per cent decrease from 2023-24. This is primarily due to weaker diesel receipts due to falling diesel car sales. Receipts are forecast to remain relatively flat next year as a result of the extension of the 5p cut and the freezing of duty rates announced at the October 2024 Budget. Receipts are then forecast to increase by £2.6 billion (10.6 per cent) in 2026-27, on the assumption that the reversal of the 5p cut is implemented and duty rates are uprated with RPI. Receipts are forecast to peak at £27.3 billion in 2027-28 before falling by £0.4 billion by 2029-30, reflecting the inflection point where the assumed increase in fuel duty rates is outweighed by the rising electric vehicle (EV) share.
4.24 This forecast assumes that the government reverses the 5p fuel duty cut and uprates duties with RPI. In practice, fuel duty rates have not been increased since 2011-12. If the duty rate were to remain unchanged at its current level throughout the forecast period it would reduce receipts, on average, by £3.8 billion between 2026-27 and 2029-30.
4.25 Relative to October, receipts are relatively unchanged this year, and an average of £0.1 billion a year lower over the rest of the forecast. This is driven by a fall in the car mileage forecast in line with lower real consumption.
Capital taxes
4.26Capital gains tax is forecast to raise £13.3 billion in 2024-25 (0.5 per cent of GDP), an 8.5 per cent decrease from 2023-24. This is likely due to continued unwinding of high gains realised during 2020-21 and 2021-22. Receipts are forecast to increase sharply to £19.7 billion in 2025-26 as tax is paid on gains forestalled ahead of the Autumn 2024 Budget. Receipts are then forecast to rise to £25.5 billion in 2029-30 (0.7 per cent of GDP), largely driven by rising equity prices. We assume that CGT receipts will rise as a share of GDP based on past trends and as wealth increases across generations as individuals accumulate financial and property assets. We will keep this assumption under review given recent downwards surprises in outturn, and will further assess evidence on these cohort effects.
4.27 Relative to the October forecast, receipts are £2.4 billion lower in 2024-25 and an average of £4.1 billion a year lower over the remainder of the forecast. We expect the 2024-25 shortfall to taper away in future years and for CGT to return to the long-run trend described above and discussed further in Box 4.1. By the end of the forecast, the shortfall is driven by updated data on the composition of liabilities, as well as the reclassification of roughly £2 billion in carried interest receipts to income tax from 2027-28 onwards. This more than offsets the impact of slightly higher equity prices than forecast in October 2024, which adds around £0.4 billion by the end of the forecast.
Table 4.5: Capital gains tax: changes since October
£ billion
Outturn
Forecast
2023-24
2024-25
2025-26
2026-27
2027-28
2028-29
2029-30
October 2024 forecast
14.5
15.7
22.6
22.0
24.8
28.1
31.0
March 2025 forecast
14.5
13.3
19.7
19.4
20.2
23.1
25.5
Difference
0.0
-2.4
-2.8
-2.6
-4.6
-5.1
-5.5
of which:
2023-24 liabilities data(1)
-1.7
-2.3
-2.6
-2.8
-3.2
-3.6
Equity prices and property
0.0
0.0
0.2
0.2
0.2
0.3
Reclassification of carried interest(2)
0.0
0.0
0.0
-1.8
-2.1
-2.3
Other modelling changes
-0.7
-0.5
-0.2
-0.1
0.0
0.1
1) Also includes a small amount of residential property liabilities from 2024-25.
2) Carried interest figures are slightly different from Table 4.4 due to the different payment profiles for SA IT and CGT.
Source: ONS, OBR
4.28Property transaction taxes are forecast to raise £15.0 billion in 2024-25, a 17.1 per cent increase from 2023-24. This rise reflects a recovery in the housing market as well as increased activity expected ahead of the decrease in nil-rate stamp duty (SDLT) thresholds in April 2025. Transactions are then forecast to rise steadily, with receipts reaching £26.5 billion in 2029-30.
4.29 Relative to the October forecast, before the impact of policy, receipts are £0.9 billion higher this year, but unchanged on average over the rest of the forecast. The planning reforms announced by the Government are expected to increase completions by an average of 40,000 per year from 2026-27, and transactions by an average of 3 per cent per year, as discussed further in Chapter 3. This raises SDLT receipts in 2029-30 by £1.1 billion relative to the pre-measures baseline.
4.30Inheritance tax (IHT) receipts are forecast to raise £8.4 billion in 2024-25, a 11.6 per cent increase on 2023-24 largely driven by higher asset prices in the second half of 2024, combined with frozen tax-free thresholds. Receipts are then forecast to rise to £14.3 billion in 2029-30, with around £2.5 billion of the rise in 2029-30 due to the policies announced in October 2024.
4.31 Relative to the October forecast, receipts are £0.1 billion higher in 2024-25 and an average of £0.5 billion a year higher over the rest of the forecast. Changes are largely driven by higher in-year outturn, with higher cash deposits and property prices helping to offset fewer projected deaths over the forecast.
Other receipts
4.32Air passenger duty (APD) receipts are expected to raise £4.2 billion in 2024-25, an 8.5 per cent increase from 2023-24. This is due to a continued increase in passenger numbers. Receipts are forecast to increase to £6.5 billion in 2029-30, driven by increasing passenger numbers and higher duty rates. Receipts are broadly unchanged relative to October.
4.33Vehicle excise duty (VED) receipts are expected to raise £8.2 billion in 2024-25, a 6.4 per cent increase from 2023-24 due to higher vehicle numbers and the increase in duty rates in line with RPI. Receipts are forecast to increase to £11.1 billion in 2029-30, driven by more cars paying the Expensive Car Supplement and the extension of VED to EVs from 2025. Relative to October, receipts are £0.1 billion lower on average per year due to a decline in the new car sales forecast.
4.34Tobacco duty receipts are expected to raise £8.1 billion in 2024-25, a 9.5 per cent decline relative to 2023-24 as consumption continues to fall sharply, in part due to the substitution from tobacco products towards vaping. Receipts are forecast to remain broadly steady in cash terms over the forecast period, raising £8.0 billion in 2029-30, as falling consumption offsets above-RPI duty rate increases. The forecast is £0.5 billion lower each year than it was in October, due to lower-than-anticipated in-year receipts being pushed through to future years.
4.35Alcohol duty receipts are expected to raise £12.4 billion in 2024-25, a 0.8 per cent decline relative to 2023-24. Receipts are then anticipated to increase to £15.7 billion by 2029-30, an average rise of 4.8 per cent each year due to assumed increases in alcohol duties and rising consumption. The forecast is £0.2 billion lower each year relative to October due to lower forecast consumption growth.
4.36Emissions trading scheme (ETS) receipts are expected to raise £3.5 billion in 2024-25, a 42.4 per cent decrease compared to 2023-24. This is due to a fall in carbon prices resulting from a lower average clearing price at auction. Receipts are forecast to decline to £1.7 billion in 2029-30 as the number of allowances auctioned declines. Relative to the October forecast, receipts are an average of £0.1 billion higher due to an increase in forecast carbon prices.
4.37Electricity generator levy (EGL) receipts are expected to raise £1.0 billion this year, a 16.2 per cent decrease compared to 2023-24. Based on current expected prices, the EGL raises tax for an extra year compared to the October forecast – until the end of 2026 – as this is when forecast wholesale electricity spot prices now drop below the benchmark price. Higher prices mean the forecast has been revised upwards by £0.4 billion in 2025-26 and £0.1 billion in 2026-27 relative to October.
4.38 Receipts from environmental levies are expected to be £11.9 billion in 2024-25 and then forecast to rise to £14.8 billion in 2029-30, due to increased electricity generation in the Contracts for Difference (CfD) forecast and an increase in recent auction prices in the capacity markets forecast. Relative to the October forecast, receipts are broadly unchanged this year, and an average of £0.2 billion a year lower over the rest of the forecast. This is mainly driven by the CfD scheme, where higher wholesale electricity prices decrease the forecast level of subsidy, which is recouped by a levy on consumer bills. We have also incorporated the January announcement on the extension of subsidies for biomass electricity generation at the Drax power station, which adds around £0.5 billion a year to the CfD scheme from 2027-28. Most of these schemes are fully offset in spending and so are neutral for public sector net borrowing.
4.39VAT refunds are forecast to raise £29.2 billion in 2024-25, a 3.9 per cent increase from 2023-24. They then grow over the forecast in line with government consumption, reaching £34.9 billion by 2029-30. Relative to October, receipts are £1.2 billion lower this year, and £1.1 billion a year lower on average over the rest of the forecast. This is driven by lower-than-anticipated in-year receipts. VAT refunds are offset in spending and so are neutral for borrowing.
4.40Interest and dividend receipts are forecast to raise £43.5 billion in 2024-25, a 0.7 per cent decrease from 2023-24 as Bank Rate subsides. Receipts then fall next year before increasing every year thereafter to reach £46.5 billion in 2029-30. In recent years the return on interest-rate-sensitive elements such as the Government’s bank deposits and foreign exchange reserves has risen, while the accrued interest on student loans has been boosted by high RPI inflation. Relative to October, receipts are £0.4 billion higher in 2024-25 and £1.0 billion a year higher over the rest of the forecast. This largely reflects a higher path for Bank Rate in every year, and stronger cumulative equity price growth increasing the return on funded pensions.
4.41Council tax is forecast to raise £47.7 billion in 2024-25, a 7.1 per cent increase on 2023-24. Normally, councils cannot raise council tax rates by more than 5 per cent without a referendum, however in 2025-26 the Government has allowed an additional six local authorities to raise rates by more than this without referendums, alongside increasing the threshold for referenda for authorities with Police and Crime Commissioners and Fire and Rescue Authorities. Receipts are forecast to rise to £61.5 billion by 2029-30. Relative to October, receipts are £0.3 billion higher on average across the forecast. Pressures on local authority spending that could lead to further flexibilities being granted to councils and higher than forecast council tax receipts are discussed in paragraphs 5.37-5.38.
4.42Business rates are forecast to raise £31.8 billion in 2024-25, an 8.5 per cent increase on 2023-24 driven mainly by higher CPI inflation which was used to increase the standard ‘multiplier’ applied to a building’s rateable value. A reduction in the generosity of tax reliefs boosts business rates in 2025-26 and 2026-27. In particular, relief to the retail, hospitality and leisure (RHL) sectors is less generous in 2025-26 and is then assumed to be zero thereafter. The October 2024 Budget said that the Government intends to introduce permanently lower multipliers for RHL properties paid for by a higher multiplier on properties with very high rateable values. We have not included this in the forecast in the absence of policy details. Business rates are then forecast to rise broadly in line with CPI inflation to £39.2 billion in 2029-30. Relative to October, receipts are £0.3 billion lower in 2024-25, and an average of £0.5 billion a year lower over the rest of the forecast.
4.43Gross operating surplus (GOS) is the sum of public sector depreciation and public corporations’ trading surplus. It is forecast to be £79.3 billion in 2024-25, which is a 4.5 per cent increase compared to 2023-24. This is due to an increase in both depreciation and public corporations’ trading surplus. GOS is forecast to rise to £94.4 billion in 2029-30, driven by growth in the stock of public sector capital which raises depreciation. Relative to the October forecast, receipts are £1.2 billion higher this year, and an average of £2.2 billion higher over the forecast. This reflects upwards outturn revisions for public corporations’ trading surplus, mainly driven by higher outturn in the Housing Revenue Account pushing through the forecast. Public sector depreciation is offset in spending, and so is neutral for borrowing.
4.44Home Office fees are forecast to raise £5.8 billion in 2024-25, a 26.7 per cent increase on 2023-24. This is driven by 2024-25 being the first full year that is subject to the increase in the immigration health surcharge and a range of visa fees that took place in the second half of 2023-24. Receipts are expected to remain at £5.8 billion in 2025-26 as a result of the additional increase to visa fees announced at this Spring Statement before falling back to £5.7 billion by 2029-30 due to lower gross migration. Relative to October, receipts are £0.9 billion higher on average over the forecast due to the impact of policy changes and the increase in outturn receipts relative to gross migration. The Government has told us that all the additional revenue generated from the latest increase in visa fees will go towards departmental spending, and we have therefore added an offsetting amount to our spending forecast.
Chapter 5: Public sector expenditure
Summary of the expenditure forecast
5.1 From a post-war peak of 53 per cent of GDP during the pandemic in 2020-21, total public spending fell as a share of the economy to 44.7 per cent in 2023-24 (Chart 5.1). Spending is forecast to decline again by 0.3 per cent of GDP in 2024-25 as falls in debt interest and other elements of annually managed expenditure (AME) more than offset growth in departmental expenditure limits (DELs). In 2025-26, total spending is forecast to rise to 45.0 per cent of GDP due to further rises in departmental spending as a share of GDP. Overall spending is then forecast to decline gradually from 2026-27 onwards as a share of GDP as a result of declining departmental spending, welfare, and other elements of AME. By 2029-30 spending is still forecast to be 4.2 per cent of GDP higher than on the eve of the pandemic in 2019-20.
5.2 As shown in Table 5.1, the overall decline in total public spending of 1.1 per cent of GDP over the forecast period is the result of:
Departmental expenditure limits rising as a share of GDP from 18.9 per cent in 2023-24 to a peak of 19.9 per cent in 2026-27, and then falling back to 19.4 per cent in 2029-30. There is a frontloaded profile of expenditure both for resource departmental spending, which as a share of GDP increases this year and next year and then declines gradually from 2026-27 onwards, and for capital departmental spending, which increases as a share of GDP until 2027-28 before declining slightly thereafter.
Annually managed expenditure being forecast to fall from 25.8 per cent of GDP in 2023-24 to 24.5 per cent of GDP in 2029-30. In 2024-25, AME is forecast to fall by 0.6 percentage points to 25.2 per cent of GDP, mainly due to lower debt interest costs, reflecting falling inflation, and the end of payments related to the EU financial settlement. AME then remains broadly flat in 2025-26 before being forecast to fall gradually over the rest of the period, primarily due to falls in welfare, and smaller elements of AME including unfunded pensions and student loans.
5.3 Relative to the October 2024 forecast (restated for Blue Book 2024 nominal GDP revisions),[44] spending is forecast to be 0.2 per cent of GDP higher in 2029-30. Before the impact of policy measures announced since the October 2024 forecast there was a 0.4 per cent of GDP increase to the spending forecast, primarily because of higher interest rates and inflation increasing debt interest spending. The direct and indirect effects of policy measures in this forecast reduce spending by 0.2 per cent of GDP in 2029-30, mainly driven by a £4.8 billion reduction in welfare spending as a result of policy. This leaves spending as a share of GDP at the forecast horizon slightly higher than the restated October 2024 forecast, and 1.6 per cent of GDP higher than the previous Government’s plans for public spending as set out in the Spring 2024 forecast.
Chart 5.1: Public spending as a share of GDP
5.4 The spending-to-GDP ratio in 2024-25 is estimated to be 4.8 percentage points higher than the pre-pandemic level in 2019-20, and by 2029-30, it is forecast to be 4.2 per cent of GDP above this pre-pandemic level. The composition of spending will also have shifted substantially over the 20-year period from 2010-11 to 2029-30 (Chart 5.2):
2010-11 to 2019-20: Over this period spending fell by 6.1 per cent of GDP, driven by policy decisions to reduce day-to-day departmental spending (RDEL) by 3.4 per cent of GDP, and falls in welfare spending of 1.8 per cent of GDP which reflected both policy changes and the economic recovery from the financial crisis.
2019-20 to 2024-25: In the wake of the pandemic, spending spiked upward in 2020-21 to 13.4 per cent of GDP above 2019-20 levels, driven by higher departmental and welfare spending and the introduction of temporary Covid-related income support schemes and loan guarantees. By 2024-25, RDEL and welfare fell back closer to their pre-pandemic levels. However, capital departmental spending (CDEL) remains around 0.8 per cent of GDP above 2019-20 levels, and debt interest costs are 1.9 per cent above 2019-20 levels.
2024-25 to 2029-30: We forecast a 0.6 per cent of GDP fall in spending from this year to 2029-30, which reflects a decline in welfare spending and other smaller elements of AME including unfunded pensions and student loans. Over this period departmental spending is forecast to increase slightly as share of GDP, following the path described above where it increases initially before declining gradually in the medium term.
Table 5.1: Total managed expenditure as a share of GDP
Per cent of GDP
Outturn
Forecast
2023-24
2024-25
2025-26
2026-27
2027-28
2028-29
2029-30
Total managed expenditure
44.7
44.4
45.0
44.8
44.4
44.1
43.9
of which:
Departmental expenditure limits
18.9
19.2
19.8
19.9
19.8
19.6
19.4
of which:
Resource DEL
15.4
15.7
16.1
16.1
15.9
15.8
15.7
Capital DEL
3.5
3.6
3.7
3.8
3.9
3.8
3.7
Annually managed expenditure
25.8
25.2
25.2
24.9
24.6
24.5
24.5
of which:
Welfare
10.8
10.9
10.9
11.0
10.8
10.7
10.8
Debt interest, net of APF
3.9
3.7
3.7
3.6
3.7
3.7
3.8
Locally financed current expenditure
2.3
2.3
2.3
2.3
2.3
2.3
2.3
Scottish Government’s current expenditure
1.6
1.6
1.6
1.6
1.6
1.6
1.5
Capital AME
1.1
1.2
1.2
1.1
1.0
1.0
1.0
EU financial settlement
0.3
0.0
0.0
0.0
0.0
0.0
0.0
Student loans
0.4
0.3
0.3
0.3
0.2
0.2
0.2
Unfunded public service pensions
0.2
0.1
0.0
0.0
0.0
-0.1
-0.1
Other AME
5.4
5.1
5.2
5.1
5.0
5.0
4.9
Note: Total managed expenditure can be divided into two components of roughly equal size: departmental expenditure limits (DELs) mostly cover spending on public services, grants and administration (‘resource’ spending), and investment (‘capital’ spending). These items can be planned over multiple years. Annually managed expenditure (AME) covers items less amenable to multi-year planning.
Source: ONS, OBR
Chart 5.2: Spending as a share of GDP by category
5.5 Chart 5.3 shows the contribution of Government policy decisions to the forecast increase in public spending of 4.2 per cent of GDP from 39.6 per cent in 2019-20 to 43.9 per cent in 2029-30:
All else equal, the spending plans in place in the pre-pandemic Budget in March 2020 would have resulted in the spending-to-GDP ratio falling by 0.8 per cent of GDP over this period.
Underlying forecast revisions raise spending by 2.2 per cent of GDP relative to pre-pandemic expectations. This is driven mainly by higher debt interest spending – due to upward revisions to the amount of debt and the cost of servicing it – and to welfare spending – due to higher inflation and higher health-related caseloads.
Discretionary spending measures announced by previous governments would have raised the spending-to-GDP ratio by 0.8 percentage points, reflecting net increases to RDEL and CDEL spending.
Discretionary spending measures announced by thecurrent Government raise spending by a further 2.0 per cent of GDP in 2029-30, with higher RDEL and CDEL being slightly offset by lower welfare spending.
Chart 5.3: The rise in the spend-to-GDP ratio from 2019-20 to 2029-30
Changes in spending since the October 2024 forecast
5.6 Relative to the October forecast, spending in cash terms has been revised up in each year of the forecast (Table 5.2):
The principal difference in the pre-measures forecast is the rise in debt interest spending caused by higher RPI, gilt rates, and Bank Rate, which by 2029-30 accounts for £10.1 billion of the total £12.5 billion increase in pre-measures forecast spending (including PSNB-neutral increases).
Policies announced since the Autumn 2024 Budget increase spending by an average of £2.2 billion over the next three years but then reduce spending by £4.0 billion by 2029-30. This is mainly driven by welfare measures, which are provisionally estimated to reduce spending by £4.8 billion in 2029-30.[45] These are partly offset by net increases in departmental spending of £0.7 billion by 2029-30. These consist of increases in capital departmental spending after 2025-26, which reach £4.4 billion by 2029-30, and frontloaded increases in RDEL of £1.1 billion on average over the next three years followed by a reduction in the RDEL envelope of £3.6 billion in 2029-30.[46]
The indirect effects of the policy package leave spending largely unchanged over the forecast period, increasing it by just £0.1 billion in 2029-30, as increases in local authority spending, funded by higher council tax and community infrastructure levy revenues as a result of the Government’s planning measures, more than offset small savings from lower debt interest.
Table 5.2: Total managed expenditure: changes since October
£ billion
Outturn
Forecast
2023-24
2024-25
2025-26
2026-27
2027-28
2028-29
2029-30
October 2024 forecast
1,223
1,276
1,335
1,379
1,418
1,462
1,510
March 2025 forecast
1,230
1,279
1,347
1,389
1,431
1,471
1,519
Difference
7.3
2.4
12.1
10.5
12.7
9.8
8.6
By policy and forecast differences
of which:
Underlying forecast differences(1)
7.3
2.7
9.6
7.3
8.5
8.7
11.4
PSNB-neutral forecast differences(2)
-1.7
1.0
1.2
2.1
1.7
1.1
Direct effect of Government decisions
0.9
2.0
2.3
2.2
-0.8
-4.0
Indirect effect of Government decisions
0.5
-0.5
-0.3
-0.2
0.0
0.1
By spending category
of which:
Resource DEL
0.0
-2.6
2.4
3.3
2.3
0.5
-1.9
Capital DEL
0.0
3.9
0.0
0.8
3.4
3.9
4.4
Debt interest
0.0
0.3
5.5
3.2
4.9
6.3
9.4
Welfare spending
0.1
-0.5
-1.4
1.6
-0.7
-2.9
-4.3
Other spending
6.9
3.0
4.3
0.0
-0.1
-0.8
-1.4
PSNB neutral spending
0.2
-1.7
1.3
1.6
2.9
2.8
2.3
Memo: difference in spending ex PSNB-neutral
7.0
4.0
10.8
8.8
9.8
7.0
6.2
1) Excludes PSNB-neutral forecast changes.
2) Includes depreciation, VAT refunds, most environmental levies, extended producer responsibility, community infrastructure levy, and council tax.
Source: ONS, OBR
Analysis of spending by category
Spending within departmental expenditure limits
5.7 Spending subject to departmental expenditure limits makes up a little over 40 per cent of all public spending and is divided into a set of nominal limits for each of 19 government departments in periodic spending reviews. In this section, ‘RDEL spending’ refers to departmental resource, or day-to-day, spending, and ‘CDEL spending’ refers to departmental capital, or investment, spending.[47] The latest forecast reflects departments’ detailed plans for 2024-25 and 2025-26, as of the February 2025 supplementary estimates, and the Government’s spending assumptions for 2026-27 and beyond. The latter entails two overall spending totals (one for total resource DEL and one for total capital DEL) but provides no detailed plans for how these are to be divided between each government department – these will be set in the Government’s planned 2025 Spending Review due to conclude this summer.
Chart 5.4: Real departmental resource and capital spending
5.8 Compared to the October forecast, total departmental spending is an average of £3.8 billion (0.6 per cent) a year higher over the forecast period. Chart 5.4 and Table 5.3 show the composition of these changes across RDEL and CDEL, and their impacts on the path of real spending over the forecast:
RDEL spending this year is lower than the October forecast by £2.6 billion but higher in every other year aside from 2029-30. RDEL spending over the forecast is now more frontloaded, with upward revisions of £2.4 billion in 2025-26 and £3.3 billion in 2026-27, but £1.9 billion lower in 2029-30. RDEL now grows in real terms by 2.7 per cent this year, 4.0 per cent next year, and then by an average of 1.2 per cent in the years thereafter. Overall average real growth over the forecast is now 1.8 per cent a year, compared to 1.7 per cent a year in the October forecast.
CDEL spending is £3.9 billion higher than the October forecast this year and an average of £2.5 billion higher in the five years thereafter. CDEL spending grows strongly in real terms next year by 5.4 per cent, and then by 4.3 per cent in 2026-27 and 3.1 per cent in 2027-28 as the Government cuts Official Development Assistance (ODA) spending to finance additional capital-heavy defence spending in order to hit the 2.5 per cent of GDP target on defence spending.[48] Real CDEL spending then decreases by an average 0.8 per cent per year in the remaining two years of the forecast. Overall annual real growth over the forecast is now 2.2 per cent, compared to average annual real growth of 2.3 per cent in the October forecast.
Table 5.3: Departmental total spending: changes since October
£ billion, unless otherwise stated
Outturn
Forecast
2023-24
2024-25
2025-26
2026-27
2027-28
2028-29
2029-30
October 2024 forecast
Total DEL spending
519.3
552.4
589.8
611.9
631.7
649.2
668.2
TDEL real growth rate (per cent)
-1.7
3.9
4.3
1.7
1.2
0.8
0.9
of which:
RDEL spending
422.7
453.4
478.6
494.7
511.0
527.8
545.6
RDEL real growth rate (per cent)
-2.4
4.8
3.1
1.4
1.3
1.3
1.4
CDEL spending
96.6
99.0
111.3
117.2
120.7
121.4
122.6
CDEL real growth rate (per cent)
1.2
0.1
9.8
3.3
1.0
-1.3
-1.0
March 2025 forecast
Total DEL spending
519.3
553.6
592.3
616.0
637.3
653.6
670.6
TDEL real growth rate (per cent)
-1.6
2.7
4.2
2.3
1.4
0.6
0.7
of which:
RDEL spending
422.7
450.7
481.0
498.0
513.3
528.3
543.7
RDEL real growth rate (per cent)
-2.3
2.7
4.0
1.9
1.0
1.0
1.0
CDEL spending
96.6
102.9
111.3
118.0
124.1
125.3
126.9
CDEL real growth rate (per cent)
1.4
2.6
5.4
4.3
3.1
-0.9
-0.6
Difference
Total DEL spending
0.0
1.2
2.4
4.1
5.7
4.4
2.5
By spending category
of which:
RDEL spending
0.0
-2.6
2.4
3.3
2.3
0.5
-1.9
CDEL spending
0.0
3.9
0.0
0.8
3.4
3.9
4.4
Source: HM Treasury, OBR
5.9 The following sections assess the path of departmental spending in the years in which department allocations are set (2024-25 and 2025-26), and in the later years of the forecast, in more detail. This includes allocation across departments and economic categories, pressures and risks on these allocations and the Treasury’s central reserve, and our judgements on the level of likely over or underspending against the limits set by the Treasury.
Departmental spending allocations in 2024-25 and 2025-26
RDEL spending
5.10 RDEL in 2024-25 is now estimated to be £450.7 billion, £2.6 billion lower than in the October forecast, following a small decrease of £0.9 billion at February supplementary estimates,[49] and a £1.8 billion increase to the underspend assumption. As shown in Chart 5.5, there has been £1.5 billion in additional claims on the reserve since October (of which around four-fifths relate to Department for Health and Social Care (DHSC) and the Ministry of Defence (MoD)), but these were more than accommodated by allocations of the Treasury’s central reserve and by the ‘surrenders’ (or remittances) of underspends by departments (including from the Home Office, MoD and the Department for Business and Trade (DBT)) back to the Treasury. The three main in-year spending pressures we discussed in the October 2024 Economic and fiscal outlook (EFO), from NHS winter demand, asylum, and rail passenger numbers, have been accommodated within the RDEL envelope.
Chart 5.5: Change in RDEL spending in 2024-25 compared to October
5.11 Looking at the pace of budget execution, by the ninth month of the current financial year, in total departments had spent £337.8 billion, which is 74 per cent of the full-year RDEL control total. This is very close to the long-run ninth-month average of 75 per cent. Reflecting this normal pattern of spending in the in-year position and the accommodation of pressures within the DEL envelope shown above, we have assumed a small underspend of £5.7 billion against the Treasury’s final 2024-25 RDEL limit (up from our £3.9 billion assumption in October), equivalent to 1.2 per cent of the current forecast for in-year RDEL.
5.12 Total RDEL in 2025-26 is now estimated to be £2.4 billion higher than in the October forecast. This reflects a £1.5 billion increase to account for the reclassification of revenues from the extended producer responsibility (EPR) levy and £0.9 billion worth of additional DEL funding for specific policy measures including tax compliance and the Government’s ‘transformation fund’.[50] The EPR levy will come into effect from April 2025 and will require producers to pay a fee for the packaging they supply or import into the UK market (see paragraph 3.54 in Chapter 3 for more details). EPR revenues had previously been classified as a fee within spending but are now classified as a tax receipt. This reclassification increases DEL spending by £1.5 billion in 2025-26, and an average of £1.7 billion a year between 2026-27 and 2029-30.
5.13 The main change in the 2025-26 departmental allocations compared to the October 2024 forecast reflects the Treasury allocating the £4.7 billion of compensation for the rise in employer NICs for the public sector between departments, where it had previously been accounted for as a separate spending line. The Treasury has also allocated £0.7 billion of the 2025-26 reserve,[51] of which £0.4 billion is for defence and £0.2 billion for local government (within the Ministry of Housing, Communities and Local Government (MHCLG)). On the Treasury’s control total definition of RDEL, the specific 2025-26 departmental allocations are now slightly higher than in October 2024.
Table 5.4: RDEL spending totals by department
£ billion
Per cent
Outturn
Forecast
Real annual growth
2023-24
2024-25
2025-26
2024-25
2025-26
Ave. 2023-24 to 2025-26
Health and Social Care
177.9
193.3
202.0
4.7
1.8
3.5
of which:
NHS England
171.0
183.6
193.4
5.2
3.2
4.2
Education
81.8
89.2
94.1
5.1
2.8
4.0
of which:
Core schools
57.7
61.6
64.8
2.8
2.6
2.7
Home Office
19.0
18.4
20.8
-6.5
3.3
-1.7
Justice
10.4
11.2
11.9
3.1
3.5
3.3
Law Officers’ Departments
0.8
0.9
1.0
4.9
9.8
7.3
Defence
34.8
37.6
39.0
4.2
1.0
2.6
Single Intelligence Account
2.8
3.1
3.1
5.9
-3.7
1.0
FCDO: Foreign Office
7.7
8.3
8.3
4.4
-3.0
0.6
MHCLG: Local Government
9.6
11.4
15.0
12.1
15.7
13.9
MHCLG: Housing and Communities
3.3
4.3
3.8
26.0
-12.0
5.3
Culture, Media and Sport
1.5
1.6
1.5
3.1
-8.7
-3.0
Science, Innovation and Technology
0.3
0.6
0.4
93.3
-30.4
16.0
Transport
7.9
8.3
8.3
1.0
-2.4
-0.7
Energy Security and Net Zero
1.3
1.6
1.9
18.7
18.3
18.5
Environment, Food and Rural Affairs
4.7
5.0
4.8
1.8
-6.5
-2.4
Business and Trade
1.6
1.7
1.8
1.4
2.8
2.1
Work and Pensions
8.4
9.1
10.2
4.8
9.2
7.0
HM Revenue and Customs
6.0
5.2
5.9
-16.0
10.7
-3.6
HM Treasury
0.4
0.4
0.4
-3.7
3.7
-0.1
Cabinet Office
0.9
0.7
0.8
-27.0
19.0
-6.8
Scotland
37.4
39.9
41.5
2.7
1.5
2.1
Wales
16.4
17.2
17.9
1.1
1.5
1.3
Northern Ireland
14.8
15.7
16.2
1.9
1.1
1.5
Small and independent bodies
2.4
2.8
2.8
15.2
-3.2
5.6
Reform and innovation fund
0.0
0.0
0.2
–
–
–
Transformation fund
0.0
0.0
0.3
–
–
–
Reserves
0.0
0.0
3.4
–
–
–
Total RDEL spending
452.2
487.5
517.5
3.9
3.4
3.6
Note: This table shows the Treasury’s measure of RDEL, including non-PSCE RDEL but excluding any assumptions about underspending. This table does not incorporate the announced 2025-26 reduction in ODA spending, for which the departmental allocation has not been agreed. The October 2024 version of this table excluded one-off items when calculating the annual growth rates. These adjustments have mostly been excluded and these figures should not be directly compared to the October 2024 figures. We continue to make three adjustments:
1) Removing the business rates pilots from 2023-24 MHCLG: Local Government DEL outturn as these move from DEL to AME in-year (LASFE). 2) Budget cover transfers between DHSC and Home Office to cover the Immigration Health Surcharge have been removed from the growth calculations. 3. Transfers from the DHSC to NHS health bodies have been removed from the growth rate calculation.
Source: HM Treasury, OBR
5.14 The RDEL reserve for 2025-26 is now £3.2 billion, £0.9 billion lower than in the October forecast. This decrease reflects the allocation of £0.7 billion to fund reserve pressures, and budget exchanges of £0.2 billion – where departments carry forward unspent funds by exchanging them with the reserve – agreed by the Treasury at supplementary estimates. The core level of risks to the RDEL reserve, that is risks for which the Treasury has some conditional agreements with departments, stands at £1.3 billion (40 per cent of the RDEL reserve), a £0.2 billion increase compared to our October forecast. The proportion of the reserve committed ahead of the financial year remains significantly lower than equivalent commitments in each year of the 2021 Spending Review – where at its highest, the reserve was 302 per cent committed (at Spring Budget 2024) and at its lowest was 82 per cent committed (at Spring Statement 2022).[52]
Chart 5.6: Changes to the 2025-26 RDEL reserve and pressures since October
5.15 In light of the modest changes to departmental allocations and pressures the Treasury has agreed to fund from the reserve, we have maintained our assumption of a small underspend of 1.3 per cent against the Treasury’s final 2025-26 RDEL limit.
CDEL spending
5.16 CDEL in 2024-25 is now estimated to be £102.9 billion which is £3.9 billion higher than in the October forecast, principally reflecting a £3.4 billion reduction in our underspend judgement. At February 2025 supplementary estimates, higher reserve claims (including £3.2 billion by the MoD for core training and the purchase of Annington Homes) were partially funded from the reserve. Decreases to spending from net budget exchanges were partially offset by small surrenders,[53] leaving PSGI in CDEL spending £0.4 billion higher after supplementary estimates.
Chart 5.7: Change in CDEL spending in 2024-25 compared to October
5.17 Looking at the pace of budget execution, by the ninth month of the current financial year, departments had spent £68.7 billion (64.7 per cent) of the full-year PSGI in CDEL control total. This is higher than the average PSGI in CDEL spend by the ninth month in the post-pandemic years which is 61.9 per cent, suggesting that departments will underspend by less this year than the recent past.
5.18 Given the stronger trajectory of spending over the year to date, and that CDEL reserves of £2.8 billion were not sufficient to cover the large claim by the MoD, we have reduced our underspend assumption compared to October. We now assume an underspend of £3.3 billion (3.1 per cent) against the Treasury’s final 2024-25 CDEL limit compared to the £6.7 billion (6.4 per cent) assumed in the October forecast.
5.19 Compared to the October forecast, the main differences in departmental allocations reflect the changes to 2024-25 described above and the allocation of £1.8 billion of the CDEL reserve in 2025-26 to the MoD.[54]
Table 5.5: CDEL spending totals by department
£ billion
Per cent
Outturn
Forecast
Real annual growth
2023-24
2024-25
2025-26
2024-25
2025-26
Ave. 2023-24 to 2025-26
Health and Social Care
10.5
11.6
13.6
6.4
13.8
10.0
Education
6.2
5.7
6.8
-10.5
15.6
1.7
Home Office
1.3
1.8
1.5
33.7
-18.5
4.4
Justice
1.5
1.7
2.0
12.0
15.9
13.9
Law Officers’ Departments
0.0
0.1
0.1
–
-26.2
28.4
Defence
19.1
22.7
23.2
14.4
-0.3
6.8
Ukraine: ERA
0.0
0.8
0.8
–
-2.6
–
Single Intelligence Account
1.4
1.4
1.5
-0.2
2.0
0.9
FCDO: Foreign Office
3.4
2.7
3.9
-23.2
39.5
3.5
MHCLG
6.8
8.4
8.8
18.8
1.5
9.8
Culture, Media and Sport
0.5
0.7
0.7
32.0
0.6
15.2
Science, Innovation and Technology
12.4
13.3
14.7
3.4
7.6
5.5
Transport
22.1
20.7
21.8
-10.1
2.7
-3.9
DESNZ
5.1
4.8
8.4
-8.9
69.2
24.2
DESNZ: CCUS and Hydrogen
0.0
0.9
3.7
–
–
–
Environment, Food and Rural Affairs
2.1
2.3
2.7
7.8
15.8
11.7
Business and Trade
1.0
1.5
1.5
50.7
-6.3
18.8
Work and Pensions
0.6
0.6
0.7
-4.7
13.9
4.2
HM Revenue and Customs
0.7
0.7
0.9
-1.3
14.3
6.2
HM Treasury
0.0
0.0
0.1
–
–
–
Cabinet Office
0.4
0.4
0.5
-19.1
46.3
8.7
Scotland
6.0
5.9
6.5
-4.4
7.8
1.5
Wales
3.1
3.2
3.4
-1.3
2.4
0.5
Northern Ireland
2.1
2.0
2.2
-6.4
4.6
-1.0
Small and independent bodies
0.3
0.4
0.4
24.5
-5.1
8.7
Reserves
0.0
0.0
0.9
–
–
–
Total CDEL spending
106.8
114.6
131.3
3.4
11.6
7.4
Note: This table shows HM Treasury’s measure of CDEL, including non-PSGI CDEL but excluding any assumptions about underspending. This table does not incorporate the announced 2025-26 reduction in ODA spending, for which the departmental allocation has not been agreed. The October 2024 version of this table excluded one-off items when calculating the annual growth rates. These adjustments have not been used here and these figures should not be directly compared to the October 2024 figures. As CDEL can vary substantially between years, we do not present growth rates above 100 per cent or below -100 per cent.
Source: HM Treasury, OBR
5.20 The CDEL reserve for 2025-26 is now £0.4 billion, £2.3 billion lower than at the October forecast, reflecting the allocation of £1.8 billion from the CDEL reserve to MoD and the net effect of budget exchanges, where departments carry forward unspent funds by exchanging them with the reserve (of £0.5 billion). The level of risks to the CDEL reserve, that is risks around which the Treasury has some conditional agreements with departments, stands at £2.1 billion, broadly unchanged compared to the time of the October forecast due to a funding agreement for the £1.8 billion of new MoD risks.
Chart 5.8: Changes to the 2025-26 CDEL reserve and pressures since October
5.21 CDEL is set to increase next year by a substantial 5.4 per cent real growth rate. Evidence from previous years when there have been significant increases in CDEL suggests departments will underspend against plans. We have therefore maintained our underspend assumption unchanged at 8.0 per cent from the October forecast.
Departmental spending after 2025-26
5.22 For the years after 2025-26, the Government has not allocated DEL budgets to departments. RDEL allocations for the three years from 2026-27 to 2028-29 and CDEL allocations for the four years from 2026-27 to 2029-30 will be set at the conclusion of the Spending Review in June 2025. The RDEL envelope will remain unallocated for 2029-30 until the next Spending Review exercise.
5.23 Total departmental spending is currently set to rise from £616.0 billion in 2026-27 to £670.6 billion by 2029-30. This has been increased by an average £4.2 billion a year since the October forecast. Capital spending has been increased by an average £3.1 billion. RDEL spending has been raised by £2.0 billion a year in the first three years but reduced by £1.9 billion in the final year (Table 5.6). The main changes reflect:
Frontloaded increases in RDEL over the next two years from the creation of a ‘transformation fund’ peaking at £1.8 billion in 2026-27,[55] before the overall envelope is reduced by £3.6 billion in 2029-30, despite £1.4 billion in additional commitments to employment support and tax and welfare compliance.
Higher capital departmental spending after 2025-26, by amounts rising to £4.4 billion by 2029-30. This reflects higher defence spending and an unspecified increase to the overall CDEL envelope, which increase 2029-30 CDEL spending by £6.4 billion and £1.6 billion respectively, partially offset by £3.6 billion of ODA savings.
Table 5.6: Departmental total spending: changes since October by policy and forecast differences
£ billion, unless otherwise stated
Forecast
2024-25
2025-26
2026-27
2027-28
2028-29
2029-30
RDEL spending
Difference
-2.6
2.4
3.3
2.3
0.5
-1.9
of which:
Forecast
-1.8
1.5
1.6
1.6
1.7
1.8
of which:
EPR reclassification
0.0
1.5
1.6
1.6
1.7
1.8
RDEL underspend judgement
-1.8
0.0
0.0
0.0
0.0
0.0
Policy
-0.9
0.9
1.7
0.6
-1.2
-3.6
of which:
RDEL supplementary estimates
-0.9
0.0
0.0
0.0
0.0
0.0
ODA RDEL
0.0
-0.2
-2.6
-2.8
-3.0
-3.2
Defence RDEL
0.0
0.4
0.2
0.5
0.5
0.6
Transformation fund
0.0
0.3
1.8
0.9
0.0
0.0
DWP employment support
0.0
0.0
0.2
0.3
0.4
0.9
Use of reserve
0.0
-0.2
0.0
0.0
0.0
0.0
Other specified announcements
0.0
0.7
0.9
1.0
1.2
1.2
Other unspecified announcements
0.0
-0.1
1.1
0.6
-0.3
-3.1
CDEL spending
Difference
3.9
0.0
0.8
3.4
3.9
4.4
of which:
Forecast
3.4
0.0
0.0
0.0
0.0
0.0
of which:
CDEL underspend judgement
3.4
0.0
0.0
0.0
0.0
0.0
Policy
0.4
0.0
0.8
3.4
3.9
4.4
of which:
CDEL supplementary estimates
0.4
0.0
0.0
0.0
0.0
0.0
ODA CDEL
0.0
-0.3
-2.2
-3.7
-3.5
-3.6
Defence CDEL
0.0
1.8
2.9
5.9
6.1
6.4
Use of reserve
0.0
-1.5
0.0
0.0
0.0
0.0
Other
0.0
0.0
0.0
1.2
1.3
1.6
Source: HM Treasury, OBR
5.24 The policy announcement to finance the increase in defence spending to 2.5 per cent of GDP by 2027-28 through a reduction in ODA to 0.3 per cent of GNI by 2027-28 improves the current budget position. By 2029-30, the total reduction in ODA spending of £6.8 billion is offset by the total £6.9 billion increase in defence spending. However, almost all the increase in defence spending is in the form of higher capital (92 per cent in 2029-30) whereas the reductions in ODA spending are spread more evenly across both capital and resource spending (47 per cent current and 53 per cent capital in 2029-30). As a result, while the change is near-neutral for total spending and public sector net borrowing, it leads to an improvement in the current budget of £2.6 billion in 2029-30.
5.25 These changes imply a 20.1 per cent nominal increase in defence spending and a 33.1 per cent reduction in the total ODA budget in three years. There are risks to the delivery of these substantial and rapid changes. Within ODA, in 2023, 35 per cent of the budget was spent via multilateral institutions to which commitments typically span multiple years, though some of these are only planned until the end of 2025-26, including £3.5 billion of spending to reach the International Climate Finance target. The previous Government was able to reduce ODA from 0.7 to 0.5 per cent of GNI between 2020 and 2021, albeit with some challenges. On the defence side, many capital defence projects are complex and long term, although the MoD delivered an 85 per cent nominal increase in its CDEL budget between 2019-20 and 2023-24.
5.26 There is a further risk from the Government’s intention to reduce ODA spending on support for asylum seekers in the UK (“in-donor refugee costs”) by clearing the asylum backlog, which has risen rapidly in nominal terms and as a share of UK ODA (Chart 5.9). Spending on support for asylum seekers is partly demand-driven and outside the control of government, and the savings from reducing the backlog may be partly offset in higher costs to local authorities.
Chart 5.9: Official Development Assistance spending
5.27 The Government’s intention to raise defence spending to 2.5 per cent of GDP by 2027-28 will bring it back in line with levels last seen in 1995-96. It would still be well below the 3.2 per cent level at the end of the Cold War and the over 4 per cent level during the 1980s.
Chart 5.10: Defence and ODA spending as a share of GDP
5.28 As in previous EFOs, for the period beyond which departmental budgets have been fixed, which is currently the years after 2025-26, we consider what a set of input targets and commitments in some areas of spending imply for growth in spending in areas not covered by commitments – often called ‘unprotected’ spending.[56] In terms of day-to-day departmental spending (RDEL), we assume the following:
Spending on the NHS in England grows by 3.6 per cent a year after 2025-26 in line with long-run average growth since 1949-50.
Spending on defence grows by 1.3 per cent a year in real terms after 2025-26, in line with the Government’s assumption that the new commitment to increase defence spending will be concentrated in capital DEL.
Spending on Official Development Assistance falls by 8.2 per cent a year in real terms after 2025-26, saving an average of £2.9 billion per year from then on relative to remaining at 0.5 per cent of GNI.
Core schools spending is held flat per-pupil in real terms, which we assume as a policy-neutral baseline.
Chart 5.11: Implied average annual growth in RDEL spend
5.29 Within the assumed envelope for total RDEL spending provided by the Treasury, these assumptions would leave other ‘unprotected’ RDEL spending (accounting for just under a third of day-to-day departmental spending) growing by 1.6 per cent a year in real terms from 2023-24. But unprotected RDEL spending would fall by 0.8 per cent a year in real terms from 2026-27. Spending would have to be £5.3 billion higher in 2029-30 for unprotected spending not to fall in real terms from 2026-27. The reduction in ODA spending reduces the implied pressure on unprotected RDEL to below the average 1.1 per cent fall in unprotected spending between 2025-26 and 2029-30 implied in our October 2024 forecast. It is also below the 2.3 per cent fall in unprotected RDEL spending between 2025-26 and 2028-29 implied in our March 2024 forecast, based on the plans set at that time by the previous Government.
5.30 On the basis of indicative assumptions provided by the Treasury (Table 5.7), the current RDEL envelope implies that central government employment will grow faster than private sector employment growth, but pay per person will be slightly weaker than in the private sector. Assuming that the share of RDEL spent on the central government paybill remains constant, pay drift is 0.5 per cent, and pay awards are 2.8 per cent next year and equal economy-wide earnings growth thereafter,[57] central government employment would grow by an average of 1.2 per cent each year after 2025-26. This would be above the 0.6 per cent growth we forecast for private sector employment. The share of CDEL used to build fixed assets increases slightly this year, after which we assume the share of CDEL in each category remains constant over time (Table 5.8).
Table 5.7: Departmental resource spending by economic category
£ billion, unless otherwise stated
Outturn
Forecast
2023-24
2024-25
2025-26
2026-27
2027-28
2028-29
2029-30
PSCE in RDEL
422.7
450.7
481.0
498.0
513.3
528.3
543.7
of which:
Consumption: central government paybill
172.0
186.0
198.4
204.9
211.5
218.4
225.7
Consumption: procurement
149.3
158.6
169.3
175.7
180.8
185.7
190.6
Subsidies
4.1
3.2
3.4
3.5
3.6
3.7
3.8
Net social benefits
2.2
2.4
2.6
2.7
2.8
2.8
2.9
Net current grants abroad
5.9
6.5
6.9
7.2
7.4
7.6
7.8
Current grants (net) within public sector
72.1
76.3
81.5
84.5
87.0
89.3
91.7
Other current grants
17.1
17.7
18.9
19.6
20.2
20.7
21.2
Memo: central government employment growth
2.1
2.3
1.7
1.2
1.2
1.0
0.8
Memo: central government pay per head growth
4.5
2.3
4.9
2.1
2.0
2.2
2.5
Memo: private sector employment growth
0.4
0.9
0.7
0.6
0.6
0.4
0.6
Memo: private sector pay per head growth
7.1
6.3
5.7
2.7
2.6
2.8
3.1
Source: HM Treasury, OBR
Table 5.8: Departmental capital spending by economic category
£ billion, unless otherwise stated
Outturn
Forecast
2023-24
2024-25
2025-26
2026-27
2027-28
2028-29
2029-30
PSGI in CDEL
96.6
102.9
111.3
118.0
124.1
125.3
126.9
of which:
Gross domestic fixed capital formation
63.1
69.3
75.0
79.5
83.6
84.5
85.6
Inventories
-0.2
0.0
0.0
0.0
0.0
0.0
0.0
Capital grants (net) within public sector
13.9
13.3
14.4
15.2
16.0
16.2
16.4
Capital grants to/from private sector
19.8
20.3
21.9
23.2
24.4
24.7
25.0
Memo: PSGI in CDEL as a per cent of GDP
3.5
3.6
3.7
3.8
3.9
3.8
3.7
Source: HM Treasury, OBR
Welfare spending
5.31 Total welfare spending in the forecast refers to AME spending on social security and tax credits. Around half is subject to the Government’s ‘welfare cap’, which excludes the state pension and those payments most sensitive to the economic cycle (we discuss performance against the cap in Chapter 7). The welfare spending forecasts are based on the determinants in the latest economy forecast – principally population, unemployment, earnings, and inflation – and informed by the latest outturn data and Department for Work and Pensions models.
5.32 Welfare spending is forecast to rise this year by £16.7 billion (5.6 per cent) driven by the uprating of most benefits with CPI inflation, to £313.0 billion or 10.9 per cent of GDP (Table 5.9). It is then forecast to rise in nominal terms by an average of £12.1 billion (3.6 per cent) a year over the rest of the forecast period, reaching £373.4 billion. As a share of GDP, welfare spending now falls slightly over the forecast to reach 10.8 per cent GDP in 2029-30, though this would still be 0.6 per cent of GDP higher than before the pandemic.
5.33 The main drivers of this increase over the forecast are higher pensioner spending due to the ageing population and the triple lock, and rising caseloads for health and disability benefits. Spending on these components increases total welfare spending between 2023-24 and 2029-30 by 0.5 per cent of GDP, offsetting the equal and opposite fall in all other welfare spending (Chart 5.12). The rise in pensioner spending is dampened by the increase in the state pension age from 66 to 67 between 2026 and 2028 which, as shown in Box 6.1 in Chapter 6, reduces spending on pensioner benefits by £10.4 billion (0.3 per cent of GDP) by 2029-30. Health and disability spending rises by 0.4 per cent of GDP even after the impact of the welfare measures included in this Spring Statement, which are discussed further below. Other welfare spending, primarily on non-health-related working-age benefits, falls by 0.5 per cent GDP over this period, due to GDP growth outstripping CPI uprating and caseloads forecast to be largely stable or falling.
Table 5.9: Welfare spending
£ billion, unless otherwise stated
Outturn
Forecast
2023-24
2024-25
2025-26
2026-27
2027-28
2028-29
2029-30
Pensioner spending(1)
141.9
150.7
158.6
166.3
169.1
173.8
181.8
UC and legacy equivalents(2)
87.3
87.8
88.8
92.2
93.4
95.7
99.0
Disability benefits(3)
36.3
41.4
44.9
48.9
51.1
53.4
56.3
Child benefit
12.5
13.3
13.3
13.6
13.6
13.6
13.6
Other spending(4)
18.3
19.9
20.6
21.3
21.6
22.0
22.6
Total welfare spending
296.4
313.0
326.1
342.1
348.8
358.5
373.4
of which:
Inside welfare cap
146.3
157.8
160.7
168.1
172.3
177.4
183.8
Outside welfare cap
150.1
155.3
165.5
174.0
176.5
181.1
189.6
Memo: total welfare (per cent of GDP)
10.8
10.9
10.9
11.0
10.8
10.7
10.8
Memo: health and disability benefits(5)
66.3
75.7
81.2
86.9
90.1
93.5
97.7
of which:
Children
3.7
4.5
5.1
5.6
6.1
6.6
7.0
Working-age adults
50.2
56.9
61.0
65.2
67.6
69.7
72.3
Pensioners
12.5
14.2
15.1
16.0
16.4
17.2
18.3
1) Pensioner spending includes pensioner housing benefit, pension credit, winter fuel payment, and state pension expenditure.
2) UC and legacy equivalents includes personal tax credits, housing benefit (excluding pensioner part), incapacity benefits (which comprise employment and support allowance, income support for incapacity, severe disablement allowance, and incapacity benefit), income support, and income-based and contributory jobseeker’s allowance.
3) Disability benefits includes disability living allowance, personal independence payment, and attendance allowance.
4) Other spending includes Northern Ireland social security expenditure.
5) Health and disability benefits includes standard allowance and health element expenditure for UC health-related claimants, employment and support allowance, incapacity benefit, severe disablement allowance, income support for incapacity, disability living allowance, personal independence payment, attendance allowance, UC carer’s element expenditure, carer’s allowance, and income support for carers. Excludes Northern Ireland health and disability benefits expenditure and cost of living payments. A breakdown of the components of this line, along with an alternative definition which excludes carer-related spending, is available in our detailed forecast tables.
Source: DWP, HMRC, OBR
Chart 5.12: Change in welfare spending compared to 2023-24
5.34 Relative to the October 2024 forecast, welfare spending is lower across the forecast by an average of £1.5 billion, and by £4.3 billion in 2029-30. Table 5.10 shows that this revision is driven by:
Policy measures, which decrease spending by an average of £1.9 billion a year, reaching £4.3 billion in 2029-30.[58] These savings are more than explained by the tightened personal independence payment (PIP) qualifying criteria (a saving of £4.1 billion in 2029-30) and the rebalancing of universal credit (UC) awards to reduce the health element and increase the standard allowance (a net saving of £1.2 billion in 2029-30). A full description of the welfare measures at this event can be found in paragraphs 3.10 to 3.27.
Forecasting changes to the state pension and pension credit, which are lower by an average of £1.3 billion a year. This reflects fewer overseas state pensions, lower spending related to the Home Responsibilities Protection scheme, and higher mortality assumptions in the latest ONS population projections.
Higher benefit uprating, which raises welfare spending by £1.2 billion a year from 2026-27, with two-thirds explained by higher CPI uprating largely for working-age benefits (£0.7 billion a year) and the remaining third explained by higher earnings increasing triple lock uprating for pensions (£0.4 billion a year).
Higher unemployment over the next two years, which increases UC spending by £1.0 and £0.8 billion in 2025-26 and 2026-27 respectively.
Other changes, mainly explained by lower costs from moving legacy claimants over to UC next year, and a higher attendance allowance caseload across the forecast, reflecting persistently high demand in recent outturn.
Table 5.10: Total welfare spending: changes since October
£ billion
Outturn
Forecast
2023-24
2024-25
2025-26
2026-27
2027-28
2028-29
2029-30
October 2024 forecast
296.3
313.6
327.5
340.5
349.5
361.4
377.7
March 2025 forecast
296.4
313.0
326.1
342.1
348.8
358.5
373.4
Difference
0.1
-0.5
-1.4
1.6
-0.7
-2.9
-4.3
of which:
Direct effect of Government decisions(1)
0.0
0.0
-0.1
-0.1
-1.6
-3.2
-4.3
Pensioner forecasting changes
0.0
-0.4
-1.1
-1.4
-1.2
-1.3
-1.4
Uprating(2)
0.0
0.0
-0.5
1.9
1.1
0.9
0.8
Unemployment
0.0
0.2
1.0
0.8
0.4
0.2
0.1
Other
0.0
-0.3
-0.7
0.4
0.6
0.5
0.5
1) This excludes the consequences of decisions for the block grant adjustment. 2) This captures the effects of changes to the inflation and earnings forecasts on all benefit uprating linked to CPI, earnings, and the triple lock.
Source: DWP, HMRC, OBR
5.35 Forecast growth in working-age health and disability spending is lower than in the October forecast, driven nearly entirely by the Government’s package of welfare reforms reducing spending from 2026-27 onwards. In October, we expected working-age health and disability spending to increase by £20.0 billion between 2024-25 and 2029-30, compared to £15.4 billion in this forecast. This spending is now forecast to be £5.3 billion lower in 2029-30 than in October (Chart 5.13). Even with this reduction, nominal annual growth of working-age health and disability spending across the forecast (averaging 4.9 per cent a year from 2024-25) still exceeds pensioner spending growth (3.8 per cent a year) and significantly outstrips non-pensioner, non-health-related welfare spending growth (1.6 per cent a year).
5.36 Roughly two-thirds of the downward revision to health and disability spending in 2029-30 is explained by lower disability spending, with the remainder mostly explained by lower incapacity spending. Full details on the policy measures driving these changes is provided in Chapter 3.
Chart 5.13: Working-age health- and disability-related welfare spending
Locally financed expenditure and public corporations’ expenditure
5.37 Locally financed current expenditure is forecast to rise from £66.5 billion (2.3 per cent of GDP) in 2024-25 to £81.1 billion (2.3 per cent of GDP) in 2029-30, as local sources of income grow steadily by an average of £2.9 billion (4.1 per cent) a year.[59] Compared with the October 2024 forecast, locally financed current expenditure is higher in the near term by £0.9 billion in 2024-25 and £0.7 billion in 2025-26, then broadly flat over the rest of the forecast (Table 5.11):
Net use of current reserves outturn has been revised up by £0.5 billion to £1.4 billion in 2023-24. Reflecting this revision and the ongoing funding pressures on local authorities, we have increased the drawdown assumptions during the current Spending Review period by £0.2 billion in 2024-25 and £0.7 billion in 2025-26.
The Government’s decision to provide exceptional financial support to some local authorities for the years covered by the current Spending Review increases spending by £1.5 billion this year and £1.3 billion in 2025-26.
Additional council tax flexibilities for six local authorities announced in the Local Government Finance Settlement, and an increase in referendum principles for Police and Crime Commissioners and Fire and Rescue authorities for 2025-26, have increased forecast council tax receipts by an average of £0.2 billion a year.
The reclassification of the Greater London Authority’s retained share of business rates now reduces current rather than capital locally financed expenditure. This means that relative to our October forecast current locally financed expenditure is lower and capital locally financed expenditure higher, each by an average of £0.8 billion over the forecast.
5.38 Pressures on local authority finances remain a substantial risk to the public spending forecast. Local authorities have statutory duties to provide a range of services, such as temporary accommodation or social housing for homelessness and social care for adults and children, where demand has increased significantly in recent years. As set out above, reflecting these pressures, the Government has granted 29 out of 317 local authorities in England ‘exceptional financial support’ (EFS) in 2025-26 to use capitalisation directions, allowing them to use revenue from asset sales or borrow from the Public Works Loan Board (PWLB) lending facility for current spending. EFS was first granted to a single local authority, Lambeth, in 2017-18.[60] The cost of EFS and the number of local authorities granted this support has accelerated since the pandemic and in particular after 2022-23, rising to an expected 29 authorities and a cost of £1.3 billion per year in 2025-26 (Chart 5.14). The Government has not yet set out how local authority spending pressures will be managed after 2025-26 in the next Spending Review period.
Chart 5.14: Local authorities supported under exceptional financial support
5.39 Locally financed capital expenditure is forecast to fall from £10.3 billion in 2024-25 to £8.4 billion in 2029-30.[61] Due to higher-than-expected borrowing from the PWLB lending facility, local authorities’ principal source of financing for borrowing, we have revised up local authority borrowing for capital spending by £1.9 billion in 2024-25 and £1.5 billion in 2025-26. Thereafter, given the wider pressures on local authority finances, we forecast local authority borrowing for capital expenditure to fall to £7.9 billion in 2029-30, below its 2019-20 peak of £12.2 billion. Public corporations’ capital expenditure is expected to grow from £13.9 billion in 2024-25 to £14.4 billion in 2029-30. In 2023-24, the ONS revised up spending by £1.3 billion, 10.2 per cent higher than our October 2024 forecast. This was mainly driven by increased capital investment costs facing Housing Revenue Accounts due to supply chain and logistics pressures within the housing industry, which we expect to persist.[62]
Table 5.11: Locally financed and public corporations’ expenditure: changes since October
£ billion, unless otherwise stated
Outturn
Forecast
2023-24
2024-25
2025-26
2026-27
2027-28
2028-29
2029-30
Locally financed current expenditure
October 2024 forecast
63.5
65.6
68.2
71.1
74.1
77.3
81.0
March 2025 forecast
62.3
66.5
68.9
70.5
73.6
77.2
81.1
March 2025 real growth rate (per cent)
2.9
1.0
0.6
2.3
2.9
3.1
Difference
-1.2
0.9
0.7
-0.5
-0.5
-0.1
0.1
Underlying forecast
-1.2
0.9
0.7
-0.5
-0.5
-0.1
0.1
of which:
Council tax
0.0
0.0
0.0
0.0
0.1
0.1
0.1
Retained business rates (England)
-0.5
0.0
0.3
0.1
0.0
-0.1
-0.1
Net use of current reserves
0.5
0.2
0.7
0.0
0.0
0.0
0.0
Other
-1.1
-0.6
-1.4
-0.5
-0.3
-0.1
-0.1
Direct effect of Government decisions
0.0
1.2
1.1
-0.2
-0.2
0.1
0.2
Locally financed capital and public corporations’ expenditure
October 2024 forecast
21.2
21.2
19.9
20.6
20.8
21.0
21.3
March 2025 forecast
23.7
24.2
22.4
22.5
22.5
22.6
22.8
March 2025 real growth rate (per cent)
-1.5
-9.9
-1.2
-1.7
-1.5
-0.9
Difference
2.5
3.0
2.5
1.8
1.8
1.7
1.5
Underlying forecast
2.5
3.0
2.5
1.8
1.8
1.7
1.5
Direct effect of Government decisions
0.0
0.0
0.0
0.0
0.0
0.0
0.0
Source: HM Treasury, OBR
Debt interest spending
5.40 Debt interest spending as a share of GDP is forecast to fall from a post-war high of 4.3 per cent of GDP in 2022-23 to 3.7 per cent of GDP in 2024-25 and to 3.6 per cent of GDP in 2026-27, before rising slightly in the final three years of the forecast to 3.8 per cent of GDP in 2029-30. Compared to the restated October forecast, debt interest spending is an average of 0.2 percentage points higher as a share of GDP and 0.4 percentage points higher as a share of total revenue. This primarily reflects higher gilt rates and Bank Rate expectations across the forecast period, as well as stronger RPI inflation in the near term. Debt interest spending as a share of GDP is now forecast to be broadly flat over the forecast period, with a slight rise of 0.1 per cent of GDP in the final year, whereas in the restated October forecast it fell by 0.1 per cent of GDP between 2024-25 and 2029-30. Spending on debt interest is around twice as high as the 10 years preceding the pandemic, when it averaged 2.0 per cent of GDP.
Chart 5.15: Debt interest spending relative to GDP and revenues
5.41 In nominal terms, debt interest spending is forecast to fall from £106.7 billion in 2023-24 to £105.2 billion this year due to lower RPI inflation, which reduces the cost of index-linked gilts. Debt interest spending then increases in every year of the forecast to reach £131.6 billion by 2029-30 as the stock of debt rises. Compared to October, the forecast is higher by an average of £5.9 billion a year and by £9.4 billion in 2029-30. These changes are primarily driven by increases in market expectations for the path of interest rates since October:
Revisions to the RPI inflation forecast drive higher spending in 2024-25 and 2025-26 (by an average of £2.4 billion a year), lower spending in 2026-27, 2027-28 and 2028-29 (by an average of £0.3 billion a year) and higher spending in the final year of the forecast (£1.4 billion).
Higher Bank Rate and gilt rates increases debt interest spending relative to the October forecast by £0.1 billion in 2024-25, rising to £6.3 billion by the final year of the forecast.
Financing and other factors reduce debt interest spending in 2024-25 and 2025-26, but increase it by rising amounts thereafter. This reflects lower-than-forecast outturn for 2024-25, which is more than offset in each year from 2026-27 onwards by a higher pre-measures net financing requirement.
The effects of policy increase debt interest marginally in 2026-27 before reducing debt interest by amounts which rise year on year to £0.7 billion in 2029-30, reflecting the cumulative reduction in borrowing which results from the fiscal tightening announced since October.
Table 5.12 – Central government debt interest (net of APF): changes since October
£ billion
Outturn
Forecast
2023-24
2024-25
2025-26
2026-27
2027-28
2028-29
2029-30
October 2024 forecast
106.7
104.9
105.7
108.2
112.9
117.9
122.2
March 2025 forecast
106.7
105.2
111.2
111.4
117.9
124.2
131.6
Difference
0.3
5.5
3.2
4.9
6.3
9.4
of which:
Pre-measures changes
0.3
5.5
3.1
5.0
6.6
10.1
of which:
RPI inflation
1.3
3.5
-0.4
-0.3
-0.3
1.4
Bank Rate
0.0
0.9
1.4
1.6
1.6
1.5
of which:
Central government
0.1
0.4
0.6
0.7
0.9
1.0
APF
-0.1
0.5
0.8
0.8
0.7
0.5
Gilt rate
0.2
1.3
1.7
2.6
3.6
4.8
Financing and other
-1.2
-0.2
0.4
1.1
1.6
2.3
Effects of Government decisions
0.0
0.0
0.1
-0.1
-0.3
-0.7
Source: ONS, OBR
Other annually managed expenditure
5.42 The main changes to other AME spending since the October forecast include:
Unfunded pensions have been revised up by £0.1 billion on average per year compared to October due to higher-than-expected earnings. The net costs are forecast to move from a deficit of £1.6 billion in 2024-25 to a surplus of £3.6 billion in 2029-30 as scheme receipts are expected to grow more quickly than scheme expenditure on average due to forecast increases in public sector earnings combined with higher employer contribution rates implemented from 2024. Over the long term, higher earnings will lead to increased pension entitlements and subsequently higher pension payments.
Current VAT refunds are £0.9 billion lower over the forecast due to lower in-year outturn that we expect to persist through the forecast. VAT refunds are offset in receipts and so are neutral for borrowing.
Scottish Government current expenditure is £0.1 billion higher over the forecast but £0.7 billion lower in the final year, due primarily to the UK Government’s reductions to PIP and reductions in the RDEL envelope.
Chapter 6: Fiscal aggregates
6.1 This chapter details how changes in our pre-measures forecast, and policies announced since the Autumn 2024 Budget, affect summary measures of the public finances, including:
deficit aggregates including public sector net borrowing (PSNB), the difference between expenditure and receipts; the current deficit, the difference between current (day-to-day) expenditure and receipts; the primary deficit, the difference between non-interest expenditure and receipts; and cyclically adjusted measures of the deficit which take account of the position of the economy relative to its potential level of output; and
balance sheet aggregates including public sector net debt (PSND), which includes all debt obligations net of liquid financial assets; public sector net financial liabilities (PSNFL) which includes all financial assets and liabilities; and public sector net worth (PSNW) which includes all financial and non-financial assets and liabilities.
Borrowing
6.2 In nominal terms, public sector net borrowing is forecast to increase from £131.3 billion in 2023-24 to a peak of £137.3 billion in 2024-25, before falling in all the remaining years of the forecast, to reach £74.0 billion in 2029-30. As a per cent of GDP, borrowing falls in each year, from 4.8 per cent in 2024-25 to 2.1 per cent in 2029-30 (Chart 6.1). Compared to the restated October forecast (which reflects the revised nominal GDP data published in the 2024 Blue Book),[63] borrowing as a share of GDP is forecast to be slightly higher in every year of the forecast – 0.4 percentage points higher in 2025-26 with the gap declining to only 0.1 percentage points higher by 2029-30.
6.3 Chart 6.2 breaks down the 2.6 percentage point forecast decrease in borrowing as a share of GDP between 2024-25 and 2029-30. Of this, 2.0 percentage points relate to higher receipts, with a combined 1.4 percentage points due to a rise in revenues from income tax and National Insurance contributions (NICs). This is largely driven by the Autumn 2024 Budget increase in employer NICs, and by stronger nominal earnings growth combined until 2027-28 with the frozen personal tax thresholds that were announced by the previous Government. Other taxes, most notably capital gains tax and stamp duty, combine to increase receipts by a further 0.6 per cent of GDP. Lower spending explains the remaining 0.6 percentage points of the fall in borrowing. This reflects a 0.1 percentage point fall in welfare spending and a projected 0.8 percentage point decline in a number of smaller items of annually managed expenditure (AME), including student loans, unfunded pensions, and capital spending by local authorities. This is only partly offset by a 0.1 per cent of GDP rise in debt interest and a 0.1 per cent of GDP increase in departmental spending.
Chart 6.1: Public sector net borrowing
Chart 6.2: The fall in borrowing as a share of GDP from 2024-25 to 2029-30
6.4 Compared to the October forecast, borrowing in cash terms is higher by £9.8 billion in 2024-25 and £12.1 billion in 2025-26 and then by progressively smaller amounts until 2029-30, when it is forecast to be £3.5 billion higher (Table 6.1 and Chart 6.3). This reflects:
Pre-measures spending, which is £2.7 billion higher in 2024-25 and £11.4 billion higher by 2029-30. This stems largely from higher debt interest spending due to an upward revision to RPI in 2025-26 and higher interest rates, the effects of which build throughout the forecast.
Pre-measures receipts, which are lower by £5.9 billion in 2024-25 and £1.7 billion by 2029-30. This is driven by lower in-year outturns for self-assessment receipts and onshore corporation tax, which are offset over the medium term mainly by upwards revisions to income tax and NICs due to stronger forecast nominal earnings growth.
The direct effect of policy measures, which push up borrowing in the first four years, but then reduce borrowing by amounts rising to £6.3 billion in 2029-30. This profile is driven by savings from welfare reforms and tax measures which build across the forecast, while other spending decisions increase borrowing in the near term and reduce it in the final two years of the forecast.
The indirect effect of policy measures, which decrease borrowing from 2025-26 and by £3.4 billion by 2029-30. This is largely from additional receipts due to the Government’s planning reforms increasing activity in the construction sector and housing market. Debt interest spending is £0.7 billion lower by 2029-30, as a result of a reduced cash requirement due to the policies announced since October.
Chart 6.3: Public sector net borrowing: changes since October
Table 6.1: Public sector net borrowing: changes since October
£ billion
Outturn
Forecast
2023-24
2024-25
2025-26
2026-27
2027-28
2028-29
2029-30
October 2024 forecast
121.9
127.5
105.6
88.5
72.2
71.9
70.6
March 2025 forecast
131.3
137.3
117.7
97.2
80.2
77.4
74.0
Difference
9.5
9.8
12.1
8.7
8.0
5.5
3.5
of which:
Underlying differences
8.6
12.6
9.8
10.3
11.6
13.1
of which:
Spending
2.7
9.6
7.3
8.5
8.7
11.4
of which:
Debt interest spending
0.3
5.5
3.1
5.0
6.6
10.1
Other spending
2.4
4.2
4.2
3.5
2.2
1.4
Receipts
5.9
3.0
2.5
1.8
2.8
1.7
Direct effect of Government decisions
0.8
1.0
0.9
0.6
-2.6
-6.3
of which:
Spending decisions
0.9
2.0
2.3
2.2
-0.8
-4.0
of which:
Welfare package
0.0
-0.1
-0.1
-1.8
-3.6
-4.8
DEL spending measures
-0.4
0.9
2.5
4.0
2.7
0.7
Other spending measures
1.3
1.2
-0.1
0.0
0.1
0.0
Receipts decisions
-0.1
-1.0
-1.4
-1.6
-1.9
-2.2
of which:
HMRC tax debt and compliance
-0.1
-0.3
-0.6
-0.7
-0.8
-1.0
Other tax measures
0.0
-0.7
-0.8
-0.9
-1.1
-1.2
Indirect effects of Government decisions
0.4
-1.6
-2.0
-2.9
-3.4
-3.4
of which:
Receipts
-0.1
-1.0
-1.7
-2.7
-3.5
-3.5
Debt interest spending
0.0
0.0
0.1
-0.1
-0.3
-0.7
Other spending
0.5
-0.5
-0.4
-0.1
0.3
0.7
Note: This table uses the convention that a negative figure means a reduction in PSNB i.e. an increase in receipts or a reduction in spending will have a negative effect on PSNB. This table does not include the effects of changes in our pre-measures forecasts for most environmental levies, VAT refunds, depreciation, council tax, and the new extended producer responsibility, as each change both receipts and spending by equal amounts and therefore do not change borrowing.
Source: ONS, OBR
Box 6.1: The fiscal impact of increases in the state pension age
As life expectancy has increased, successive governments have increased the state pension age (SPA). Over the past 15 years, the SPA has risen from 60 to 65 for women between April 2010 and November 2018, and then from 65 to 66 for both men and women between December 2018 and October 2020. Over the period of our latest forecast, the SPA will increase again from 66 to 67 for men and women between April 2026 and March 2028, as announced in the Pensions Act 2014 and confirmed by the Government in March 2023. This has a significant fiscal impact in the current forecast – we estimate its net impact is to reduce borrowing by £10.5 billion in 2029-30.
Chart A: Net fiscal saving in 2029-30 from the rise in the state pension age to 67
Increasing the SPA affects the public finances through three main channels. The largest is the direct reduction in the number of people eligible for the state pension in each year, which we estimate saves £10.4 billion in 2029-30 relative to the state pension age remaining at 66. The majority (£10.2 billion) of these savings come from 820,000 fewer 66 year-olds receiving the state pension, with a further saving (£0.2 billion) from 40,000 fewer 66 year-olds receiving pension credit and winter fuel payment. This overall saving equates to 5.7 per cent of total pensioner spending in 2029-30.
These savings are partially offset by a rise in the number of people who remain eligible for working-age benefits as a result. There are currently around 60,000 65 year-olds (excluding mixed age couples)a in receipt of universal credit (UC), equivalent to 7.4 per cent of the 65-year-old population. If the share of 66 year-olds in receipt of UC in 2029-30 remains at this level, and assuming average awards for 66 year-olds will be similar to those for 65 year-olds,b this would cost £0.7 billion in 2029-30.c
The rise in the SPA also creates incentives to join or remain in employment. The average employment rate for those in their mid-60s and above is at 11.9 per cent, significantly below the average employment for those aged 16-64 (74.8 per cent) as of 2024.d Previous analysis of the rise of the state pension age from 65 to 66 between 2018 and 2020 suggests that being under the state pension age increased the employment rate of 65 year-olds by 7.4 percentage points and 8.5 percentage points for men and women respectively.e A 2023 DWP evaluation of this rise indicated the increase led to an additional 55,000 65 year-olds in employment (mainly full-time employment) than if the SPA had remained the same, and an average increase in earnings of £52 per week across all 65 year-olds.f If the rise in the SPA to 67 results in a similar rise in employment and earnings, this would boost tax revenues by around £0.9 billion by 2029-30.
Overall, we estimate these channels result in an overall net fiscal saving of £10.5 billion from the SPA rising to 67 relative to it remaining at 66. This is subject to several uncertainties:
The working-age welfare spending impact could be higher if a significant proportion of those affected by the loss of state pension income claim extra-cost disability benefits.
The likelihood of entering or remaining in work is likely to be lower at older ages, so the employment response from the rise to 67 may not be as extensive as the rise to 66. However, over the longer run if demographic trends result in more people working at older ages, the benefits from this channel could increase.
We have assumed that all of the increase in tax revenues is from people entering employment and paying an average tax rate of 34 per cent on their earnings. The actual tax increase would be dependent on the exact earnings and hours distribution.
We will return to the impacts of the rise in the SPA as part of a broader consideration of pensions-related risks in our 2025 Fiscal risks and sustainability report.
a) Where one adult in a couple is over state pension age, they’re termed as a ‘mixed age’ couple.
b) In 2024-25, average awards for 65 year-olds on UC are 14 per cent lower than the rest of the caseload, thanks to lower child-related spending, only partially offset by a higher average entitlement for the health element.
c) We do not consider impacts on disability spending, as working-age personal independence payment (PIP) and disability living allowance (DLA) recipients will continue to receive PIP and DLA once they reach state pension age, and we expect higher new claims of PIP due to the SPA rise to be roughly offset by fewer new claims of attendance allowance.
d) ONS, Labour Market Overview, UK, March 2025.
e) Institute for Fiscal Studies, The effect of increasing the state pension age to 66 on labour market activity, January 2022.
f) Department for Work and Pensions, State Pension age Review, March 2023. This increase in employment and earnings is an average across all 65-year-olds, including those whose earnings are zero.
Current budget and other deficit aggregates
6.5 As outlined in Chapter 7, the Government’s fiscal mandate is to balance the current budget by 2029-30. Defined as the difference between total current spending (i.e. day-to-day spending excluding capital investment) and total current revenue, the current deficit is expected to fall from £61.1 billion (2.2 per cent of GDP) in 2023-24, to £60.7 billion (2.1 per cent of GDP) in 2024-25. The current balance continues to improve over the forecast period to reach a surplus of £9.9 billion (0.3 per cent of GDP) in 2029-30, unchanged from the October restated forecast.
Chart 6.4: Current budget deficit
6.6 Compared to the October forecast, the current budget deficit is expected to be £5.2 billion higher in 2024-25 and £10.0 billion higher in 2025-26 but then unchanged by 2029-30. This is the result of:
Pre-measures changes which push up the current budget deficit by £4.2 billion in 2024-25, rising to £14.0 billion by 2029-30. In 2024-25 the revisions are driven by lower receipts, but in each subsequent year the change mainly reflects higher debt interest spending.
The direct effectof policymeasures which increase the current budget deficit by £0.4 billion in 2024-25, but reduce it from 2026-27 onwards and by £10.9 billion in 2029-30. Tax measures reduce the current budget deficit in each year. Spending measures, which lower welfare spending and day-to-day departmental spending, reduce the current budget deficit from 2027-28 onwards. The policy decision to increase capital spending raises PSNB but does not affect the current budget.
The indirect effects of policy measures reduce the current budget deficit in each year from 2025-26, by amounts rising to £3.1 billion in 2029-30. This reflects the impact on receipts of the Government’s planning reforms and a reduction in debt interest spending due to a lower cash requirement.
Chart 6.5: Current budget deficit: changes since October
6.7 Other deficit measures also provide relevant information on the state of the public finances. The primary deficit, which excludes net interest spending, is a measure of the extent to which discretionary spending is covered by revenues and is sometimes referred to as a gauge of ‘fiscal effort’. All measures of the deficit can be presented in cyclically adjusted terms, correcting for an estimate of the position in the economic cycle, which provides a rough indication of the underlying or structural deficit:
The primary deficit moves from 1.9 per cent of GDP this year into surplus of 0.5 per cent of GDP in 2027-28, rising to 1.0 per cent of GDP in the final year of the forecast. If achieved this would be the largest primary surplus since 2001-02.
Cyclically adjusted measures of the deficit are slightly lower than the unadjusted metrics this year and then lower thereafter, until 2029-30 when the economy is judged to be near equilibrium. This reflects the negative output gap this year and subsequent closing of the output gap as monetary policy loosens.
Financial transactions
6.8 Changes in public sector net debt and wider balance sheet aggregates, including public sector net financial liabilities, are calculated by combining changes in borrowing with changes in financial transactions and any valuation effects. Financial transactions capture the effects of public sector net lending, sales or purchases of financial assets, and interventions which affect the Bank of England’s balance sheet. They also convert the accrued measures of tax and spending which underpin our forecast for borrowing into the cash flows relevant to debt. Valuation effects capture changes in the value of the assets or liabilities held by the public sector which count toward the measure of net debt.
6.9 In nominal terms, public sector net debt increases in each year of the forecast. The top panel of Table 6.2 breaks down the contribution of public sector net borrowing, financial transactions, policy measures and valuation effects to the year-on-year change in PSND. It shows:
Public sector net borrowing increases PSND in each year of the forecast, as discussed in paragraph 6.4.
Pre-measures financial transactions reduce debt in the first two years of the forecast but increase it in each subsequent year. This reflects term funding scheme (TFS) repayments which reduce debt by £50.7 billion in 2024-25 and £76.3 billion in 2025-26, but have no effect from 2027-28 onwards. The additions to debt in later years of the forecast are driven by student loans, which increase debt by increasing amounts, reflecting rising entrant numbers, and cash flow timing effects (converting the accrued measures of tax and spending in the forecast for borrowing into the cash flows relevant to debt), which raise debt by an average of £18.1 billion a year.
The effects of policy measures on financial transactions increase debt by small amounts from 2026-27 onwards due to UK Export Finance (UKEF) net loans of an additional £1.3 billion to overseas buyers of UK defence exports. UKEF has also guaranteed up to £1.6 billion of loans to the Ukrainian Government. No calls on the guarantees are assumed in the forecast period but the £0.2 billion fee income earned reduces debt in 2025-26.
Valuation effects increase debt in each year, by an average of £2.3 billion. This reflects the effects of selling new gilts at a discount relative to their face value.
6.10 Table 6.2 also shows that, relative to October, debt rises by £9.0 billion less in 2024-25, but by an average of £10.7 billion more in each subsequent year. Higher borrowing across the forecast increases debt in each year, but particularly in the short term. The other main change is due to a revised profile for TFS repayments. Higher-than-expected repayments in 2024-25 are assumed to persist in 2025-26, thereby reducing expected repayments in 2026-27 when the majority of outstanding loans are due to be repaid. In 2024-25 valuation changes also push down on debt relative to October, which reflects an increase in the value of the UK’s holdings of foreign denominated assets, due to depreciation of the pound.
Table 6.2: Public sector net debt: year-on-year changes
£ billion
Outturn
Forecast
2023-24
2024-25
2025-26
2026-27
2027-28
2028-29
2029-30
Year-on-year change in PSND
140.1
127.0
84.6
129.1
125.8
121.5
117.6
of which:
PSNB
137.3
117.7
97.2
80.2
77.4
74.0
Underlying changes in financial transactions(1)
-13.0
-35.9
29.7
43.1
41.3
41.6
of which:
Student loans net lending
8.4
9.6
10.6
11.2
11.5
11.7
Term funding scheme repayments
-50.7
-76.3
-12.3
0.0
0.0
0.0
Asset purchase facility sales losses
5.8
4.4
7.0
7.1
7.4
8.0
Cash flow timing effects(2)
24.5
22.5
15.9
16.6
14.7
14.1
Other financial transactions
-1.0
3.8
8.5
8.2
7.7
7.7
Effects of policy measures on financial transactions(3)
0.0
-0.2
0.2
0.5
0.6
0.2
Valuation effects(2),(4)
2.7
3.0
1.9
2.1
2.2
1.9
Change since October
Year-on-year change in PSND
-9.0
7.1
24.0
10.6
7.0
4.6
of which:
PSNB
9.8
12.1
8.7
8.0
5.5
3.5
Underlying changes in financial transactions(1)
-8.8
-3.8
16.3
3.3
2.2
2.3
of which:
Student loans net lending
-0.3
-0.6
-0.5
-0.3
-0.2
0.0
Term funding scheme repayments
-9.3
-3.0
12.3
0.0
0.0
0.0
Asset purchase facility sales losses
2.3
0.7
1.2
1.3
1.3
1.5
Cash flow timing effects(2)
1.4
-1.9
2.2
0.3
-0.6
-0.6
Other financial transactions
-2.8
0.9
1.1
2.1
1.7
1.5
Effects of policy measures on financial transactions(3)
0.0
-0.2
0.2
0.5
0.6
0.2
Valuation effects(2),(4)
-10.0
-1.0
-1.3
-1.3
-1.3
-1.3
1) This contains the impacts of our pre-measures forecast and indirect effects of policy measures on debt, beyond those already captured within PSNB. 2) Excludes the uplift on index-linked gilts which nets out between cash flow timing and valuation effects. 3) This contains the direct effects of policy measures on debt, beyond those already caputured within PSNB. 4) Effects of the premia on gilts held in the APF are subtracted from this line but included as part of the APF sales losses line.
Source: ONS, OBR
Asset purchase facility
6.11 The impact of the Bank of England’s asset purchase facility (APF) on fiscal aggregates over the forecast period is dependent on changes in Bank Rate expectations, gilt yields, and the assumption made on the pace of which gilts held within the APF are unwound. The forecast continues to assume an annual reduction of £100 billion in the APF between October 2024 and September 2025.[64] Thereafter we assume that there will be a constant pace of active sales of £48 billion during each October to September year.[65] This assumption is unchanged from the October and March 2024 forecasts where we capped the annual run-off between October 2024-September 2025 at £100 billion, comprising £87.2 billion of redemptions alongside £12.8 billion of active sales, with the same assumption of £48 billion active sales thereafter. Over the summer we will explore making further adjustments to our modelling to account for the Treasury and the Bank of England jointly agreeing to reduce the size of the APF cash buffer.[66]
Table 6.3: APF annual run-off assumptions
£ billion
Forecast (October-September year basis)
2024-25
2025-26
2026-27
2027-28
2028-29
2029-30
Total gilts held within the APF (start of year)
658.0
558.0
460.9
382.4
306.1
222.2
Total reduction of gilts held within the APF(1)
100.0
97.1
78.5
76.3
83.8
72.1
of which:
Active sales
12.8
48.0
48.0
48.0
48.0
48.0
Redemptions
87.2
49.1
30.5
28.3
35.8
24.1
1) Our assumption of the annual reduction of gilts held in the APF is based on values at initial purchase price.
Source: OBR
6.12 Between 2012 and the third quarter of 2022, the APF returned £123.9 billion of profits to the Treasury, reflecting the gap between gilt yield earned on the gilts held within the APF and the Bank Rate paid out on the reserves issued to the private sector (Chart 6.6). Since then the consistently higher Bank Rate has led to large interest losses. These losses were £18.5 billion in 2024-25, but are forecast to decline sharply to £3.3 billion in 2029-30 based on market expectations of a falling Bank Rate and as the stock of gilts held by the APF declines (Table 6.4).
6.13 The APF also makes valuation losses when gilts are sold or redeemed for prices below those at which the gilts were originally bought. These losses vary greatly from year to year depending on the composition of gilts run-off. Valuation losses are expected to be £12.7 billion in 2025-26, somewhat lower than the range of £17.6 billion to £22.5 billion seen in other years of the forecast (Table 6.4).
Table 6.4 – Forecast of cash transfers to the APF
£ billion
Forecast
2024-25
2025-26
2026-27
2027-28
2028-29
2029-30
Cash transfers from HM Treasury to BoE
-36.3
-17.9
-23.1
-22.3
-24.2
-21.2
of which:
APF interest losses
-18.5
-10.8
-7.6
-5.6
-4.2
-3.3
APF valuation losses
-18.1
-12.7
-17.6
-19.5
-22.5
-19.8
Change in APF cash
0.3
5.6
2.1
2.8
2.4
2.0
Note: The ONS has not published a breakdown of valuation losses made by the APF, so we cannot fully decompose the transfers between the APF and Treasury which have occurred to date. Our forecast splits out future interest and valuation losses. We also assume that the APF uses its cash holdings to cover some of the losses it incurs, such that the value of the cash held declines in proportion to the total value of the gilts held in the APF (in initial purchase price terms).
Source: OBR
6.14 The impact on the current budget, the Government’s target measure for its fiscal mandate, is driven only by APF interest losses. APF valuation losses on sales or redemptions do not affect the current budget but do increase PSND and PSNFL. This means that selling APF-held gilts decreases the negative impact from the APF on the current budget over time. A faster pace of sales would therefore improve the current budget compared to a slower pace of sales.
6.15 Interest losses and valuation losses together drive transfers between the Treasury and the APF (Chart 6.6) and the impact of the APF on PSND and PSNFL.[67] Since the fourth quarter of 2022 a total of £85.9 billion has been transferred from the Treasury to the APF. Compared to the October forecast, the impact of the APF on PSND and PSNFL has risen by an average of £1.9 billion a year, due to higher Bank Rate expectations and higher gilt yields. Latest market expectations, combined with the unchanged run-off assumption, imply a cumulative net lifetime loss of £133.7 billion, which is £18.0 billion higher than in our October forecast. There is significant uncertainty around this estimate which is highly sensitive to the future path of interest rates.[68]
6.16 This is not a comprehensive assessment of the overall fiscal impact of the Quantitative Easing (QE) programme, which supported the economy, asset prices, and financial markets at various points of stress over the past 15 years. These wider economic and fiscal benefits would need to be considered in any comprehensive assessment of the impact of QE.
Chart 6.6: Projection of cumulative flows to and from the APF
Financing requirement
6.17 The central government net cash requirement (CGNCR) forms the basis of the Debt Management Office’s financing remit. It is the primary driver of the net issuance of gilts, the government’s principal source of financing. Table 6.5 shows the relationship between the CGNCR and PSNB. First, financial transactions are added to borrowing to get the cash requirement of the whole public sector (PSNCR), with the path explained in more detail in paragraph 6.9 above. The cash requirements for non-central government are then removed, with the large cash surplus in early years driven by repayments of TFS loans to the Bank of England. Finally, this is adjusted to account for net cash movements within the public sector to get to the CGNCR excluding Network Rail, which is the measure that feeds directly into the Government’s gilt issuance plans.
6.18 The CGNCR is forecast to peak at £172.6 billion this year largely due to the spike in borrowing. This is more than double the £45.5 billion average in the three years prior to the pandemic, but is well below the pandemic peak of £334.5 billion in 2020-21. Following this financial year, the CGNCR is forecast to decline in line with borrowing across the forecast to £109.2 billion in 2029-30. The CGNCR is on average £40.8 billion higher than PSNB, largely reflecting sales and redemptions losses on the APF (£18.4 billion on average) and net outlays on student loans (£10.5 billion).
Table 6.5: Reconciliation of PSNCR and CGNCR
£ billion
Forecast
2024-25
2025-26
2026-27
2027-28
2028-29
2029-30
Public sector borrowing (a)
137.3
117.7
97.2
80.2
77.4
74.0
Financial transactions (b)
-8.6
-46.1
20.0
50.9
59.4
33.4
Public sector net cash requirement (NCR) (a+b)
128.8
71.6
117.1
131.1
136.8
107.4
Less local authorities and public corporations NCR (c)
-43.8
-71.4
-12.7
-0.6
-1.5
-2.7
CG net cash requirement (CGNCR) (a+b-c)
172.6
143.0
129.9
131.7
138.4
110.1
Less Network Rail NCR (d)
0.0
0.3
0.7
-5.8
0.9
0.9
CGNCR ex Network Rail (a+b-c-d)
172.6
142.7
129.1
137.5
137.4
109.2
Source: OBR
6.19 Gross gilt issuance (the total value of gilts issued) is equal to the CGNCR plus redemptions of existing gilts and purchases (buying back of gilts by the government) minus financing by other sources such as Treasury bills and NS&I. Over the five-year forecast period, gross gilt issuance averages 8.6 per cent of GDP, compared to the 1999-2000 to 2023-24 average of 6.9 per cent of GDP. Net issuance, that is gross issuance minus redemptions and purchases, averages 3.8 per cent of GDP. Gross and net issuance are an average of 0.4 and 0.3 percentage points higher than the restated October forecast, respectively (Chart 6.7). This is largely due to the higher borrowing over the forecast period increasing the financing requirement.
6.20 As in the October forecast, the cash requirement remains elevated over the medium term. Alongside the unwinding of APF gilt holdings by the Bank of England, this means that the private sector has to absorb historically high volumes of debt for a sustained period. The forecast for the change in private sector holdings of gilts peaks this year at 8.7 per cent of GDP and averages 6.2 per cent of GDP over the forecast period, compared to 2.8 per cent of GDP between 1999-2000 and 2023-24.
Chart 6.7: UK gilt issuance
Box 6.2: The changing maturity composition of gilt issuance
The UK government meets the bulk of its financing needs through issuing gilts across a variety of maturities. In recent years, the fiscal position has become increasingly sensitive to movements in interest rates. The stock of public debt has risen sharply from 28.3 per cent of GDP at the start of the century to 95.5 per cent in 2023-24, and is forecast to rise to 96.1 per cent in 2029-30. This necessitates substantial volumes of debt redemptions each year as existing gilts mature and require refinancing at the current interest rate on gilts.
Compounding this, the increased proportion of short-term gilts in the Government’s overall debt portfolio means that a larger fraction of the total debt is subject to more frequent refinancing. The share of either short or ultra-short gilts issued has risen from 29 per cent in the 10 years prior to the pandemic to 34 per cent in the three years following the pandemic, reducing the share of longer-maturity debt (Chart B). This has shifted the average maturity of the stock of debt from 16 years in 2017-18 to less than 15 years in 2023-24, increasing the sensitivity of debt interest costs to changes in short-term interest rates. Shorter-maturity gilts adjust more quickly to Bank Rate relative to longer-maturity gilts and so as the average maturity of the stock of debt falls, its sensitivity to interest rates rises.
A similar shift has been seen in a number of advanced economies. As noted by the OECD, between 2022 and 2023, this shift was present in 19 of 38 OECD members including Canada, France, Germany, and the USA, where a large increase in short-term debt issuance has come alongside the need to finance sustained high deficits.a In 14 of the 38 countries short-term borrowing fell, while it remained stable in the remaining 5 countries.
Chart B: Gilt issuance by maturity and average maturity of the gilt stock
Demand for short- versus long-maturity gilts can reflect investor sentiment regarding the economy and fiscal conditions. A shift towards shorter issuance may reflect changes to:
Risk appetite – when investors feel more risk-averse they may prefer shorter maturities, to reduce their risk and increase liquidity.
Inflation expectations – during periods of heightened inflation risk, investors may prefer shorter maturities to avoid the risk of default and inflation reducing real returns over the long term.
Market structure – in the UK, defined benefit pension funds have been significant purchasers of the longest-maturity gilts which match their long-term cashflow liabilities. As the defined benefit sector matures and declines in size this is likely to reduce demand for longer-maturity assets.
All of these factors are likely to have contributed, in the period during and since the pandemic, to the greater demand for shorter-issuance debt relative to longer-issuance debt, observed by the Debt Management Office.b One implication of switching to shorter maturity debt is that more gross issuance will be required in each year, increasing government’s exposure to changes in interest rates, some of which may be transitory. Any rise in debt interest could outweigh the potential benefits of a slightly lower average funding cost from skewing issuance to shorter dated gilts. We plan to look in more depth at longer-term trends that could affect the demand for gilts in our 2025 Fiscal risks and sustainabilityreport.
a) OECD, Global Debt Report 2024: Bond Markets in a High Debt Environment, 2024.
b) Annex B. DMO, Debt Management Report 2024-25, March 2024.
Debt and other balance sheet aggregates
Public sector net debt
6.21 Public sector net debt is forecast to fall from 95.9 per cent of GDP in 2024-25 to 95.1 per cent of GDP next year before rising back to 96.1 per cent in 2029-30 (Chart 6.8). Compared to the restated October forecast, net debt is 0.8 percentage points lower this year but is higher by 0.6 percentage points by the final year of the forecast, which largely reflects higher borrowing compared to October. In the October forecast, net debt was falling over the forecast period.
Public sector net debt (excluding the Bank of England)
6.22 Public sector net debt excluding the Bank of England (PSND ex BoE) rises in every year of the forecast from 89.9 per cent of GDP in 2024-25 to 95.0 per cent of GDP in 2029-30 (Chart 6.8). Compared to the restated October forecast, net debt excluding the Bank of England is lower this year and higher in every year thereafter, and by 0.9 per cent of GDP in 2029-30. This largely reflects the same drivers of the change in net debt except that it does not include TFS repayments and losses made by the APF appear in this measure when covered by the Treasury.[69] The differences between PSND and PSND ex BoE narrows from 6.0 percentage points this year to 1.1 percentage points by the end of the forecast as a result of both the TFS and APF winding down over the forecast period.
Chart 6.8: Public sector net debt and public sector net debt ex Bank of England
Public sector net financial liabilities
6.23 Public sector net financial liabilities (PSNFL) is one of the Government’s supplementary fiscal targets. It is a more comprehensive measure of the public balance sheet than PSND and includes non-debt liabilities such as funded pensions, monetary gold and special drawing right (SDR) liabilities, plus additional illiquid assets such as loans (most notably student loans) and equity holdings (including the assets of pension schemes). The additional assets recorded within PSNFL mean that it is on average £417.4 billion (12.9 per cent of GDP) lower than PSND (Table 6.6). For full details on the composition and measurement of PSNFL see Annex B of the October 2024 Economic and fiscal outlook.
Table 6.6 – PSND to PSNFL forecast reconciliation
£ billion
Outturn
Forecast
2023-24
2024-25
2025-26
2026-27
2027-28
2028-29
2029-30
Public sector net debt
2,686
2,813
2,897
3,026
3,152
3,274
3,391
Public sector net financial liabilities
2,278
2,404
2,526
2,639
2,734
2,828
2,919
Difference
-407.5
-408.7
-371.6
-387.8
-418.2
-445.8
-472.5
of which:
Pension liabilities
524.9
552.0
580.4
610.0
641.0
673.3
707.1
Monetary gold and SDR liabilities
30.9
31.4
31.3
31.3
31.3
31.3
31.3
Loan assets
-347.7
-321.1
-269.8
-285.7
-314.8
-343.7
-372.6
Equity assets
-563.2
-603.1
-629.6
-650.5
-673.2
-696.4
-720.7
Other(1)
-52.3
-67.9
-83.9
-92.9
-102.5
-110.4
-117.6
1) ‘Other’ mainly comprises of accounts payable (or receivable), and currency and deposits.
Source: OBR
6.24 In nominal terms, from a stock of £2,278 billion in 2023-24, PSNFL increases by £125.8 billion in 2024-25 and £121.6 billion in 2025-26 and by an average of £98.3 billion over the remainder of the forecast. The year-on-year changes in PSNFL largely reflect changes in PSNB, as well as:
Valuation changes in funded pension schemes, which reduce PSNFL by £20.7 billion in 2024-25 and £4.3 billion in 2025-26, reflecting an increase in equity prices this year, but increase it thereafter as growth in equity prices slows.
APF sales losses, incurred when gilts are sold by the APF for less than their redemption value, which increase PSNFL by £5.8 billion in 2024-25 and by an average of £6.8 billion over the remaining years of the forecast.
The premia on central government gilts, which increases net liabilities by £10.7 billion in 2024-25 but only £2.8 billion in 2025-26 and an average of £2.0 billion per year thereafter, as gilt prices rise and new debt is issued nearer to par.
Other valuation changes, which reduce PSNFL by £7.2 billion in 2024-25, reflecting the appreciation of the UK’s foreign denominated assets. Changes in the remainder of the forecast are driven almost entirely by the appreciation of non-pension equity holdings.
Table 6.7: Drivers of changes in public sector net financial liabilities
£ billion, year-on-year changes
Outturn
Forecast
2023-24
2024-25
2025-26
2026-27
2027-28
2028-29
2029-30
March 2025 forecast
113.0
125.8
121.6
113.0
95.4
93.9
91.0
of which:
PSNB
137.3
117.7
97.2
80.2
77.4
74.0
Valuation changes
-11.5
3.9
15.8
15.3
16.5
17.0
of which:
Funded pensions
-20.7
-4.3
4.0
3.0
3.7
3.8
Asset purchase facility(1)
5.8
4.4
7.0
7.1
7.4
8.0
Central Government gilt premia
10.7
2.8
2.0
2.1
2.2
1.9
Other valuation changes
-7.2
0.9
2.8
3.1
3.2
3.3
1) This includes both the losses incurred as gilts held within the APF are sold or redeemed and valuation changes as the nominal value of the stock of gilts held within the APF changes relative to the redemption price at which those gilts are recorded in PSND.
Source: OBR
6.25 As a share of GDP, PSNFL rises steadily from 81.9 per cent of GDP in 2024-25 to a peak of 83.5 per cent of GDP in 2026-27, before then falling to 82.7 per cent of GDP in 2029-30. Relative to the restated October forecast, PSNFL is lower by 0.2 per cent of GDP in 2024-25, but higher by an average of 0.7 per cent of GDP a year from 2025-26 onwards. This is largely driven by higher cash liabilities in each year from 2025-26 onwards, while the contribution from nominal GDP turns negative by 2028-29 (as the level of nominal GDP rises slightly above that in our October forecast) and slightly offsets the cash revisions. These cash revisions reflect:
Revisions to PSNFL outturn for 2023-24, which lower liabilities in each year of our forecast by £7.0 billion.
Revisions to pre-measures PSNB, which increase PSNFL in each year of the forecast, adding a total of £66.0 billion by 2029-30.
Policy measures, which increase PSNB in 2024-25, but reduce it in each year thereafter and so lower PSNFL by a total of £18.4 billion over the forecast.
Valuation changes, which reduce PSNFL by £6.5 billion in 2024-25, reflecting the appreciation of the UK’s foreign denominated assets, but are modest in each subsequent year. These leave PSNFL £7.7 billion lower in 2029-30.
Table 6.8: Public sector net financial liabilities: changes since October
Per cent of GDP
Outturn
Forecast
2023-24
2024-25
2025-26
2026-27
2027-28
2028-29
2029-30
October 2024 forecast
81.7
82.1
82.3
82.8
82.7
82.4
82.0
March 2025 forecast
81.0
81.9
82.9
83.5
83.4
83.2
82.7
Difference
-0.7
-0.2
0.6
0.7
0.7
0.7
0.7
of which:
Nominal GDP(1)
0.0
0.3
0.2
0.0
-0.1
-0.2
Cash level of financial liabilities
-0.1
0.2
0.5
0.7
0.9
0.9
£ billion
October 2024 forecast
2,285
2,408
2,518
2,622
2,710
2,799
2,886
March 2025 forecast
2,278
2,404
2,526
2,639
2,734
2,828
2,919
Difference
-7.0
-3.6
7.2
16.8
24.0
29.3
32.9
of which:
Revisions to outturn
-7.0
-7.0
-7.0
-7.0
-7.0
-7.0
Pre-measures PSNB forecast revisions
8.6
21.2
31.0
41.3
52.9
66.0
Effect of Government decisions on PSNB
1.2
0.7
-0.4
-2.7
-8.7
-18.4
Valuation changes
-6.5
-7.8
-6.8
-7.6
-7.9
-7.7
1) Non-seasonally-adjusted GDP centred end-March.
Note: Unless otherwise stated, the October 2024 forecast as a share of GDP has been restated to account for revised nominal GDP data in the 2024 Blue Book.
Source: OBR
Chart 6.9: Public sector net financial liabilities
Public sector net worth
6.26 Public sector net worth is the broadest measure of the governments balance sheet, capturing the changes in the value of non-financial assets (NFAs) and the liabilities of unfunded pension schemes in addition to what is captured by PSNFL. Inverted PSNW rises from 68.9 per cent of GDP in 2024-25 to peak at 70.0 per cent of GDP in 2026-27, before falling to 69.1 per cent of GDP by the end of the forecast period.[70] This small rise reflects a 0.2 per cent of GDP fall in unfunded pension liabilities and a 0.3 per cent of GDP fall in PFI liabilities, which largely offset the 0.8 per cent of GDP rise in PSNFL seen over this period. Compared to the October restated forecast, inverted PSNW is 0.6 per cent of GDP higher in 2024-25, rising to 2.4 per cent of GDP by 2029-30. This reflects a downward revision to the 2023-24 outturn for NFAs combined with slower growth in their value over the remainder of the forecast, and faster growth in unfunded pension liabilities.
6.27 Overall, all four measures of the balance sheet remain at historically high levels within the forecast period (Chart 6.10) and are forecast to be higher in 2029-30 than in 2024-25. All of the measures are also now expected to be higher as a share of GDP at the forecast horizon than was the case in October.
Chart 6.10: Four measures of the public sector balance sheet
Chapter 7: Fiscal targets
Introduction
7.1 This chapter:
sets out the legislated fiscal targets and assesses their likelihood of being met on current policy under our central forecast;
considers uncertainty around our fiscal forecast and the risks to the Government meeting its fiscal targets based on historical patterns of shocks to, and variations in, key macroeconomic and fiscal determinants.
The fiscal targets
7.2 The Charter for Budget Responsibility requires the OBR to judge whether the Government has a greater than 50 per cent chance of meeting its fiscal targets under current policy. The fiscal mandate in the current Charter is:
to have the current budget in surplus in 2029-30, until 2029-30 becomes the third year of the forecast period. From that point, the current budget must then remain in balance or in surplus from the third year of the rolling forecast period, where balance is defined as a range: in surplus, or in a deficit of no more than 0.5 per cent of GDP.[71] If the range is used between fiscal events, the current budget must return to surplus from the third year at the following fiscal event.
7.3 There are also two supplementary targets in the current Charter:
to have debt, defined as public sector net financial liabilities (PSNFL), falling as a share of the economy in 2029-30, until 2029-30 becomes the third year of the forecast period. Debt should then fall by the third year of the rolling forecast period; and
to ensure that expenditure on welfare (excluding the state pension and payments closely linked to the economic cycle) is contained within a predetermined cap and margin.
7.4 The Charter further states that the Treasury will consider a wide range of indicators in its management of fiscal policy.
Performance against the targets in the central forecast
7.5 In the central forecast, the fiscal mandate and supplementary targets are on course to be met, but by small margins:
The fiscal mandate, for the current budget to be in surplus, is met by a margin of 0.3 per cent of GDP (£9.9 billion) in 2029-30. The probability of the target being met is assessed as 54 per cent.
The supplementary target, for public sector net financial liabilities to be falling as a percentage of GDP, is met by a margin of 0.4 per cent of GDP (£15.1 billion) in 2029-30. The probability of the target being met is assessed as 51 per cent based on historic forecast errors.
The welfare cap plus margin set for 2029-30 is on course to be met by £13.5 billion.
Table 7.1: Performance against the Government’s fiscal targets
Per cent of GDP
£ billion
Per cent
Forecast
Margin
Forecast
Margin
Probability
Current balance to be in surplus by 2029-30
October 2024 forecast
Met
0.3
0.3
9.9
9.9
54
March 2025 pre-measures forecast
Not Met
-0.1
-0.1
-4.1
-4.1
March 2025 forecast
Met
0.3
0.3
9.9
9.9
54
Memo: excluding fuel duty rises
Met
0.2
0.2
5.3
5.3
Change in public sector net financial liabilities in 2029-30
October 2024 forecast
Met
-0.5
0.5
15.7
51
March 2025 pre-measures forecast
Met
-0.1
0.1
4.9
March 2025 forecast
Met
-0.4
0.4
15.1
51
Memo: excluding fuel duty rises
Met
-0.3
0.3
10.9
Welfare cap: specified welfare spending in 2029-30
October 2024 forecast
Met
194.5
9.7
March 2025 forecast
Met
190.7
13.5
Source: OBR
Change in headroom against fiscal targets
7.6 Based solely on underlying forecast changes and before taking account of the policy measures announced at this forecast, the current budget target would have been missed by a margin of £4.1 billion, while the PSNFL target would have been met by a reduced margin of £4.9 billion. Policy measures, discussed in detail in Chapter 3, restore the headroom against the current budget and the PSNFL target so that both targets are met by margins equal or similar to those in the October forecast. As shown in Chart 7.1:
Underlying pre-measures forecast changes since the October forecast reduce headroom by £14.0 billion for the current budget target and by £10.8 billion for the net liabilities target, mainly due to higher debt interest spending.
The direct effects of policy measures increase headroom by £10.9 billion for the current budget and by £6.3 billion for the net financial liabilities target. Direct policy effects increase headroom more for the current budget target than for net liabilities. This is because the increases made to defence spending are primarily capital spending, while the offsetting reductions made to Official Development Assistance (ODA) spending are balanced across current and capital spending.
The indirect effects of policy measures increase headroom by £3.1 billion for the current budget target and £3.9 billion for the net financial liabilities target. This is largely driven by higher tax receipts due to the Government’s planning reforms marginally increasing GDP and property transactions in the medium term.
This leaves overall headroom in the central forecast at £9.9 billion (0.3 per cent of GDP) against the current budget target and £15.1 billion (0.4 per cent of GDP) against the supplementary target for public sector net financial liabilities.
Chart 7.1: Fiscal target headrooms: changes since October
Headroom against successive fiscal mandates
7.7 The headroom against the fiscal mandate is the same as in the October 2024 forecast and the joint third lowest of 29 forecasts since the OBR was established (Chart 7.2). It is around one-third of the average headroom Chancellors have set aside across this period and only 11 per cent of the average five-year-ahead forecast error for the current budget, which is around £93 billion.
7.8 Compared to the October 2024 forecast, pre-measures borrowing was revised up by £13.1 billion in 2029-30. Excluding summer 2020, this degree of variance is broadly in line with the average absolute revisions to final year pre-measures borrowing of £14.4 billion since the OBR was established, and less than the £19.4 billion variance over the past ten forecasts.[72]
7.9 As described above, the Government has responded to the deterioration in this pre-measures forecast by tightening fiscal policy by enough to restore fiscal headroom to the level in October 2024. Chart 3.1 in Chapter 3 shows that since 2010, policy has tended to react asymmetrically to forecast changes. Forecast improvements have almost all been met with looser fiscal policy, while government responses to fiscal deteriorations have been a mix of tightening, loosening and largely neutral policy responses. On only five of 15 occasions since June 2010 has fiscal policy tightening in response to a final-year forecast deterioration been sufficient to offset all of the additional borrowing.[73]
Chart 7.2: Successive forecasts for headroom against fiscal targets
7.10 Since inflation and interest rates began to rise post pandemic, debt interest costs have been a significant driver of forecast change.[74] This has coincided with a tendency on the part of Chancellors to set aside significantly less headroom than their predecessors – around one-third of the pre-2022 average.[75] Pre-measures debt interest spending has been revised by an absolute average of £15.6 billion across the five-year forecast period since the November 2022 forecast. Within this there have been both large upward revisions, for example of £38.7 billion in November 2022, and large downward revisions such as £14.4 billion in March 2024. At this event, pre-measures debt interest spending was higher by an average of £6.0 billion across the five-year forecast period and £10.1 billion in the final year of the forecast, more than offsetting the headroom against the fiscal mandate the Chancellor had in October.
7.11 This forecast also follows a recent trend where the path of debt – on a public sector net debt excluding the Bank of England (PSND ex BoE) basis[76] – is forecast to initially rise, before stabilising in later years. As shown in Chart 7.3, in the forecasts immediately preceding the pandemic and energy crises, based on government policy at the time, PSND ex BoE would have fallen steadily throughout the forecast period.[77] In practice, the pandemic and energy crisis led to debt actually rising significantly. Since November 2022, governments have instead set fiscal plans that allow debt to rise across the forecast before aiming to stabilise it in the final years at a higher level. Reflecting changes in the economy and policy choices, the level at which government plans would have stabilised debt has increased at successive forecasts. If the economy were to be hit by further shocks in the future, this risks debt again ratcheting up significantly and from a higher level than in the past.
Chart 7.3: Successive forecasts for public sector net debt excluding the Bank of England
Fan charts
7.12 Fan charts, based on stochastic simulations and historic errors, allow us to assess the probability of the Government meeting its current budget and PSNFL fiscal targets based on previous shocks and forecast errors, respectively. Chart 7.4 shows the probability distribution around the forecast for the current budget and PSNFL. It shows that, based on currently stated government policy, there is:
a 54 per cent chance that the current budget is in surplus in the target year of 2029- 30; and
a 51 per cent chance of public sector net financial liabilities falling as a share of GDP in the target year 2029-30.
Chart 7.4: Fan chart for current budget and PSNFL
7.13 The margins, or fiscal headrooms, against the current budget and PSNFL targets are largely unchanged since the October 2024 forecast, with the probability that each target is met remaining at the same level. Chart 7.5 shows the amount of headroom set and associated probability of meeting the different fiscal mandates that have been set since 2010. The probability peaked at 80 per cent in December 2013 and December 2014, when historically high levels of headroom were set.[78] Since October 2021, as headrooms have narrowed against different fiscal mandates, this probability has only been as high as 58 per cent in March 2022, with a headroom of £35.4 billion, and has averaged 54 per cent (March 2025 forecast inclusive). This demonstrates that a significant increase in headroom would be needed to materially increase the probability that a fiscal mandate will be met, given the inherent uncertainty in any economic and fiscal forecast.
Chart 7.5: The probability of hitting the Government’s fiscal mandate and successive headroom forecasts
Welfare cap
7.14 The welfare cap is a limit that the Government aims to spend on certain social security benefits and tax credits in the final year of a given Parliament. Since its introduction in 2014, the welfare cap has been revised upwards frequently to account for inflation and changes in welfare demand, such as in October 2021 following the pandemic.
7.15 At the October 2024 forecast the Government set a new welfare cap in 2029-30 of £194.5 billion, and a margin for the cap that rises by 0.5 percentage points a year in the first two years of the forecast, followed by a further 1 percentage point a year increase thereafter, reaching 5 per cent in 2029-30. This was the largest since its introduction in 2014. Spending within the welfare cap in 2029-30 has fallen by £3.8 billion at this forecast, due mainly to the Government’s welfare reforms, so that, when including the margin, the welfare cap is on course to be met by £13.5 billion.
Table 7.2: The welfare cap and margin
£ billion
Forecast
2024-25
2025-26
2026-27
2027-28
2028-29
2029-30
Welfare cap
194.5
Pathway
161.7
166.8
172.6
179.0
186.4
Margin (per cent)
0.5
1.0
2.0
3.0
4.0
5.0
Margin
0.8
1.7
3.5
5.4
7.5
9.7
Welfare cap and pathway plus margin
162.5
168.5
176.0
184.4
193.8
204.2
Latest forecast and update on performance against cap and pathway
March 2025 forecast
157.8
160.7
168.1
172.3
177.4
183.8
Inflation adjustment
0.0
-0.6
0.9
0.3
0.1
0.0
Scottish welfare block grant adjustment
5.2
5.6
6.1
6.3
6.6
6.9
March 2025 forecast after adjustments
163.0
165.7
175.1
178.9
184.1
190.7
Difference from:
Cap and pathway
1.2
-1.1
2.5
-0.1
-2.3
-3.8
Cap and pathway plus margin
0.4
-2.8
-0.9
-5.4
-9.7
-13.5
Memo: cumulative percentage point change in preceding September (Q3) rates of inflation since our October 2024 forecast
0.0
-0.4
0.6
0.2
0.1
0.0
Source: DWP, HMRC, HMT, OBR
Broader fiscal indicators
7.16 Alongside the formal assessment of the proposed fiscal targets, we consider broader balance sheet and debt affordability metrics as indicators of fiscal sustainability. Table 7.3 presents a dashboard of balance sheet and debt affordability metrics that shows: first, their levels and how these compare with the medians from 1967-68 to 2006-07 (the four decades preceding the financial crisis) and from 2007-08 to 2018-19; and second, whether they are improving or deteriorating in each year of the forecast. It shows that the:
Balance sheet stock measures are all in a much worse position than both the pre-2007 median (shown by the red cells) and the 2007-2019 median, due to historically elevated borrowing in the financial crisis, pandemic, and energy crisis. The bulk of the increase across all measures compared to the pre-2007 median occurred in the immediate years post-financial crisis before surging further from 2019-20 onwards. By the end of the forecast all measures are falling, with larger and more sustained reductions in the wider measures of the balance sheet shown by the bottom panel. However, all measures are at a higher level by the forecast horizon compared to the start of the forecast period. As shown in Chart 6.10 public sector net worth (inverted) peaked in 2020-21 at 73.3 per cent while PSND and PSNFL are forecast to reach their estimated highest levels as a share of GDP in over 60 years at differing points over this forecast period.[79]
Cost of debt (flow) measures show a more mixed position in comparison to the pre-2007 median, indicated by the orange and green cells. Net interest costs as a share of GDP remain broadly in line with the pre-2007 median across the forecast but increase in the final three years to 3.2 per cent of GDP in 2029-30 as elevated gilt yields push up on debt interest spending. Although debt interest spending is forecast to be at historically high levels over the medium term (paragraph 5.40), this has coincided with a sharp rise in interest and dividend receipts over recent years(paragraph 4.40), which partially offsets some of the spending impact. As a share of revenue, however, net interest costs remain below the pre-2007 median across the forecast, owing to the record tax take as a share of GDP outlined in Chapter 4. Both measures are particularly elevated when compared to the 2007-2019 median as net interest costs fell to lows of 1.4 per cent of GDP and 3.7 per cent of revenue during this period, before falling even further during the pandemic when Bank Rate was at 0.1 per cent.
Table 7.3: Dashboard of balance sheet and fiscal affordability indicators
Pre-2007 median
2007-2019 median
2024-2025
2025-2026
2026-2027
2027-2028
2028-2029
2029-2030
Level (per cent of GDP, unless otherwise stated)
Balance sheet metrics
PSND
36.6
78.3
95.9
95.1
95.8
96.1
96.3
96.1
PSND ex BoE
36.6
74.2
89.9
92.0
93.4
94.2
94.8
95.0
PSNFL
32.4
68.3
81.9
82.9
83.5
83.4
83.2
82.7
PSNW (inverted)
-12.5
55.4
68.9
69.7
70.0
69.7
69.6
69.1
Cost of debt metrics
Net interest costs
2.8
2.0
2.8
3.0
2.9
3.0
3.1
3.2
Net interest costs (per cent of revenue)
7.9
5.3
7.1
7.4
7.0
7.2
7.4
7.6
Year-on-year change in ratio to GDP
Balance sheet metrics
PSND
-1.4
2.3
0.4
-0.7
0.6
0.4
0.1
-0.1
PSND ex BoE
-1.4
1.2
2.9
2.1
1.4
0.8
0.6
0.2
PSNFL
-0.4
1.9
0.9
1.0
0.6
-0.1
-0.2
-0.4
PSNW (inverted)
0.5
2.0
-1.7
0.8
0.3
-0.3
-0.1
-0.5
Cost of debt metrics
Net interest costs
-0.1
0.0
-0.2
0.2
-0.1
0.1
0.1
0.1
Net interest costs (per cent of revenue)
-0.1
-0.1
-0.5
0.2
-0.3
0.2
0.2
0.2
Note: Pre-2007 median is from 1967-68 to 2006-07. For year-on-year changes, medians are from 1968-69. Values are coloured depending on the pre-crisis decile they lie in. PSNW has been inverted to facilitate comparisons with the other three metrics.
Source: ONS, OBR
Recognising uncertainty
Specific risks
7.17 The OBR is required to assess whether the Government has a better-than-even chance of meeting its fiscal targets, which we do by producing a median forecast relative to which the outturn is equally likely to be higher or lower than predicted based on current policies. We use several analytical tools to illustrate the risks around our central forecast including:
disclosure of specific risks to our economic and fiscal forecasts, focusing on those which appear most material at the time;
fan charts, shown above in Chart 7.4, that reflect the chances of shocks of different sizes (through stochastic simulations and forecast errors drawing on historical experience) to illustrate the uncertainty around our assessment of the probability that the fiscal targets are met;
sensitivity analysis that illustrates the vulnerability of the current budget and PSNFL targets to changes in key forecast outcomes including gilt yields, and nominal GDP growth; and
scenarios that illustrate the vulnerability of the public finances to changes in productivity and the uncertainty around global trade.
7.18 Over recent years, large shocks and their aftermath have often resulted in significant revisions to the economic and fiscal forecasts from one fiscal event to the next. We therefore continue to emphasise the uncertainties around the forecast in the light of rapidly changing economic conditions and the possibility that any of our key judgements could prove significantly too optimistic or pessimistic. Specific sources of risks to our economy forecast that we highlight in the sensitivity and scenario analysis in this Economic and fiscal outlook (EFO) include:
The path for interest rates, both Bank rate and gilt yields, is highly uncertain and continues to fluctuate between our forecasts, contributing to sizeable revisions to debt interest spending over recent forecasts. The sensitivities explored below show that if Bank Rate expectations and gilt yields on newly issued debt were 0.6 percentage points higher across the forecast, that would eliminate all the headroom for the fiscal mandate.
Productivity growth, as the key driver of economic growth over the medium and long term, is central to the economic projections that underpin our fiscal forecast. We forecast that trend productivity growth will average 1.0 per cent over the next five years. This is higher than the around 0.5 per cent seen over much of the post-financial crisis period, but substantially below the pre-crisis trend over several decades of around 2 per cent. The fiscal implications of alternative scenarios for productivity growth are explored below.
Uncertainties around global policy on trade following increases in US tariffs on imports from a number of countries and subsequent counter-tariffs. There remains a high degree of uncertainty on the size and coverage of future US tariff increases and potential subsequent retaliation. The fiscal implications of alternative scenarios for global trade policy are also explored below.
7.19 There are, in addition, several fiscal and policy-related risks to this forecast:
The tax-to-GDP ratio is forecast to increase to a post-war high of 37.7 per cent of GDP in 2027-28. Part of this increase is driven by the policies announced at the previous Budget, including the increase in employer National Insurance Contributions and increases to capital taxes, and the estimated yield from several of these policies is highly uncertain. The forecast also assumes that the seldom-implemented indexation of fuel duty from April 2026 raises £4.6 billion in 2029-30. There are also significant risks around key economic forecast assumptions which drive tax revenues, such as earnings and employment growth. As explained in Chapter 3, there is further risk to the tax forecast from the assumption that the implied tax gap, a measure of the degree of tax compliance, falls to a historic low due to recent compliance policy measures (paragraph 3.30).
Defence spending will rise to 2.5 per cent of GDP by 2027-28, crystallising a risk we have previously identified and is funded with a reduction in ODA spending that reaches £6.8 billion in 2029-30. The Government has also stated a “clear ambition” to increase defence spending to 3 per cent of GDP over the next Parliament, which would be equivalent to £17.3 billion in 2029-30. Planned savings in ODA, particularly with respect to cuts in asylum spending, may drive spending pressures elsewhere. Chapter 5 sets out potentially larger pressures on ‘unprotected’ departments at the upcoming Spending Review set for June 2025, whose budgets may need to be cut by 0.8 per cent a year in real terms, equivalent to £6.7 billion in 2029-30.
Welfare spending on incapacity and disability benefits is forecast to rise from £75.7 billion (2.6 per cent of GDP) in 2024-25 to £97.7 billion (2.8 per cent of GDP) in 2029-30. This includes the impact of the welfare reforms (see paragraph 3.10) in this forecast which are estimated to reduce spending in 2029-30 by £4.8 billion. Both the underlying trend in spending on these benefits and the impacts of these policies are very uncertain given the complexity of how trends in health, demography and the economy interact with the benefits system (as our 2024 Welfare trends report explored). If incapacity and disability caseloads continued to grow in line with 2024-25 caseload growth for the rest of the forecast period, spending would be around £12 billion higher in 2029-30.
Sensitivities
7.20 Sensitivity analysis estimates what would need to happen to key forecast parameters and judgements to reduce the headroom against different targets to zero (a ‘test to failure’ or ‘reverse stress test’). We assess the sensitivity of the change in the current budget to changes in growth, the economy-wide effective tax rate, gilt yields on government debt issued over the forecast, and inflation.
7.21 We use fiscal ready-reckoners to calibrate several possible adverse surprises relative to our central forecast that would be sufficient to push the current budget into deficit in 2029-30.[80] The £9.9 billion current budget surplus in our central forecast could fall to zero if:
Nominal GDP growth, attributed to lower trend productivity growth, was 0.1 percentage points lower in each forecast year, which is one-quarter of the downward revision to nominal GDP growth in 2025-26 from our October 2024 forecast.
The effective tax rate was 0.3 percentage points lower in each year. This is equivalent to a cut to the basic rate on income taxby just over 1p in each forecast year, lowering the current 20p rate by 5.9 per cent to 18.8p.
Gilt yields on debt issued across the forecast and Bank Rate expectations from 2025-26 were 0.6 percentage points higher than our market determinants window of the 10 working days to 12 February.
RPI inflation was 0.9 percentage points higher in each year of our forecast, broadly similar to the single-year increase in RPI in 2025-26 from the October 2024 forecast.
Chart 7.6: Sensitivities: changes that would generate a current deficit
Scenarios
7.22 As set out above, in this EFO we have assessed the economic and fiscal implications of alternative scenarios for productivity and for global trade policy. In Chapter 2, we describe the implications for the economy forecast of these scenarios. In this section we assess the fiscal implications.
Productivity scenario
7.23 In Box 2.1, we consider higher and lower trend productivity assumptions around the judgement in the central forecast that trend productivity growth averages 1.0 per cent over the forecast and reaches 1.3 per cent in 2029-30. In the lower productivity scenario, trend productivity growth remains at 0.3 per cent per year throughout the forecast, and in the higher productivity scenario it averages 1.2 per cent a year from next year.
7.24 The fiscal implications of the lower productivity scenario, which leaves the level of nominal GDP and average earnings 3.2 per cent lower in 2029-30 than in the central forecast, are:
Receipts are lower by an average of £25.9 billion from 2025-26 and by £51.5 billion in the final year but remain broadly unchanged as a share of GDP due to the higher level of nominal GDP.
Spending is higher in nominal terms by an average of £2.2 billion from 2025-26 and by £5.9 billion in the final year. This is largely accounted for by higher debt interest spending in every year. By 2029-30, with nominal GDP also lower, spending as a share of GDP is 1.6 per cent higher than in the central forecast.
The current budget remains in deficit across the forecast period. From £60.8 billion (2.1 per cent of GDP) this year it shrinks to a deficit of £20.4 billion (0.6 per cent of GDP) in 2027-28 before increasing in the final two years to £48.4 billion (1.4 per cent of GDP) in 2029-30.
PSNFL increases in every year of the forecast due to the compounding impact of elevated borrowing. In the final year it reaches 89.6 per cent of GDP, 6.9 percentage points higher than the central forecast.
7.25 Conversely, in the higher productivity scenario where the level of nominal GDP and average earnings are 1.3 per cent higher in 2029-30:
Receipts are higher by an average of £16.3 billion from 2025-26 and by £20.2 billion in the final year, similarly remaining broadly unchanged as a share of GDP.
Spending is lower by an average of £1.1 billion from 2025-26, and by £2.7 billion in the final year. This is more-than-accounted for by reduced debt interest spending because of lower borrowing. By 2029-30, spending is 0.6 per cent of GDP lower than the central forecast. This assumes that government takes all the fiscal benefit of higher growth by keeping much of public spending unchanged in real terms, so allowing it to fall as a share of GDP.[81]
The current budget moves from a £58.8 billion (2.0 per cent of GDP) deficit this year to a small surplus of £0.6 billion (0.0 per cent of GDP) in 2026-27 and reaches a surplus of £33.1 billion (0.9 per cent of GDP) by the final year of the forecast.
PSNFL is lower in every year, peaking in 2025-26 at 82.0 per cent of GDP, before falling by 0.9 per cent of GDP in each year thereafter to reach 79.2 per cent of GDP in 2029-30, compared to 82.7 per cent in our central forecast.
Chart 7.7: Current budget deficit and PSNFL in the productivity scenario
Trade scenario
7.26 In Box 2.2 we explore the economic implications of three separate trade scenarios: the first where the United States (US) implements additional 20 percentage point tariffs on Canada, Mexico and China with each country retaliating with reciprocal tariffs; a second where the UK and the rest of the world also have these tariffs levied on them by the US unilaterally, and; a third scenario where the UK and the rest of the world additionally retaliate in kind to tariffs levied on them by the US.
7.27 In the first scenario, involving additional tariffs between the US, China, Canada and Mexico, there is a small short-term rise in inflation and unemployment and the level of nominal GDP falls to a trough of 0.2 per cent of GDP below our central forecast in 2026-27 and is 0.1 per cent of GDP lower in the final year. The fiscal implications are that:[82]
The current budget is higher in every forecast year by an average of £3.5 billion (0.1 per cent of GDP). This slight increase is largely driven by lower receipts, with smaller impacts from welfare and debt interest spending. As in our central forecast, it remains in surplus in the final three years and the fiscal rule is met.
PSNFL is higher in every year and by 0.6 per cent of GDP in 2029-30 due to the compounding impact of higher borrowing. The supplementary target for PSNFL to be falling in 2029-30 is still met by a margin of £14.8 billion.
7.28 In the second scenario, where the US additionally levies higher tariffs on the rest of the world, the level of nominal GDP falls to a trough of 0.6 per cent of GDP below the central forecast in 2026-27 and is 0.4 per cent of GDP lower in the final year. The short-term impacts on inflation and unemployment are around double the impact in the first scenario, with CPI and RPI 0.3 percentage points higher than our central forecast in 2025-26. The fiscal implications are that:
The current budget deficit is higher in every year by an average of £10.1 billion (0.3 per cent of GDP), remaining in deficit until 2029-30 where the fiscal mandate is met by a very small margin of £0.3 billion (0.0 per cent of GDP) in the final year. This is largely driven by an average of £7.8 billion lower receipts from 2025-26, with spending higher by an average of £2.3 billion from a combination of higher welfare and debt interest spending.
PSNFL is higher in every year and by 1.8 per cent of GDP in 2029-30 and falls slightly to 84.5 per cent of GDP in 2029-30 so that the supplementary target is still met by a margin of £10.2 billion.
7.29 In the third scenario, where in addition to the scenarios above, the remaining US trading partners retaliate, the nominal GDP level falls to a trough of 1.1 per cent of GDP below the central forecast in 2027-28 and is 1.0 per cent of GDP lower in the final year. CPI and RPI inflation are 0.6 percentage points higher than the central forecast in 2025-26, and there is a peak increase in the unemployment rate of 0.3 percentage points in 2026-27. The fiscal implications are that:
The current budget broadly tracks the path in the second scenario, also moving into a small surplus in 2029-30 so that the fiscal rule is barely met with a margin of £0.4 billion, rather than the £9.9 billion margin in the central forecast. Spending is higher by £2.8 billion (0.3 per cent of GDP) than in the central forecast in 2029-30 due to higher unemployment and inflation. Receipts are £6.8 billion lower in 2029-30 than in the central forecast but broadly unchanged from the second scenario, despite the lower nominal GDP. The latter is thanks to an additional £8.6 billion a year on average in UK tariff revenue, which offsets some of the £14.5 billion lost each year from domestic taxes.[83]
PSNFL is higher than the second scenario in every year and is 2.1 per cent of GDP above the central forecast in 2029-30, at 84.8 per cent of GDP. The supplementary target is met by a margin in 2029-30 of £9.8 billion. Despite the current budget broadly tracking the second scenario, the larger hit to nominal GDP means PSNFL is 0.3 per cent of GDP higher than in the second scenario by 2029-30.
Chart 7.8: Current budget deficit and PSNFL in the trade scenario
Annex A: Detailed tables
A.1 This annex contains summary tables providing a detailed breakdown of the economy and fiscal forecasts described in this Economic and fiscal outlook. We also include changes since our October 2024 Economic and fiscal outlook. These tables include:
a detailed summary of our economy forecast and key determinants of the fiscal forecast;
public sector current receipts and individual taxes;
contributions to total managed expenditure;
the main fiscal aggregates; and
sources of year-on-year changes in balance sheet aggregates.
Table A.1: Economy forecast
Percentage change on a year earlier, unless otherwise stated
Outturn
Forecast
2024
2025
2026
2027
2028
2029
UK economy
Gross domestic product (GDP)
0.9
1.0
1.9
1.8
1.7
1.8
GDP per capita
-0.1
0.3
1.5
1.4
1.3
1.4
GDP level (2019=100)
103.5
104.5
106.4
108.3
110.2
112.2
Nominal GDP
4.8
4.2
3.6
3.8
3.7
3.7
Output gap (per cent of potential output)
-0.3
-0.6
-0.2
0.0
0.0
0.0
Expenditure components of GDP
Domestic demand
2.1
1.0
1.7
1.9
1.9
1.8
Household consumption(1)
0.7
1.2
1.5
1.5
1.6
1.8
General government consumption
2.0
3.7
1.4
1.5
1.7
1.6
Fixed investment of which:
1.3
0.0
2.4
3.7
3.2
1.7
Business
0.8
-0.2
1.8
1.7
1.5
1.6
General government
3.9
4.8
1.9
2.5
-0.6
-1.3
Private dwellings(2)
0.2
-1.9
3.9
8.8
8.8
3.8
Change in inventories(3)
0.2
0.0
0.0
0.0
0.0
0.0
Exports of goods and services
-2.2
-0.1
1.4
0.6
0.5
0.8
Imports of goods and services
1.6
0.1
0.9
1.0
1.1
0.9
Balance of payments current account
Per cent of GDP
-2.8
-3.3
-3.4
-3.3
-3.3
-3.3
Inflation
CPI
2.5
3.2
2.1
2.0
2.0
2.0
RPI
3.6
4.1
3.2
3.0
2.9
2.8
GDP deflator at market prices
3.9
3.2
1.7
2.0
2.0
1.9
Labour market
Employment (million)
33.6
34.0
34.2
34.4
34.6
34.8
Productivity per hour
-1.0
0.2
1.1
1.2
1.3
1.3
Wages and salaries
5.8
5.2
2.8
2.6
2.6
3.0
Average earnings(4)
4.7
4.3
2.3
2.1
2.2
2.5
LFS unemployment rate (per cent)
4.3
4.5
4.3
4.2
4.1
4.1
Unemployment (million)
1.5
1.6
1.5
1.5
1.5
1.5
Household sector
Real household disposable income(1)
3.9
1.7
1.1
0.5
0.7
1.2
Saving ratio (per cent)(1)
9.8
10.2
9.8
8.9
8.1
7.5
House prices
1.3
2.8
2.5
2.6
2.5
2.4
World economy
World GDP at purchasing power parity
3.2
3.3
3.3
3.2
3.1
3.1
1) Includes households and non-profit institutions serving households.
2) Includes transfer costs of non-produced assets.
3) Contribution to GDP growth, percentage points.
4) Wages and salaries divided by employees.
Table A.2 – Economy forecast: changes since October
Percentage point difference, unless otherwise stated
Outturn
Forecast
2024
2025
2026
2027
2028
2029
UK economy
Gross domestic product (GDP)
-0.2
-1.0
0.0
0.2
0.2
0.2
GDP per capita
-0.3
-1.1
0.2
0.4
0.3
0.3
GDP level(1)
0.5
-0.5
-0.4
-0.2
0.0
0.2
Nominal GDP
0.9
-0.4
-0.3
0.3
0.2
0.2
Output gap (per cent of potential output)
0.0
-0.7
-0.6
-0.3
-0.1
0.0
Expenditure components of GDP
Domestic demand
0.8
-0.5
-0.2
0.1
0.2
0.1
Household consumption(2)
0.3
-0.4
-0.3
-0.2
-0.1
0.1
General government consumption
-1.0
-0.3
-0.2
-0.1
-0.1
-0.2
Fixed investment, of which:
1.5
1.6
-0.2
1.5
1.7
0.0
Business
1.3
1.0
1.3
0.4
0.2
-0.3
General government
1.8
5.5
-4.2
1.4
0.7
0.1
Private dwellings(3)
1.8
1.4
-0.8
3.4
5.0
0.1
Change in inventories(4)
0.3
-0.2
0.1
0.0
0.0
0.1
Exports of goods and services
-1.0
-0.7
0.9
0.2
0.0
0.1
Imports of goods and services
2.2
1.0
0.1
-0.1
0.1
-0.1
Balance of payments current account
Per cent of GDP
0.6
-0.2
-0.2
0.0
0.0
0.1
Inflation
CPI
0.0
0.6
-0.2
-0.1
-0.1
0.0
RPI
0.0
0.6
0.0
-0.1
-0.1
-0.1
GDP deflator at market prices
1.1
0.7
-0.3
0.0
0.0
-0.1
Labour market
Employment (million)
0.5
0.5
0.5
0.5
0.4
0.5
Productivity per hour
-1.0
-0.8
0.0
0.2
0.2
0.1
Wages and salaries
1.0
0.7
0.2
0.1
-0.1
0.1
Average earnings(5)
0.0
0.7
0.2
0.1
-0.1
-0.1
LFS unemployment rate
0.0
0.4
0.3
0.1
0.0
0.0
Unemployment (million)
0.0
0.2
0.1
0.1
0.0
0.0
Household sector
Real household disposable income(2)
1.5
-0.4
0.5
0.3
-0.2
0.0
Saving ratio(2)
-1.8
-1.6
-0.8
-0.3
-0.4
-0.5
House prices
-0.4
1.7
0.7
-0.1
-0.5
-0.6
World economy
World GDP at purchasing power parity
0.0
0.0
0.1
0.1
0.0
0.0
1) Per cent difference.
2) Includes households and non-profit institutions serving households.
3) Includes transfer costs of non-produced assets.
4) Contribution to GDP growth, percentage points.
5) Wages and salaries divided by employees.
Table A.3: Determinants of the fiscal forecast
Percentage change on previous year, unless otherwise stated
Growth over forecast
Outturn
Forecast
2023-24
2024-25
2025-26
2026-27
2027-28
2028-29
2029-30
GDP and its components
Real GDP
0.3
1.0
1.2
1.9
1.7
1.7
1.8
9.8
Nominal GDP(1)
6.4
4.5
4.1
3.6
3.8
3.7
3.7
25.9
Nominal GDP (£ billion)(1),(2)
2,752
2,877
2,994
3,101
3,220
3,339
3,464
712
Nominal GDP (centred end-March £bn)(1),(3)
2,813
2,934
3,046
3,160
3,279
3,401
3,528
716
Wages and salaries
7.6
6.1
4.3
2.6
2.6
2.7
3.1
23.3
Non-oil PNFC profits(4)
10.1
-1.0
-0.9
5.2
5.9
5.6
5.3
21.6
Consumer spending(4)
7.4
3.8
4.1
3.7
3.5
3.6
3.9
24.8
Prices and earnings
GDP deflator
6.1
3.8
2.6
1.7
2.0
1.9
1.9
14.8
RPI
7.5
3.3
4.2
3.1
3.0
2.8
2.8
20.8
CPI
5.7
2.3
3.2
1.9
2.0
2.0
2.0
14.2
Average earnings(5)
6.9
4.7
3.7
2.2
2.1
2.3
2.5
18.7
‘Triple-lock’ guarantee (September)
8.5
4.1
4.6
2.5
2.5
2.5
2.5
20.2
Key fiscal determinants
Employment (million)
33.3
33.7
34.0
34.2
34.4
34.6
34.9
1.5
Output gap (per cent of potential output)
0.0
-0.4
-0.5
-0.1
0.0
0.0
0.0
0.0
Financial and property sectors
Equity prices (FTSE All-Share index)
4,139
4,529
4,766
4,937
5,126
5,317
5,515
1,376
HMRC financial sector profits(1),(6)
12.6
0.4
0.9
4.0
4.2
4.2
3.9
18.8
Residential property prices(7)
-0.9
2.6
2.5
2.5
2.6
2.5
2.4
15.9
Residential property transactions (000)(8)
1,001
1,151
1,142
1,258
1,354
1,435
1,480
479
Commercial property prices(8)
-10.2
2.4
1.2
1.7
2.0
1.9
1.9
11.7
Commercial property transactions(8)
-3.2
3.3
-1.6
3.2
1.8
1.7
1.8
10.5
Oil and gas
Oil prices ($ a barrel)(4)
82.29
79.90
74.03
70.16
68.74
69.29
70.69
-11.60
Oil prices (£ a barrel)(4)
66.17
62.52
59.53
56.37
55.23
55.68
56.80
-9.38
Gas prices (£ a therm)(4)
0.99
0.85
1.29
1.07
0.85
0.87
0.89
-0.11
Oil production (million tonnes)(4)
33.4
30.7
28.6
26.6
24.7
23.0
21.4
-12.1
Gas production (billion therms)(4)
11.6
10.3
9.3
8.0
7.0
6.0
5.2
-6.4
Interest rates and exchange rates
Bank Rate (per cent)
5.0
4.9
4.0
3.8
3.8
3.8
3.8
-1.2
Market gilt rates (per cent)(9)
4.3
4.3
4.5
4.7
4.8
5.0
5.1
0.8
Euro/sterling exchange rate (€/£)
1.16
1.19
1.19
1.19
1.19
1.19
1.19
0.03
1) Non-seasonally adjusted.
2) Denominator for receipts, spending and deficit forecasts as a share of GDP.
3) Denominator for PSND and PSNFL as a share of GDP.
4) Calendar year.
5) Wages and salaries divided by employees.
6) HMRC Gross Case 1 trading profits; 2023-24 is forecast.
7) Outturn data from ONS House Price Index.
8) Outturn data from HMRC information on stamp duty land tax.
9) Weighted average interest rate on conventional gilts.
Table A.4: Determinants of the fiscal forecast: changes since October
Percentage point difference, unless otherwise stated
Outturn
Forecast
2023-24
2024-25
2025-26
2026-27
2027-28
2028-29
2029-30
GDP and its components
Real GDP
0.2
-0.5
-0.8
0.2
0.2
0.2
0.2
Nominal GDP1
-0.1
1.1
-0.7
-0.1
0.3
0.2
0.1
Nominal GDP (£ billion)(1),(2)
31.2
61.8
43.8
41.9
52.4
60.4
66.7
Nominal GDP (centred end-March £bn)(1),(3)
52.6
52.2
40.3
47.5
56.6
64.1
68.8
Wages and salaries
0.2
1.2
0.5
0.1
0.1
0.0
0.0
Non-oil PNFC profits(4)
8.6
0.1
-4.0
0.1
0.8
0.7
0.6
Consumer spending(4)
0.2
1.2
0.0
-0.4
-0.3
-0.2
0.1
Prices and earnings
GDP deflator
-0.1
1.4
0.3
-0.3
0.1
0.0
-0.1
RPI
0.0
0.0
0.7
-0.1
-0.1
-0.1
0.0
CPI
0.0
0.1
0.6
-0.2
-0.1
-0.1
0.0
Average earnings(5)
-0.4
0.1
0.8
0.1
0.0
-0.1
-0.1
‘Triple-lock’ guarantee (September)
0.0
0.1
0.3
0.0
0.0
0.0
0.0
Key fiscal determinants
Employment (million)
0.2
0.6
0.5
0.5
0.5
0.5
0.5
Output gap (per cent of potential output)
0.0
-0.2
-0.7
-0.5
-0.2
-0.1
0.0
Financial and property sectors
Equity prices (FTSE All-Share index)
0.0
-7.6
23.9
19.1
34.1
45.2
53.4
HMRC financial sector profits(1),(6)
0.9
0.8
-0.4
4.0
1.8
2.4
2.2
Residential property prices(7)
-0.1
0.1
1.6
0.4
-0.2
-0.5
-0.6
Residential property transactions (000s)(8)
-0.2
-13.5
15.8
16.7
33.5
60.0
68.5
Commercial property prices(8)
-0.9
2.9
-2.1
-0.1
0.2
0.0
-0.1
Commercial property transactions(8)
0.0
2.0
-3.2
1.3
-0.1
0.0
0.1
Oil and gas
Oil prices ($ a barrel)(4)
0.00
0.42
2.91
0.17
-0.72
-0.86
-0.84
Oil prices (£ a barrel)(4)
0.00
0.63
5.30
3.00
2.27
2.19
2.26
Gas prices (£ a therm)(4)
0.00
0.02
0.32
0.21
0.11
0.12
0.12
Oil production (million tonnes)(4)
0.0
0.4
0.7
0.8
0.9
0.8
0.9
Gas production (billion therms)(4)
0.0
0.2
0.2
0.3
0.3
0.1
0.0
Interest rates and exchange rates
Bank Rate (per cent)
0.0
0.1
0.1
0.2
0.2
0.2
0.3
Market gilt rates (per cent)(9)
0.0
0.2
0.4
0.4
0.5
0.5
0.5
Euro/sterling exchange rate (€/£)
0.00
0.01
0.01
0.01
0.01
0.01
0.01
1) Non-seasonally adjusted.
2) Denominator for receipts, spending and deficit forecasts as a share of GDP.
3) Denominator for PSND and PSNFL as a share of GDP.
4) Calendar year.
5) Wages and salaries divided by employees.
6) HMRC Gross Case 1 trading profits; 2023-24 is forecast.
7) Outturn data from ONS House Price Index.
8) Outturn data from HMRC information on stamp duty land tax.
9) Weighted average interest rate on conventional gilts.
Table A.5: Current receipts
£ billion
Outturn
Forecast
2023-24
2024-25
2025-26
2026-27
2027-28
2028-29
2029-30
Income tax(1)
277.4
310.0
330.7
356.0
378.5
385.3
398.1
of which:
Pay as you earn
239.0
266.2
283.6
295.8
307.2
317.2
328.8
Self assessment
42.7
49.7
53.3
61.9
68.4
72.0
76.2
Other income tax
-4.2
-5.9
-6.1
-1.8
2.8
-4.0
-6.8
National insurance contributions
179.1
167.8
200.6
206.9
212.9
219.5
226.2
Value added tax
168.9
171.3
180.4
187.5
195.8
202.7
211.1
Corporation tax(2)
90.8
95.6
99.4
103.4
108.0
112.8
118.1
of which:
Onshore
88.1
93.7
97.1
101.9
107.1
112.2
117.3
Offshore
2.7
1.9
2.3
1.5
0.9
0.7
0.8
Petroleum revenue tax
-0.4
-0.4
-0.3
-0.2
-0.1
-0.1
-0.1
Fuel duties
24.8
24.4
24.4
27.0
27.3
27.3
27.0
Business rates
29.3
31.8
33.7
37.3
37.6
38.2
39.2
Council tax
44.5
47.7
50.2
52.8
55.6
58.5
61.5
VAT refunds
28.1
29.2
31.6
32.2
33.3
34.0
34.9
Capital gains tax
14.5
13.3
19.7
19.4
20.2
23.1
25.5
Inheritance tax
7.5
8.4
9.1
10.0
11.7
13.3
14.3
Property transaction taxes(3)
12.8
15.0
15.7
18.8
21.6
24.4
26.5
Stamp taxes on shares
3.2
4.2
4.4
4.5
4.7
4.9
5.1
Tobacco duties
9.0
8.1
8.1
8.1
8.1
8.0
8.0
Alcohol duties
12.5
12.4
13.0
13.7
14.3
15.0
15.7
Air passenger duty
3.9
4.2
4.7
5.4
5.8
6.1
6.5
Insurance premium tax
8.4
8.9
9.2
9.3
9.5
9.7
9.9
Climate change levy
1.9
1.9
1.9
1.9
1.8
1.8
1.8
Bank levy
1.5
1.3
1.3
1.3
1.3
1.3
1.3
Bank surcharge
1.5
1.1
1.1
1.1
1.2
1.2
1.3
Apprenticeship levy
3.8
4.1
4.2
4.4
4.5
4.6
4.8
Digital services tax
0.7
0.8
0.9
1.0
1.1
1.1
1.2
Other HMRC taxes(4)
9.9
10.3
10.4
10.6
11.4
11.9
12.3
Vehicle excise duties
7.7
8.2
9.1
9.6
10.0
10.5
11.1
Licence fee receipts
3.7
3.8
3.9
4.0
4.1
4.1
4.2
Environmental levies
9.9
11.9
12.1
14.7
14.6
14.5
14.8
Emissions Trading Scheme
6.0
3.5
2.6
2.5
2.5
2.1
1.7
Energy profits levy
3.1
2.7
3.2
2.3
1.9
1.7
1.7
Electricity generator levy
1.2
1.0
0.7
0.1
0.0
0.0
0.0
Other taxes
11.1
13.5
15.5
15.6
16.0
16.4
16.7
National Accounts taxes
976.2
1,016
1,102
1,161
1,215
1,254
1,300
Interest and dividends
43.8
43.5
41.3
42.2
43.5
44.8
46.5
Gross operating surplus
75.9
79.3
83.5
85.8
88.9
91.8
94.4
Other receipts
2.6
2.7
3.1
3.3
3.4
3.6
3.6
Current receipts
1,099
1,141
1,229
1,292
1,351
1,394
1,445
Memo: UK oil and gas revenues(5)
5.4
4.2
5.2
3.6
2.6
2.3
2.3
1) Includes PAYE, self assessment, tax on savings income and other minor components, such as income tax repayments.
2) National Accounts measure, includes Pillar 2 taxes.
3) Includes stamp duty land tax, devolved property transaction taxes, and the annual tax on enveloped dwellings.
4) Consists of landfill tax (ex devolved), aggregates levy, betting and gaming duties, customs duties, diverted profits tax, soft drinks industry levy, residential property developer tax, the carbon border adjustment mechanism, vaping tax, and plastic packaging tax.
5) Consists of offshore corporation tax, petroleum revenue tax, and energy profits levy.
Table A.6: Current receipts: changes since October
£ billion
Outturn
Forecast
2023-24
2024-25
2025-26
2026-27
2027-28
2028-29
2029-30
Income tax(1)
0.0
-1.4
2.1
2.7
5.8
5.7
6.1
of which:
Pay as you earn
0.0
1.2
4.3
5.3
6.1
6.7
7.2
Self assessment
0.0
-3.5
-3.2
-3.5
-1.2
-2.0
-2.1
Other income tax
0.0
0.8
0.9
0.9
1.0
1.0
1.0
National insurance contributions
0.0
0.3
1.8
2.1
2.5
2.7
3.1
Value added tax
0.0
0.1
-0.8
-1.8
-2.4
-2.6
-2.6
Corporation tax(2)
-3.3
-5.5
-5.4
-4.9
-4.3
-4.1
-3.7
of which:
Onshore
-3.3
-5.5
-5.9
-5.1
-4.3
-4.0
-3.7
Offshore
0.0
-0.1
0.5
0.1
0.0
-0.2
0.0
Petroleum revenue tax
0.0
-0.1
0.0
0.0
0.0
0.0
0.0
Fuel duties
0.0
0.0
0.1
0.0
-0.1
-0.3
-0.4
Business rates
0.0
-0.3
-0.7
-0.1
-0.4
-0.5
-0.6
Council tax
0.0
0.0
0.2
0.2
0.3
0.4
0.4
VAT refunds
0.0
-1.2
-0.9
-1.0
-1.0
-1.2
-1.6
Capital gains tax
0.0
-2.4
-2.8
-2.6
-4.6
-5.1
-5.5
Inheritance tax
0.0
0.1
0.4
0.5
0.5
0.5
0.4
Property transaction taxes(3)
0.0
0.9
-0.5
0.3
0.7
1.1
1.1
Stamp taxes on shares
0.0
0.0
0.0
0.0
0.0
0.1
0.1
Tobacco duties
0.0
-0.6
-0.5
-0.5
-0.5
-0.5
-0.6
Alcohol duties
0.0
0.0
-0.1
-0.1
-0.2
-0.2
-0.2
Air passenger duty
0.0
0.0
0.0
-0.1
0.0
0.0
0.0
Insurance premium tax
0.0
0.1
0.1
0.1
0.1
0.1
0.1
Climate change levy
0.0
0.0
0.0
0.0
0.0
0.0
0.0
Bank levy
0.0
0.0
0.0
0.0
0.0
0.0
0.0
Bank surcharge
0.0
0.1
0.2
0.2
0.2
0.3
0.3
Apprenticeship levy
0.0
0.1
0.1
0.1
0.1
0.1
0.1
Digital services tax
0.0
0.1
0.1
0.1
0.1
0.1
0.1
Other HMRC taxes(4)
0.0
0.3
0.5
0.2
0.3
0.2
0.2
Vehicle excise duties
0.0
0.0
0.0
-0.1
-0.1
-0.1
-0.1
Licence fee receipts
0.0
-0.1
-0.1
-0.1
-0.1
-0.1
-0.1
Environmental levies
0.0
-0.1
-0.8
-0.5
0.3
0.1
-0.1
Emissions Trading Scheme
0.0
0.0
-0.1
0.1
0.2
0.2
0.1
Energy profits levy
0.4
-0.2
0.6
0.1
0.0
-0.1
0.3
Electricity generator levy
0.0
0.0
0.4
0.1
0.0
0.0
0.0
Other taxes
0.0
0.8
3.3
3.3
3.6
4.0
4.1
National Accounts taxes
-2.9
-9.1
-3.0
-1.4
1.2
0.6
1.2
Interest and dividends
-0.5
0.4
0.5
1.0
1.1
1.0
1.2
Gross operating surplus
1.2
1.2
2.3
1.9
2.0
2.2
2.3
Other receipts
0.0
0.1
0.3
0.3
0.4
0.4
0.4
Current receipts
-2.2
-7.5
0.0
1.8
4.7
4.3
5.1
Memo: UK oil and gas revenues(5)
0.4
-0.3
1.0
0.3
0.0
-0.3
0.3
1) Includes PAYE, self assessment, tax on savings income and other minor components, such as income tax repayments.
2) National Accounts measure, includes Pillar 2 taxes.
3) Includes stamp duty land tax, devolved property transaction taxes, and the annual tax on enveloped dwellings.
4) Consists of landfill tax (ex devolved), aggregates levy, betting and gaming duties, customs duties, diverted profits tax, soft drinks industry levy, residential property developer tax, the carbon border adjustment mechanism, vaping tax, and plastic packaging tax.
5) Consists of offshore corporation tax, petroleum revenue tax, and energy profits levy.
Table A.7: Total managed expenditure
£ billion
Outturn
Forecast
2023-24
2024-25
2025-26
2026-27
2027-28
2028-29
2029-30
Public sector current expenditure (PSCE)
PSCE in RDEL
422.7
450.7
481.0
498.0
513.3
528.3
543.7
PSCE in AME
670.3
681.8
710.6
731.3
752.2
777.0
807.4
of which:
Welfare spending
296.4
313.0
326.1
342.1
348.8
358.5
373.4
Locally financed current expenditure
62.3
66.5
68.9
70.5
73.6
77.2
81.1
Central government debt interest,
106.7
105.2
111.2
111.4
117.9
124.2
131.6
net of APF(1)
Scottish Government’s current spending
42.9
46.5
48.2
49.6
50.4
52.1
53.5
EU financial settlement
7.7
0.9
1.5
0.8
0.3
0.5
0.1
Unfunded public service pensions
5.1
1.6
-0.1
-0.4
-0.9
-2.4
-3.6
Company and other tax credits
9.7
10.4
11.1
11.3
11.6
12.0
12.3
BBC current expenditure
4.1
4.4
4.1
4.2
4.3
4.3
4.3
National Lottery current grants
1.2
1.4
1.4
1.3
1.2
1.2
1.2
General government imputed pensions
1.7
1.8
1.9
1.9
2.0
2.0
2.1
Public corporations’ debt interest
0.5
0.5
0.5
0.5
0.5
0.5
0.5
Non-domestic energy support
0.6
0.0
0.0
0.0
0.0
0.0
0.0
Domestic energy support
3.8
0.0
0.0
0.0
0.0
0.0
0.0
Funded public sector pension schemes
17.5
18.3
19.2
20.1
21.0
22.0
23.0
General government depreciation
58.2
62.3
66.5
68.8
71.5
74.1
76.5
Current VAT refunds
24.0
25.3
27.7
28.1
29.2
29.8
30.7
Environmental levies
12.1
13.2
13.3
15.9
15.9
15.8
16.1
Other PSCE items in AME
12.1
10.1
9.2
6.5
6.6
6.7
6.8
Other National Accounts adjustments
3.5
0.4
-0.4
-1.3
-1.5
-1.8
-2.3
Total public sector current expenditure
1,093.0
1,132.5
1,191.5
1,229.3
1,265.5
1,305.3
1,351.2
Public sector gross investment (PSGI)
PSGI in CDEL
96.6
102.9
111.3
118.0
124.1
125.3
126.9
PSGI in AME
40.4
43.2
44.4
42.2
41.2
40.8
41.0
of which:
Locally financed capital expenditure
9.8
10.3
9.4
8.5
8.4
8.3
8.4
Public corporations’ capital expenditure
13.9
13.9
13.0
13.9
14.1
14.3
14.4
Student loans
10.0
9.0
8.5
8.1
8.0
8.0
8.0
Funded public sector pension schemes
0.7
0.7
0.7
0.7
0.7
0.7
0.7
Scottish Government’s capital spending
5.7
5.8
6.3
6.5
6.8
6.9
7.0
Tax litigation
0.0
0.7
2.0
0.5
0.5
0.5
0.5
Other PSGI items in AME
1.2
2.6
4.4
3.7
2.5
2.0
1.8
Other National Accounts adjustments
-0.9
0.1
0.0
0.1
0.1
0.1
0.1
Total public sector gross investment
136.9
146.1
155.7
160.1
165.3
166.2
167.9
Less public sector depreciation
-65.2
-69.4
-74.1
-76.4
-79.1
-81.6
-83.9
Public sector net investment
71.7
76.6
81.5
83.7
86.2
84.5
84.0
Total managed expenditure
1,230
1,279
1,347
1,389
1,431
1,471
1,519
1) Includes increases in debt interest payments due to the APF.
Table A.8: Total managed expenditure: changes since October
£ billion
Outturn
Forecast
2023-24
2024-25
2025-26
2026-27
2027-28
2028-29
2029-30
Public sector current expenditure (PSCE)
PSCE in RDEL
0.0
-2.6
2.4
3.3
2.3
0.5
-1.9
PSCE in AME
5.2
0.7
6.3
5.6
6.1
4.6
5.6
of which:
Welfare spending
0.1
-0.5
-1.4
1.6
-0.7
-2.9
-4.3
Locally financed current expenditure
-1.2
0.9
0.7
-0.5
-0.5
-0.1
0.1
Central government debt interest,
0.0
0.3
5.5
3.2
4.9
6.3
9.4
net of APF(1)
Scottish Government’s current spending
0.0
-0.1
0.3
0.5
0.5
-0.3
-0.7
EU financial settlement
0.0
0.0
0.0
-0.2
0.0
0.0
0.0
Unfunded public service pensions
0.0
-0.1
-0.6
0.4
0.3
0.3
0.3
Company and other tax credits
0.0
-0.2
0.0
-0.1
0.0
0.1
0.1
BBC current expenditure
0.0
0.0
0.0
0.0
0.0
0.0
0.0
National Lottery current grants
0.0
0.0
0.0
0.0
0.0
0.0
0.0
General government imputed pensions
0.0
0.0
0.0
0.0
0.0
0.0
0.0
Public corporations’ debt interest
0.0
0.0
0.0
0.0
0.0
0.0
0.0
Non-domestic energy support
0.0
0.0
0.0
0.0
0.0
0.0
0.0
Domestic energy support
0.0
0.0
0.0
0.0
0.0
0.0
0.0
Funded public sector pension schemes
-0.1
0.0
0.0
0.0
0.0
0.0
0.0
General government depreciation
0.0
-0.3
1.1
0.9
1.0
1.1
1.1
Current VAT refunds
0.0
-1.2
-0.8
-0.7
-0.7
-0.9
-1.2
Environmental levies
0.0
-0.1
-0.8
-0.4
0.4
0.2
0.0
Other PSCE items in AME
0.1
0.2
0.7
0.0
0.0
0.0
-0.1
Other National Accounts adjustments
6.4
1.6
1.6
0.9
0.9
0.9
0.8
Total public sector current expenditure
5.2
-1.9
8.7
8.8
8.4
5.1
3.7
Public sector gross investment (PSGI)
PSGI in CDEL
0.0
3.9
0.0
0.8
3.4
3.9
4.4
PSGI in AME
2.1
0.4
3.4
0.8
0.9
0.7
0.5
of which:
Locally financed capital expenditure
1.2
1.7
2.1
0.5
0.4
0.1
-0.1
Public corporations’ capital spending
1.3
1.3
0.4
1.3
1.4
1.5
1.5
Student loans
0.0
-0.1
0.1
0.2
0.2
0.2
0.1
Funded public sector pension schemes
0.1
0.0
0.0
0.0
0.0
0.0
0.0
Scottish Government’s capital spending
0.1
0.0
0.1
0.0
0.1
0.1
0.1
Tax litigation
-0.8
-1.2
1.5
0.0
0.0
0.0
0.0
Other PSGI items in AME
0.0
-0.1
0.2
0.1
0.1
0.1
0.1
Other National Accounts adjustments
0.2
-1.1
-1.1
-1.2
-1.3
-1.3
-1.4
Total public sector gross investment
2.1
4.3
3.4
1.6
4.3
4.6
4.8
Less public sector depreciation
0.0
-0.3
1.3
1.1
1.2
1.3
1.4
Public sector net investment
2.1
4.6
2.1
0.5
3.1
3.3
3.5
Total managed expenditure
7.3
2.4
12.1
10.5
12.7
9.8
8.6
1) Includes increases in debt interest payments due to the APF.
Table A.9: Fiscal aggregates
Per cent of GDP
Outturn
Forecast
2023-24
2024-25
2025-26
2026-27
2027-28
2028-29
2029-30
Receipts and expenditure
Public sector current receipts (a)
39.9
39.7
41.1
41.7
41.9
41.7
41.7
National Accounts taxes
35.5
35.3
36.8
37.4
37.7
37.5
37.5
Total managed expenditure (b)
44.7
44.4
45.0
44.8
44.4
44.1
43.9
Public sector current expenditure (c)
39.7
39.4
39.8
39.6
39.3
39.1
39.0
Public sector net investment (d)
2.6
2.7
2.7
2.7
2.7
2.5
2.4
Depreciation (e)
2.4
2.4
2.5
2.5
2.5
2.4
2.4
Fiscal mandate and supplementary target
Current budget deficit (c+e-a)
2.2
2.1
1.2
0.4
-0.2
-0.2
-0.3
Public sector net financial liabilities(1)
81.0
81.9
82.9
83.5
83.4
83.2
82.7
Other deficit measures
Public sector net borrowing (b-a)
4.8
4.8
3.9
3.1
2.5
2.3
2.1
Cyclically adjusted net borrowing
5.0
4.6
3.6
3.0
2.5
2.3
2.1
Cyclically adjusted current budget deficit
2.4
1.9
0.9
0.3
-0.2
-0.2
-0.3
Primary deficit
1.7
1.9
0.9
0.2
-0.5
-0.8
-1.0
Cyclically adjusted primary deficit
2.0
1.8
0.6
0.0
-0.5
-0.8
-1.0
Financing
Central government net cash requirement
5.7
6.0
4.8
4.2
4.1
4.1
3.2
Public sector net cash requirement
2.3
4.5
2.4
3.8
4.1
4.1
3.1
Alternative balance sheet metrics
Public sector net debt(1)
95.5
95.9
95.1
95.8
96.1
96.3
96.1
Public sector net debt ex Bank of England(1)
87.0
89.9
92.0
93.4
94.2
94.8
95.0
Public sector net worth (inverted)(1)
70.6
68.9
69.7
70.0
69.7
69.6
69.1
International comparisons(2)
General government net borrowing (GGNB)
5.6
5.5
4.6
3.9
3.3
3.1
2.8
Cyclically adjusted GGNB
6.0
5.4
4.2
3.7
3.2
3.1
2.8
General government gross debt
98.9
101.3
103.2
104.7
105.4
105.8
105.9
£ billion
Current budget deficit
61.1
60.7
36.1
13.4
-6.0
-7.1
-9.9
Public sector net investment
71.7
76.6
81.5
83.7
86.2
84.5
84.0
Public sector net borrowing
131.3
137.3
117.7
97.2
80.2
77.4
74.0
Cyclically adjusted net borrowing
137.2
131.8
107.8
92.2
79.4
77.4
74.0
Cyclically adjusted current budget deficit
67.0
55.1
26.3
8.4
-6.8
-7.1
-9.9
Public sector net financial liabilities
2,278
2,404
2,526
2,639
2,734
2,828
2,919
Public sector net debt
2,686
2,813
2,897
3,026
3,152
3,274
3,391
Public sector net debt ex Bank of England
2,446
2,637
2,801
2,952
3,088
3,223
3,351
Net debt interest
82.5
81.3
90.6
90.7
96.9
103.0
109.6
Non-interest receipts
1,055
1,098
1,188
1,250
1,307
1,349
1,398
Memo: output gap (per cent of GDP)
0.0
-0.4
-0.5
-0.1
0.0
0.0
0.0
1) Position at end-March; GDP centred on end-March.
2) Calendar year basis.
Table A.10: Fiscal aggregates: changes since October
Per cent of GDP
Outturn
Forecast
2023-24
2024-25
2025-26
2026-27
2027-28
2028-29
2029-30
Receipts and expenditure
Public sector current receipts (a)
-0.1
-0.4
0.1
0.2
0.2
0.1
0.1
National Accounts taxes
-0.1
-0.5
0.0
0.1
0.1
0.0
0.0
Total managed expenditure (b)
0.2
-0.1
0.5
0.5
0.4
0.3
0.2
Public sector current expenditure (c)
0.2
-0.2
0.4
0.4
0.3
0.1
0.0
Public sector net investment (d)
0.1
0.2
0.1
0.0
0.1
0.1
0.1
Depreciation (e)
0.0
0.0
0.1
0.0
0.0
0.0
0.0
Fiscal mandate and supplementary target
Current budget deficit (c+e-a)
0.3
0.2
0.3
0.3
0.2
0.1
0.0
Public sector net financial liabilities(1)
-0.7
-0.2
0.6
0.7
0.7
0.7
0.7
Other deficit measures
Public sector net borrowing (b-a)
0.3
0.3
0.4
0.3
0.3
0.2
0.1
Cyclically adjusted net borrowing
0.3
0.2
0.0
-0.1
0.0
0.1
0.1
Cyclically adjusted current budget deficit
0.3
0.1
-0.1
-0.1
-0.1
0.0
0.0
Primary deficit
0.3
0.3
0.2
0.2
0.1
0.0
-0.1
Cyclically adjusted primary deficit
0.3
0.3
-0.2
-0.2
-0.1
-0.1
-0.2
Financing
Central government net cash requirement
0.0
0.2
0.3
0.5
0.4
0.3
0.2
Public sector net cash requirement
1.1
-0.1
0.2
0.8
0.4
0.3
0.1
Alternative balance sheet metrics
Public sector net debt(1)
-1.0
-0.8
-0.1
0.5
0.6
0.6
0.6
Public sector net debt ex Bank of England(1)
-0.7
-0.3
0.4
0.6
0.8
0.8
0.9
Public sector net worth (inverted)(1)
1.7
0.6
1.6
2.0
2.2
2.4
2.4
International comparisons(2)
General government net borrowing (GGNB)
0.2
0.3
0.4
0.4
0.3
0.2
0.2
Cyclically adjusted GGNB
0.2
0.3
0.1
-0.1
0.1
0.1
0.1
General government gross debt
0.1
-0.2
0.9
1.6
1.6
1.6
1.6
£ billion
Current budget deficit
8.8
5.2
10.0
8.2
4.9
2.2
0.0
Public sector net investment
2.1
4.6
2.1
0.5
3.1
3.3
3.5
Public sector net borrowing
9.5
9.8
12.1
8.7
8.0
5.5
3.5
Cyclically adjusted net borrowing
9.5
7.5
0.0
-3.3
1.4
2.3
2.7
Cyclically adjusted current budget deficit
8.8
2.9
-2.1
-3.8
-1.7
-1.0
-0.8
Public sector net financial liabilities(1)
-7.0
-3.6
7.2
16.8
24.0
29.3
32.9
Public sector net debt
-14.0
-23.0
-15.8
8.1
18.7
25.8
30.4
Public sector net debt ex Bank of England
-6.4
-7.5
1.7
13.9
25.2
32.9
37.8
Net debt interest
1.3
-0.2
5.1
2.2
3.9
5.5
8.6
Non-interest receipts
-1.7
-7.4
-0.4
0.8
3.6
3.4
4.3
Memo: output gap (per cent of GDP)
0.0
-0.2
-0.7
-0.5
-0.2
-0.1
0.0
1) Position at end-March; GDP centred on end-March.
2) Calendar year basis.
Note: Unless otherwise stated, the October 2024 forecast as a share of GDP has been restated to account for revised nominal GDP data in the 2024 Blue Book.
Table A.11: Sources of year-on-year changes in balance sheet aggregates
£ billion
Forecast
2024-25
2025-26
2026-27
2027-28
2028-29
2029-30
Public sector net borrowing (a)
137.3
117.7
97.2
80.2
77.4
74.0
PSNFL valuation changes (b)
-11.5
3.9
15.8
15.3
16.5
17.0
Asset purchase facility
5.8
4.4
7.0
7.1
7.4
8.0
DMO gilt premia
10.7
2.8
2.0
2.1
2.2
1.9
Reserve assets
-7.9
0.1
0.0
0.0
0.0
0.0
Funded pensions
-20.7
-4.3
4.0
3.0
3.7
3.8
Other
0.7
0.8
2.9
3.2
3.2
3.3
Public sector net financial liabilities (a+b)
125.8
121.6
113.0
95.4
93.9
91.0
Remove valuation of assets not in PSND (c)
20.0
3.5
-6.8
-6.1
-6.9
-7.1
Funded pensions
20.7
4.3
-4.0
-3.0
-3.7
-3.8
Other
-0.7
-0.8
-2.9
-3.2
-3.2
-3.3
Net acquisition of financial assets (d)
-43.3
-63.0
7.0
20.0
19.8
19.6
DEL net lending
2.1
2.2
3.4
3.5
3.4
3.6
Student loan outlays
13.8
15.7
17.2
18.3
19.3
20.2
Student loan repayments
-5.5
-6.1
-6.6
-7.1
-7.8
-8.5
National Wealth Fund
0.8
1.8
2.0
2.1
2.0
2.0
UK Export Finance
0.4
0.5
1.1
1.2
1.0
0.2
NWG shares
-6.6
-3.1
0.0
0.0
0.0
0.0
Term funding scheme
-50.7
-76.3
-12.3
0.0
0.0
0.0
Other
2.2
2.2
2.3
2.0
1.8
2.2
Cash flow timing effects (e)
24.5
22.5
15.9
16.6
14.7
14.1
Student loan interest
9.1
7.6
7.8
8.1
8.0
8.4
Other receipts
9.3
13.2
7.9
9.5
8.8
9.0
Funded public pension schemes
-0.5
0.4
0.6
0.6
0.5
0.4
Gilt accruals
3.4
2.2
2.2
1.7
0.9
-0.1
Guarantee schemes write offs
2.5
1.7
1.0
0.4
0.2
0.2
Other expenditure
0.7
-2.6
-3.7
-3.7
-3.7
-3.7
Public sector net debt (a+b+c+d+e)
127.0
84.6
129.1
125.8
121.5
117.6
Table A.12 : Sources of year-on-year changes in balance sheet aggregates: changes since October
(1) The LFS gets reweighted to a new population base with a time lag compared to ONS outturn population estimates and population projections. This means that revisions across these series can differ. In the latest ONS population projections, published in January 2025, the total and adult populations for 2024 were 201,000 and 130,000 higher, respectively, compared to the previous projections, published in January 2024.
(2) Due to the change in the ONS base year, the levels are not directly comparable to our October forecast. Where the series are not directly comparable, all levels comparisons in this chapter are made by indexing both series to the final quarter of 2019 (for quarterly series) or to 2019 (for annual series).
(3) We hold the effective exchange rate constant in nominal terms across the forecast.
(4) In future work, we intend to review our fiscal multipliers, including by assessing the extent to which the profile of growth over 2024 and 2025 can be attributed to the changes in the fiscal stance and to policy decisions set out in recent Budgets.
(5) Labour supply is a function of the size of the population, the proportion of the population willing and able to work (the participation rate), the sustainable share of participants in the labour market that are able to find work (one minus the equilibrium unemployment rate), and the average number of hours those in employment can sustainably work.
(6) The reweighted LFS estimates that were published in December 2024 were not able to include the latest revisions to migration data which were published in November 2024.
(7) ONS, National population projections, migration assumptions: 2022-based, January 2025.
(8) There is evidence suggesting the LFS may be underestimating the employment and participation rate due to ongoing issues including low survey sample size, although the latest reweighting has helped to close around half of the gap with other measures. For more information see: Resolution Foundation, Get Britain’s Stats Working: Exploring alternatives to Labour Force Survey estimates, November 2024, and Box E in the Bank of England’s February 2025 Monetary Policy Report.
(9) Compared to October, the outturn and forecast changes to total population and adult population are different. The total population was revised up by 0.3 per cent in 2024, while cumulative growth over the forecast is 0.4 percentage points lower, mainly due to lower births and slightly more deaths. The total population in 2029 is therefore 0.1 per cent lower than in our October forecast.
(10) Our measure of earnings growth is derived from the ONS National Accounts measure of wages and salaries divided by LFS employees. It is conceptually similar to the ONS average weekly earnings whole-economy total pay. While there can be short-term divergences between these measures, over the longer term they tend to reflect similar trends.
(11) We present RHDI on a fiscal year basis, rather than using calendar years, to reflect the timing of key policy drivers.
(12) See Box 2.4 of our March 2024 Economic and fiscal outlook.
(13) Bank of England, Monetary Policy Report, February 2025.
(14) This includes our March 2017 Economic and fiscal outlook, when a negligible forecast deterioration was met by a negligible fiscal tightening, and March 2021, when the policy package included medium-term tax rises to bolster the public finances in the aftermath of the pandemic.
(15) DWP, Pathways to Work: Reforming Benefits and Support to Get Britain Working Green Paper, March 2025.
(16) As in Table 3.1, the figures in this paragraph include the consequences of decisions on the block grant adjustment (BGA). The figures for individual measures that follow below do not. The costings for measures affecting disability benefits are on an England and Wales basis, and the costings for incapacity benefits are on a Great Britain basis.
(17) These welfare savings are funded via a £0.4 billion increase in DEL spending. As DWP’s full DEL settlement has not been agreed beyond 2025-26, we requested additional information from the Government to satisfy ourselves that this funding would be additional to baseline activity. We were advised that departmental funding allocations remain subject to the completion of Phase 2 of the Spending Review, which will set out DWP’s DEL budget for 2026-27 to 2028-29 for RDEL, and to 2029-30 for CDEL. We received confirmation that the Government is committed to ensuring in Phase 2 that DWP is adequately resourced to deliver commitments on reducing fraud and error in the welfare system and delivering the scored Green Paper reforms.
(18) The standard allowance is paid at four different rates depending on whether families are single or couples and whether adults are under 25 or not. For working families it is tapered away as earnings rise, along with any other elements.
(19) This static cost includes around 30,000 working families becoming newly eligible and taking up UC (or those already within the UC system who move from having an award of zero to a small positive award) due to UC awards tapering off at a higher level of earnings.
(20) The measure was costed on the basis of the removal of the WCA descriptors change, discussed below, already being in place. This means that the LCWRA caseload is around 400,000 higher than in the pre-measures baseline. The calculation of the average reduction in UC awards as a result of the measure excludes the behavioural increase in PIP spending from the measure’s cost.
(21) The Autumn 2023 policy (which will now not be implemented) incorporated the removal of the ‘mobilising’ descriptor (that enables entry into the LCWRA caseload), the amendment of the ‘substantial risk’ descriptor (that enables entry into the LCWRA caseload), and the amendment of the ‘getting about’ descriptor (that enables entry into the ‘limited capability for work’ (LCW) caseload). Our pre-measures forecast accounted for a delay to the introduction of the WCA descriptors changes by nine months in response to the judicial ruling which found that the consultation on the changes was not lawful. This was on the basis that prior to its decision to reverse the 2023 reforms, the Government had been planning to re-run the consultation.
(22) We assume that the behavioural response from the standard and enhanced rate of the daily living component is proportional to the size of their respective static impacts.
(23) As discussed in Box 3.1, our economy forecast reflects the share of changes in spending that is spent domestically. We have assumed that 85 per cent of the change in defence spending will be spent domestically, while only 5 per cent of the change in ODA spending would have been.
(24) This does not include the impact of measures which target tax debt as these do not directly reduce the tax gap. Debt management measures both accelerate the collection of tax debt and reduce amounts that would otherwise be lost through write-off or remission. Only the latter reduces the tax gap. HMRC does not currently have an estimate for the split of debt collections between these two categories, so we have excluded debt measures from Chart 3.3. The difference between the counterfactual and estimated tax gap shown therefore underestimates the total effect of compliance and debt collection measures on the tax gap over the medium term.
(25) MHCLG, National Planning Policy Framework, December 2024.
(26) To deliver this increase in net additions, it is likely that continued government effort will be required to overcome constraints in delivery and local opposition. For instance, as discussed in paragraph 3.56, the Planning and Infrastructure Bill (PIB) contains several such measures, such as reforms to planning committees and planning fees, the introduction of spatial development strategies, compulsory purchase reform, and strengthening development corporations.
(27) This captures the effect of the additional residential investment and transfer costs associated with housebuilding on excess demand. The part of the increased housebuilding which is met by an increase in the supply capacity of the economy is described in paragraph 3.41 and shown in the green bars in chart 3.5.
(28) Improvements to the land underlying residential sites lead to increases in its value. There is therefore a significant premium on land which is granted planning permission for residential use, relative to other uses (see MHCLG, Land value estimates for policy appraisal, 2019). This land value uplift is captured not only by the initial landowners, but also by developers and the public sector. While the precise split of land value capture across these parties is likely to vary depending on the site, some estimates suggest that around half is realised by the developer rather than by the initial landowner as a capital gain (see HCLG Committee Report, Land value capture, 2018).
(29) To calculate the percentage change in house prices in response to percentage changes in the supply of houses, we have used an elasticity of around 1.7, which falls within the ranges of external evidence surveyed in Auterson, T., OBR working paper No.6: Forecasting house prices, 2014, and Mulheirn, I., Tackling the UK housing crisis: is supply the answer?, 2019. See also: Miles, D., and V., Munroe, UK house prices and three decades of decline in the risk-free real interest rate, 2021.
(30) See, in particular: Duranton, G., and D. Puga, Micro-Foundations of Urban Agglomeration Economies, Handbook of Urban and Regional Economics, Vol. 4, 2004; and Combes, P., et al. The productivity advantages of large cities: Distinguishing agglomeration from firm selection, Econometrica, 2018, which uses French firm-level data and finds the productivity advantages of cities are not entirely due to firm selection, suggesting significant agglomeration effects. In contrast, another recent study finds relatively small agglomeration effects from constraining US cities to no more than 1 million citizens, between 1900 and 2010; see Turner, M., and D. Weil, Are big cities important for economic growth?, NBER Working Paper, 2025. In the UK, the Resolution Foundation estimates that planning reform could add up to 0.14 percentage points to annual GDP growth, of which 0.04 percentage point is attributable to agglomeration and 0.07 percentage points labour mobility; see Fry, E., and G. Thwaites, The growth mindset: Sizing up the Government’s growth agenda, 2024.
(31) Although the uncertainty around our estimate of it is relatively high, we do expect a small boost to growth from labour mobility and agglomeration to occur as a result of these reforms. As this channel is likely to have a negligible effect over the next five years, and assessing its additionality relative to our pre-policy forecast is less straightforward than for the other channels modelled, we did not make an explicit adjustment for it in our central five-year forecast.
(32) Canada and Mexico have not yet ratified the UK’s accession to the partnership, meaning that the UK will not be able to trade with these countries under these rules until they do ratify the UK’s accession. We therefore have not yet included any impacts relating to Canada and Mexico in our forecast but continue to treat these as an upside risk.
(33) Department for Business and Trade, Impact assessment of the UK’s accession to the CPTPP, 2024.
(34) See our online Policy costings uncertainty ratings database for a measure-by-measure breakdown of uncertainty ratings for all policy costings from this event.
(35) We also implement the ONS ruling that the new Bank of England levy is a tax.
(36) See Van Geest, L., External Review of the Office for Budget Responsibility, February 2025.
(37) See Brightmine, Pay trends 2025 March report, March 2025.
(38) This is the case in the Bank of England’s Agents’ pay survey and their Decision Maker Panel survey (see Box D in Bank of England, Monetary Policy Report, February 2025), and in the CIPD’s survey (see Chartered Institute of Personnel and Development, Labour Market Outlook Winter 2024-25, February 2025).
(39) The 2024 Blue Book’s 1.2 per cent upward revision to the level of nominal GDP in the second quarter of 2024 was not included in the October forecast. We have now incorporated this revision into the forecasts which mechanically reduces the level of receipts as a share of GDP, but otherwise does not affect the path of the forecast. For the purposes of comparison, this chapter therefore rebases the October 2024 forecast with the higher level of nominal GDP unless otherwise stated.
(40) The updated Temporary Repatriation Facility (TRF) provides a three-year window for some formerly non-domiciled taxpayers to bring stockpiled offshore income and gains to the UK at a discounted tax rate. This will temporarily boost income tax receipts from 2026-27 to 2028-29.
(41) In-year estimates for 2024-25 are based on ONS outturn data for April 2024 to January 2025. We incorporated some administrative cash receipts data for February on self-assessment for the days after the January 31 deadline and mid-month corporation tax.
(42) This was costed on a net basis in the autumn for SA as a whole (see paragraphs 3.14-3.19 of the October 2024 EFO), however the movement of receipts between CGT and IT was not included in the forecast, hence the difference at this event.
(43) This forecast includes the downward adjustment to historic VAT receipts included in the ONS’s March Public Sector Finances (PSF) publication arising from improvements to HMRC’s methodology for identifying VAT payments. This change has decreased 2024-25 receipts to February by £0.7 billion, 2023-24 by £0.5 billion, and 2022-23 receipts by £1.7 billion.
(44) The 2024 Blue Book’s 1.2 per cent upward revision to the level of nominal GDP in the second quarter of 2024 was not included in the October forecast. We have now incorporated this revision into the forecasts which mechanically reduces the level of spending as a share of GDP, but otherwise does not affect the path of the forecast. For the purposes of comparison, this chapter therefore restates the October 2024 forecast with the higher level of nominal GDP unless otherwise stated.
(45) This £4.8 billion includes consequences of decisions for the Scottish block grant adjustment. As block grant adjustments are not included in our welfare AME forecast, these consequences are not included in our presentation of policy impacts in the welfare spending section of this chapter.
(46) The change in PSCE in RDEL since October 2024 reported here is higher than the number reported in Chapter 3, because in addition to policy measures it also includes the reclassification of extended producer responsibility revenues from a fee received within DEL to a tax (which boosts receipts and DEL spending equally).
(47) More formally, unless otherwise stated these terms refer, respectively, to public sector current expenditure (PSCE) in RDEL and public sector gross investment (PSGI) in CDEL, which is the spending within DELs that is recorded within the National Accounts measure of total managed expenditure.
(48) The Government further confirmed that it will update the definition of defence spending to “recognise what security and intelligence agencies do to boost our security”. Under this wider definition, the UK would spend 2.6 per cent of GDP on defence in 2027-28.
(49) Departments publish estimates of their expenditure twice a year. Main Supply estimates are made shortly after the start of the financial year in the summer. Near-final estimates of total year spend are made by departments towards the end of the financial year and usually published in February as Supplementary Estimates, which are the final spending plans approved by Parliament for that year.
(50) The DEL allocated for tax compliance is discussed in paragraph 3.34 and set out in Table 3.5 of Chapter 3.
(51) This figure includes the Barnett consequentials – changes to the devolved administrations funding allocations – because of UK Government DEL allocations.
(52) The ‘reserve stack’ provides details by department of in-year pressures on DEL budgets with an indication of uncertainty and level of agreement from the Chief Secretary to the Treasury (CST). This product has been in place since the 2022 Spring Statement. These percentages compare the level of claims on the reserve as agreed by the CST.
(53) The £2.3 billion increase in non-PSGI spending largely reflects the Department for Energy, Security and Net Zero’s (DESNZ’s) receipt of financial transaction (non-PSGI) income from profits made by Bulb, which it then surrendered to the reserve.
(54) The October 2024 version of this table excluded one-off items when calculating the annual growth rates. These adjustments have not been used in this table and these figures should not be directly compared to the October 2024 figures.
(55) For forecasting purposes, the £2.0 billion in the transformation fund consists of £1.8 billion RDEL and £0.2 billion Scottish Government current AME.
(56) For the NHS and schools, where the Government will set spending paths at the upcoming Spending Review, we continue to use our October 2024 assumptions.
(57) 2.8 per cent is based on the affordability remit most departments provided to the public sector Pay Review Bodies for 2025-26 pay awards.
(58) Here the costs or savings of policy measures exclude the consequences of decisions for the block grant adjustment.
(59) We forecast spending by local authorities by projecting their various sources of income – including grants from central government together with local sources, such as council tax, retained business rates and trading income – and the extent to which they use that income by varying their reserves or borrowing. Our forecast therefore encompasses spending financed by grants, which is mostly in DELs, and locally financed expenditure, discussed in this section, which is in AME.
(60) Ministry of Housing, Communities and Local Government, Exceptional Financial Support for local authorities, February 2025.
(61) Locally financed capital expenditure is measured net of capital spending by authorities’ housing revenue accounts and Transport for London’s subsidiaries – in both cases these are treated as public corporations in the National Accounts. In the table we therefore group locally financed and public corporations’ capital expenditure together, abstracting from any switches between the two sectors. All of these forecasts are net of asset sales.
(62) Local Government Association, Housing Revenue Account research update, October 2024.
(63) The 2024 Blue Book’s 1.2 per cent upward revision to the level of nominal GDP in the second quarter of 2024 was not included in the October forecast. We have now incorporated this revision into the forecasts which mechanically reduces the level of borrowing and other fiscal aggregates as a share of GDP, but otherwise does not affect the path of the forecast. For the purposes of comparison, this chapter therefore restates the October 2024 forecast with the higher level of nominal GDP unless otherwise stated.
(64) This reflects the Monetary Policy Committee’s (MPC’s) stated intention at its September 2024 meeting (Table 6.3). See Bank of England, September 2024 Monetary Policy Report, September 2024.
(65) This is based on the average active sales seen in the year to September 2023 and the year to September 2024. Our assumption of a constant pace of active sales is based on guidance issued by the MPC in August 2023 that ‘sales must be conducted in a relatively gradual and predictable manner over a period of time’.
(66) HM Treasury, Asset Purchase Facility (APF) ceiling, November 2024.
(67) Our forecast also assumes that the APF draws on its cash reserves to cover some of its losses, as agreed between the Treasury and the Bank of England. We assume these payments are made such that the APF’s cash reserves remain constant as a share of the overall value of gilts held in the APF.
(68) The estimate is less sensitive to the pace of rundown than to changes in Bank Rate and gilt yields. Were the APF to unwind at a faster pace than expected, the overall effects on both PSND and PSNFL would likely be modest. Higher capital losses (due to more gilts being sold or redeemed for below their initial purchase price) would offset lower interest losses (due to Bank Rate acting on a smaller stock of gilts).
(69) PSND ex BoE records the capital grant paid from the Treasury to the APF to cover its interest losses and the capital losses incurred when gilts held within it are sold or redeemed. PSND records the losses made by the APF which appear on the Bank of England’s balance sheet. It captures the interest losses of the APF, but only records the losses incurred by the sale of gilts from the APF for a price lower than their redemption price (the price at which they were booked in PSND upon their issuance).
(70) We invert PSNW to make it more comparable to other balance sheet metrics. An increase in inverted PSNW represents a deterioration in the public finances, similar to an increase in PSND and PSNFL.
(71) The Government states in the Charter that: ”this range will support the government’s commitment to a single fiscal event every year by avoiding the need for policy adjustment at forecasts outside of fiscal events”.
(72) The figures are calculated using the revisions from our Forecast revisions database.
(73) This includes our March 2017 Economic and fiscal outlook, when a negligible forecast deterioration was met by a negligible fiscal tightening, and March 2021, when the policy package included medium-term tax rises to bolster the public finances in the aftermath of the pandemic.
(74) See Box 4.3 of the March 2024 Economic and fiscal outlook for more on the sensitivity and volatility of debt interest spending.
(76) Public sector net debt excluding the Bank of England is often used as a measure of underlying debt to remove the distortions of the Bank of England’s Term Funding Scheme and other schemes.
(77) Latest outturn and forecast data for nominal GDP is used for constructing all forecasts. This removes the influence of historic revisions to GDP by ONS. Given this, the paths of the forecast for PSND ex BoE as a share of GDP have been restated, consistent with the nominal GDP in this forecast such that it differs to the forecast at the time.
(78) From our October 2021 Economic and fiscal outlook, we changed the method for calculating the probability of the fiscal mandate being met to fan charts based on stochastic simulations. Further information on this approach is set out in our Working paper No.17: Evaluating forecast uncertainty with stochastic simulations, December 2021.
(79) This is based on internal estimates for the historic level of PSNFL, with the series from ONS beginning on a financial year basis from 1997-98.
(80) On our website we publish ready-reckoners that show the typical impact of changes in key economic determinants on spending and receipts as embodied in our forecast models. The actual impact of any of the changes we consider will depend on other factors such as the state of the economy at the time and the reaction of policymakers, notably the Monetary Policy Committee.
(81) In both scenarios we assume nominal departmental spending is unchanged from the central forecast.
(82) As in the productivity scenario, in all three trade scenarios we do not include any adjustments made by government to departmental spending as a result of changes in the nominal economy or inflation.
(83) The static tariff revenue estimate is calculated as the level of goods imports to the UK from the United States multiplied by a tariff rate of 20 per cent. From this we establish a behavioural response by multiplying this 20 per cent tariff rate by our estimated -2.3 price elasticity for UK imports to reach a post-behavioural tariff revenue. This is then grown in line with our forecast for customs duties so that the tariff revenue reaches £9.1 billion in 2029-30.