
Box sets » Receipts » VAT

The tax gap is the difference between taxes collected by HMRC and the theoretical liability, or what, in theory, should be collected. As a share of GDP, it has reduced from 2.3 per cent in 2005-06 to 1.5 per cent in 2021-22, two-thirds of which is explained by reductions in the VAT gap. In this box, we explored the recent drivers of changes in tax gaps, explained what assumptions we make about tax gaps in our forecast and outlined the associated uncertainties.
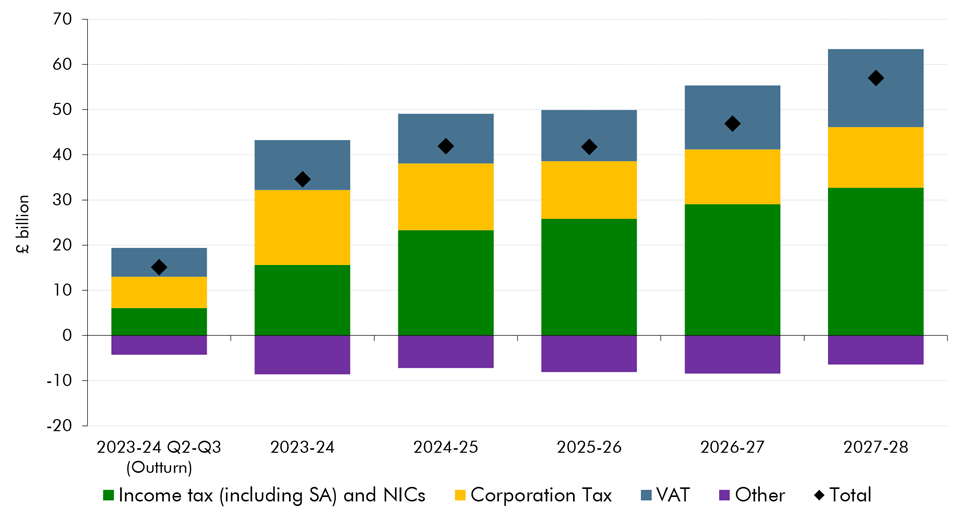
We have made a significant upward revision to our pre-measures receipts forecast. This box explored the drivers behind the revision, which taxes drive the revision and how much of this change is due to real GDP, inflation and the effective tax rate.
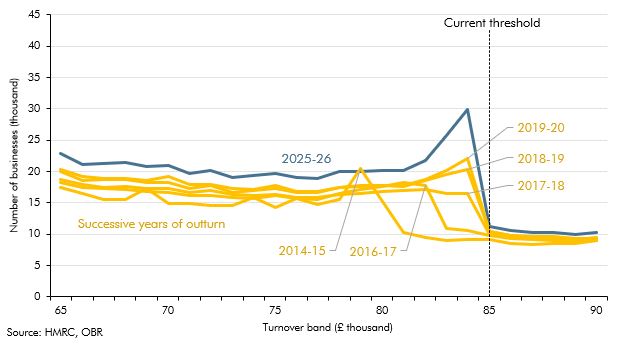
In our March 2023 Economic and fiscal outlook, we evaluate the distorting impact of the frozen VAT registration threshold – the turnover threshold at which firms must register for VAT. This box looked at the tendency for businesses to bunch just below the threshold, as they limited their turnover to avoid needing to register. At the time of the box the threshold had been frozen at £85,000, and was due to remain at that level until the end of March 2026.
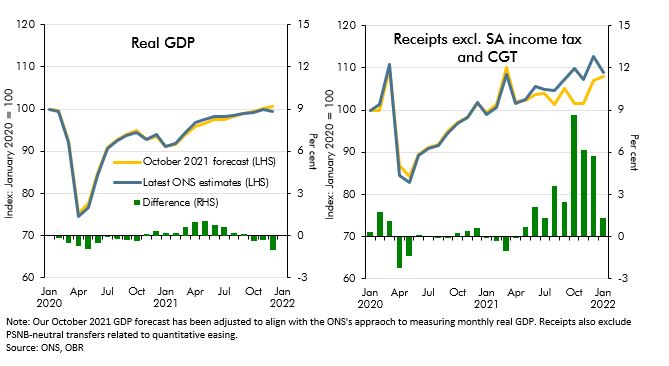
Since our October 2021 EFO the real economy has performed largely as expected in 21-22 but tax receipts have come in well above that forecast. In this box, we examined reasons why tax receipts have recovered so quickly particularly in comparison to economic data.
On 8 July, the Chancellor announced further measures to support the economy as the lockdown is eased, which we were not notified of in sufficient time to incorporate into our scenarios. This box described the measures included in the package and the costs as estimated by the Treasury.
So far during the lockdown period, many businesses are struggling to meet their usual tax payment schedules and are seeking instead to delay those payments. In this box we considered the channels through which this might impact tax receipts and set out the key uncertainties in our medium-term scenario assumptions.
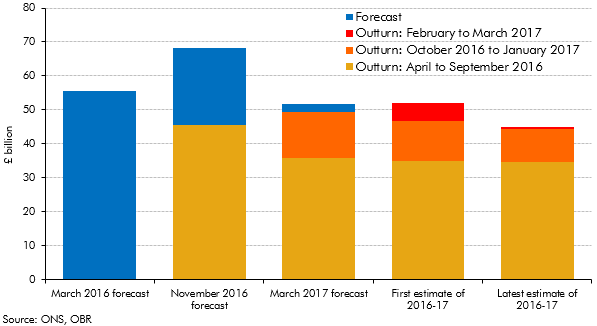
Initial estimates of the deficit can be revised significantly over subsequent months as more reliable data become available. This box set out how our forecasts during 2016 and 2017 evolved and how the outturns for 2016-17 were revised over time.
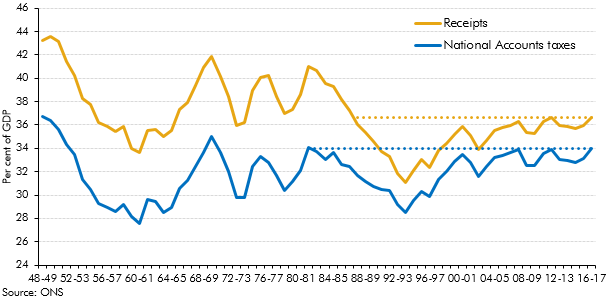
Strong overall receipts growth in 2016-17 took receipts as a share of GDP to their highest since 1986-87. This box explored how the composition of the public sector’s income has changed over the three decades since receipts were last at the latest share of GDP.
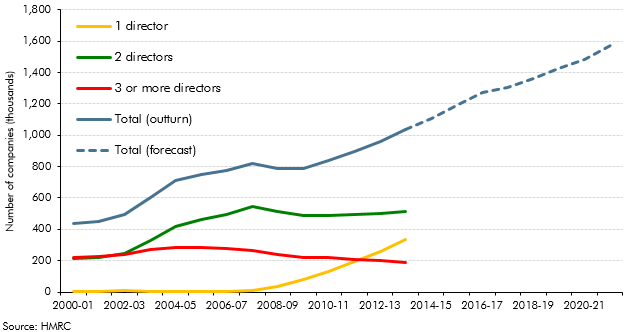
Our PAYE, SA, NICs and corporation tax (CT) forecasts are affected by our assumption that incorporations will continue their rising trend. This box covered historical estimates, the modelling of the receipts effects from incorporations and the implications for the forecast.
Modelling changes were made to the deductions element of the VAT model and to introduce a new model for NICs. The box outlined the modelling changes and the likely effect on receipts.
In each Economic and fiscal outlook we publish a box that summarises the effects of the Government’s new policy measures on our economy forecast. These include the overall effect of the package of measures and any specific effects of individual measures that we deem to be sufficiently material to have wider indirect effects on the economy. In our March 2012 Economic and Fiscal Outlook, we made adjustments to our forecasts of real GDP, business investment and inflation.
This box set out the various impacts that higher inflation has on the public finances. These include direct effects (e.g. on income tax and debt interest spending), the impact on nominal tax bases (such as household consumption) and the impact on departmental spending.