
Our PAYE, SA, NICs and corporation tax (CT) forecasts are affected by our assumption that incorporations will continue their rising trend. This box covered historical estimates, the modelling of the receipts effects from incorporations and the implications for the forecast.
This box is based on HMRC corporations data from October 2016 .
Our PAYE, SA, NICs and corporation tax (CT) forecasts are affected by our assumption that incorporations will continue their rising trend. Employment income is taxed more heavily than profits and dividends, so when formerly employed or self-employed individuals incorporate, their tax bills generally fall and the government loses revenue. We model these fiscal impacts separately and add them to the relevant forecasts for income tax, NICs and corporation tax.
As set out in our 2016 Forecast evaluation report, we appear to have been underestimating the pace of incorporations and their effect on receipts. Since March, we have worked with HMRC to overhaul the forecast model in order better to reflect the affected population, the tax incentives they face and the exchequer cost of a typical incorporation.
The incorporations model is estimated on a sub-population of companies that are considered to have a genuine choice over their legal employment status. This population is defined as those with positive trading profits (after losses being carried forward) of up to £500,000 (in 2014 prices). There were roughly 1 million such companies in 2014, out of a total registered company population of 3.2 million. Between 2000 and 2014, growth in this population averaged around 7 per cent a year, much faster than growth in either employees or the self-employed.
The 2006 Companies Act abolished the legal requirement for companies to have at least two directors. Since then, the number of single-director companies among this population has risen rapidly, reaching 37 per cent of the total by 2014 and accounting for all the growth since 2007. While the data used in the model only extends to 2014, other sources point to growth continuing. For example, the Labour Force Survey suggests that employment among sole directors of their own limited business increased by around 25 per cent between 2014 and 2015.
Chart A: Historical and forecast company population by number of directors
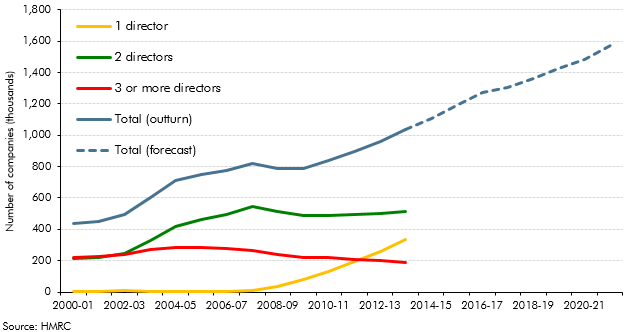
Not all these incorporations are tax-motivated, as incorporation provides other benefits such as limited liability status. Operating as a company is an increasingly common way to structure a business in a number of sectors – particularly construction, retail, IT, media and professional services. These sectors account for more than half the modelled company population in 2014.
The model estimates three key components to produce the overall effect on receipts. These are:
- tax incentives are modelled as a function of the income tax, NICs and CT rates in each year of the forecast. For both the employed and self-employed populations, the theoretical tax gain from incorporating is calculated for a range of incomes and then weighted by their distribution. These calculations assume that typical directors take a salary of at least the primary NICs threshold (currently £8,060) to ensure eligibility for state pensions and other benefits, retain a portion of earnings within the company each year and then withdraw the remaining post-CT profits as dividends. For the 2016-17 tax regime, the theoretical annual tax benefits for employed and self-employed individuals with incomes of around £30,000 are £3,300 and £700 respectively. These incentives are sensitive to tax rates. In 2021-22, when the CT rate will be 17 per cent, the equivalent figures (in today’s prices) will be £4,200 and £1,000;
- the volume of incorporations is estimated using a time series regression that relates the size of the company population to the calculated tax incentives and various macroeconomic variables. This produces a breakdown of company numbers between ‘underlying’ and ‘tax-motivated’ entities. The first group make up the majority of the company population (and the effect on the receipts forecast) and is forecast to expand regardless of tax incentives. The second group is sensitive to changes in tax rates, meaning policy measures that affect the relevant rates will have an additional effect on overall receipts; and
- exchequer costs are calculated by multiplying the forecast volume of incorporations by an estimated average cost per incorporation. The average cost is not the theoretical benefit calculated above, but is drawn from the observed income/profits of the modelled population. This allows for observed patterns of multiple directors within companies splitting income to increase the tax benefit. Across the forecast period, exchequer costs will come from the flow of new incorporations each year plus the stock of those incorporated since the first year of the forecast. These costs are then apportioned to the relevant taxes and added to those forecasts. We assume that the average cost per new incorporation will be higher than the average cost in the stock, so that it also rises over time.
The model is also used in policy costings to estimate the effects of changing tax rates on the number of incorporations and therefore receipts. A proposed change in the income tax, dividend, CT or NICs rates will affect the flow of incorporations in the estimated tax-motivated population as well as the average cost of each incorporation for the whole population.
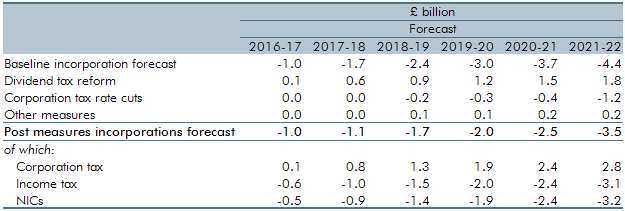
In recent years, the Government has announced significant changes to the headline CT rate and to the tax rate on dividend income. The rise in dividend rates from 2016-17 reduces the tax incentive to incorporate, but this is partly offset by CT rate cuts in 2017-18 and 2020-21. Table A shows the effect of the baseline incorporation forecast and those rate changes on receipts.
Even allowing for the dividend tax reforms, we expect incorporations to increase by 5 per cent a year on average over the forecast period, much faster than the 0.4 per cent a year rise in total employment. Relative to a counterfactual that incorporations increased in line with employment, this takes around £3½ billion off total receipts in 2021-22. This is the net effect of boosting CT by almost £3 billion, but reducing income tax and NICs receipts by over £6 billion.
Table A: Total impact of incorporation modelling on forecast receipts
This box was originally published in Economic and fiscal outlook – November 2016