
Box sets » Receipts » Income tax
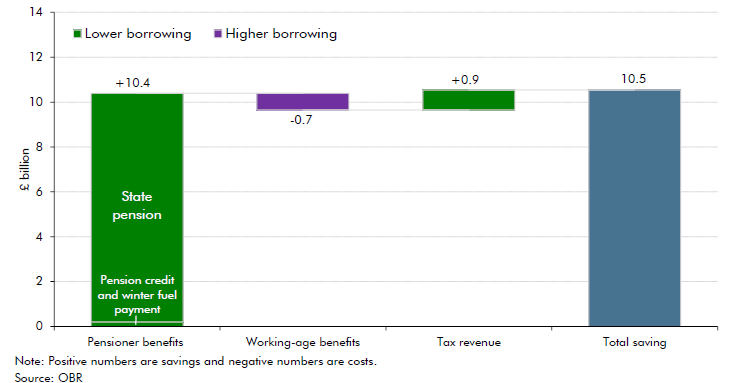
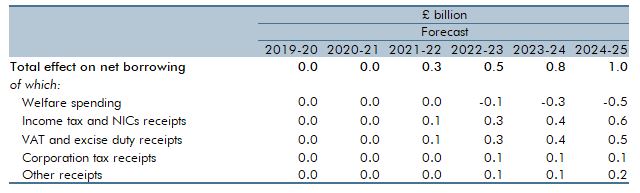
As life expectancy has increased, successive governments have increased the state pension age, and it next increases between 2026 and 2028 from 66 to 67. In this box, we estimated the impact of this increase on pensioner welfare spending, working-age welfare spending, and tax revenue.
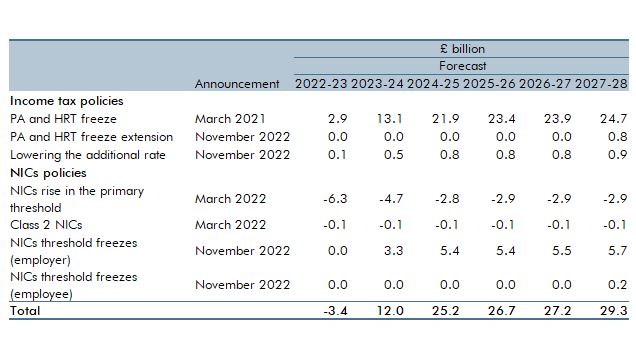
This box discussed the continuing impact of the multiple freezes and changes to personal tax thresholds between March 2021 and November 2022. It provided an update on the estimated receipts from these policies, and the additional number of tax payers by tax band.
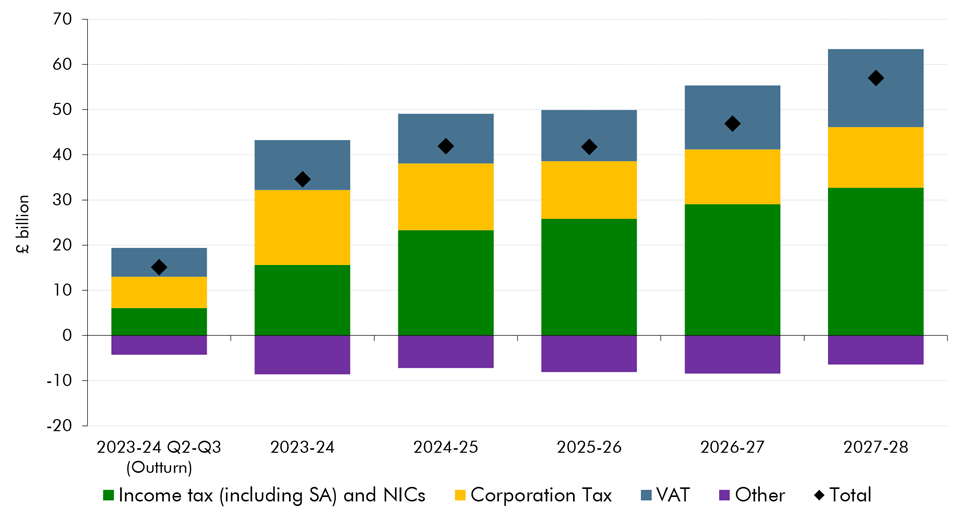
We have made a significant upward revision to our pre-measures receipts forecast. This box explored the drivers behind the revision, which taxes drive the revision and how much of this change is due to real GDP, inflation and the effective tax rate.
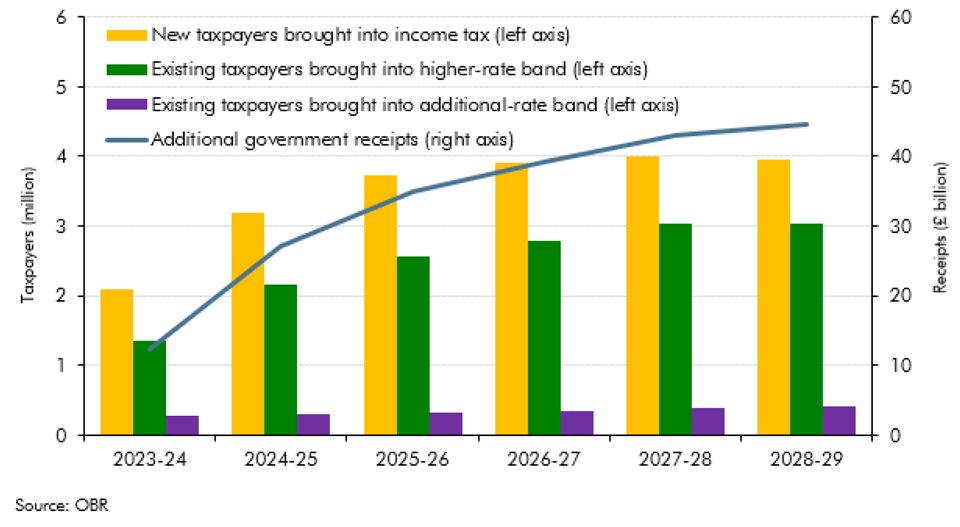
In our March 2023 Economic and fiscal outlook, we evaluate the impact of the freeze or reduction of various personal tax thresholds since April 2021. This box looked at the receipts generated by these measures as well as the impact on taxpayers: the number of new taxpayers these measures create and the number of taxpayers pulled into higher and additional rates.
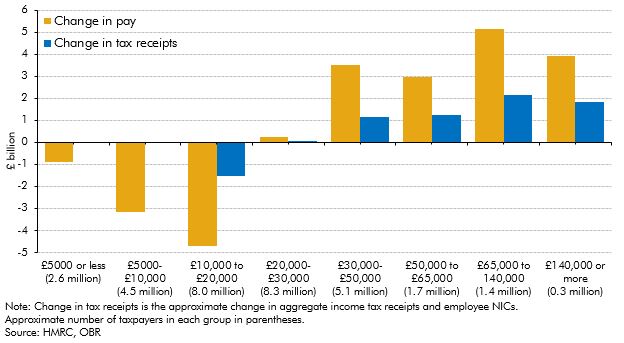
The impact of the pandemic and the national lockdowns has not been equal across the earnings distribution. While it was expected that income tax receipts would be significantly impacted, this box showed that the growth in receipts from higher earners has more than outweighed the fall in receipts from the lowest earners.
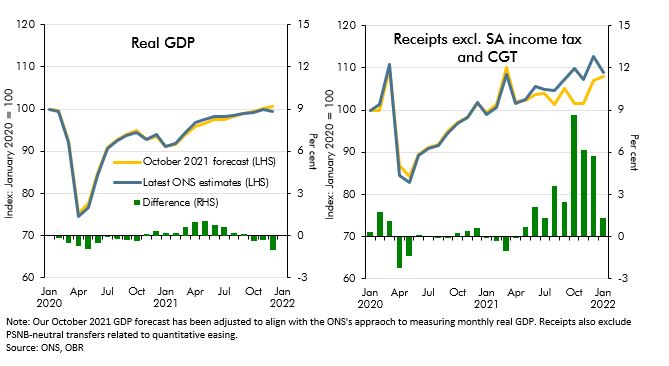
Since our October 2021 EFO the real economy has performed largely as expected in 21-22 but tax receipts have come in well above that forecast. In this box, we examined reasons why tax receipts have recovered so quickly particularly in comparison to economic data.
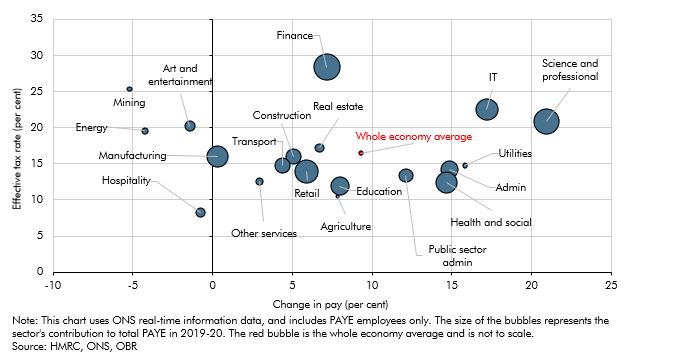
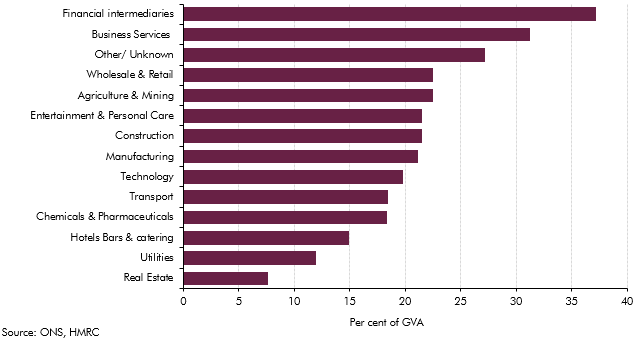
This box considered the reasons for particular strength in income tax receipts since 2019. It covered the growth in aggregate pay across the income distribution using RTI data; looked at pay growth and effective tax rate by sector since 2019; and finally at how the freeze to tax thresholds from April 2022 will compound this strength in receipts.
So far during the lockdown period, many businesses are struggling to meet their usual tax payment schedules and are seeking instead to delay those payments. In this box we considered the channels through which this might impact tax receipts and set out the key uncertainties in our medium-term scenario assumptions.
In February 2020, the Government announced its intention to introduce a ‘points-based’ migration system from January 2021 that will align migration policy for EU and non-EU migrants. In this box we looked at the effect of the new migration regime on our borrowing forecast.
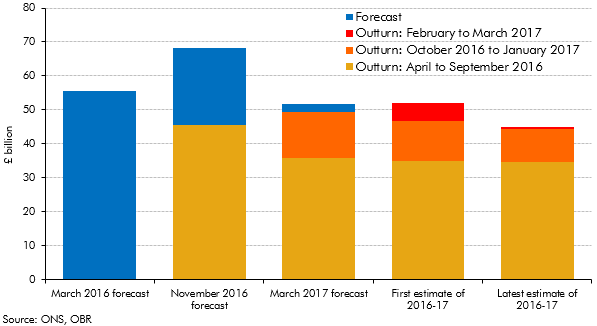
Initial estimates of the deficit can be revised significantly over subsequent months as more reliable data become available. This box set out how our forecasts during 2016 and 2017 evolved and how the outturns for 2016-17 were revised over time.
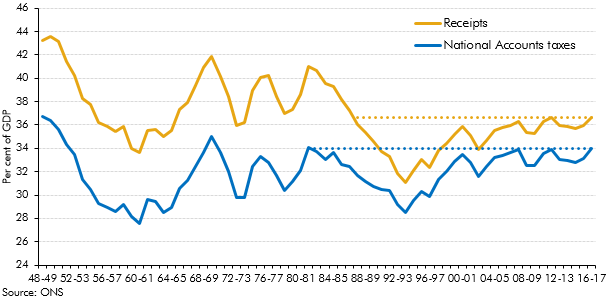
Strong overall receipts growth in 2016-17 took receipts as a share of GDP to their highest since 1986-87. This box explored how the composition of the public sector’s income has changed over the three decades since receipts were last at the latest share of GDP.
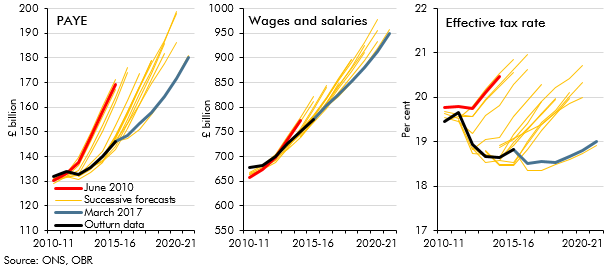
PAYE income tax is the Government’s single most important source of revenue, and one where our forecasts since 2010 have tended to be revised down over time. In this box from our March 2017 Economic and fiscal outlook, we explored the role that changes in the distribution of earnings might have played in explaining the shortfalls in income tax receipts.
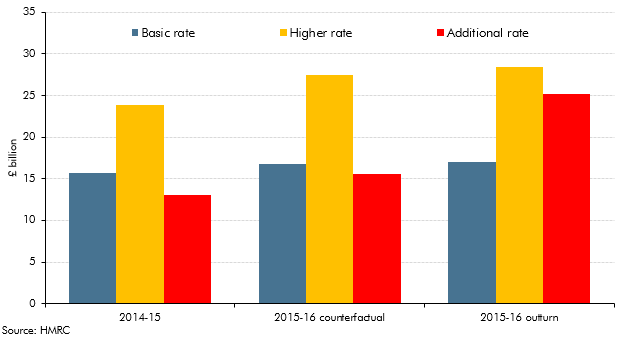
Ahead of our March 2017 Economic and fiscal outlook, self-assessment tax receipts indicated that the Summer Budget 2015 reforms to the taxation of individual dividend income had prompted even greater income shifting than we had expected. The reforms raised the basic, higher and additional rates by 7.5 percentage points from April 2016 and introduced a tax-free allowance on the first £5,000 of taxable annual dividend income. They were pre-announced, giving taxpayers around eight months to bring forward dividend income into 2015-16 so that it was taxed at the lower rate. This box considered the amount of income brought forward and the effect of that on tax receipts.
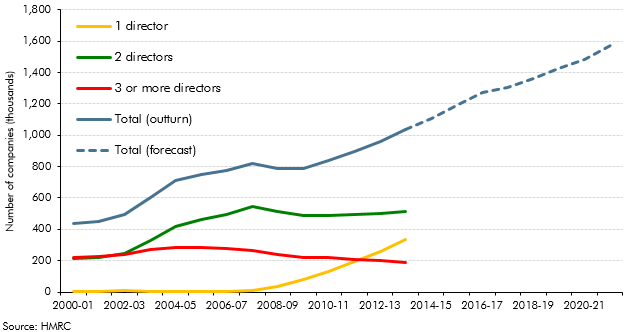
Our PAYE, SA, NICs and corporation tax (CT) forecasts are affected by our assumption that incorporations will continue their rising trend. This box covered historical estimates, the modelling of the receipts effects from incorporations and the implications for the forecast.
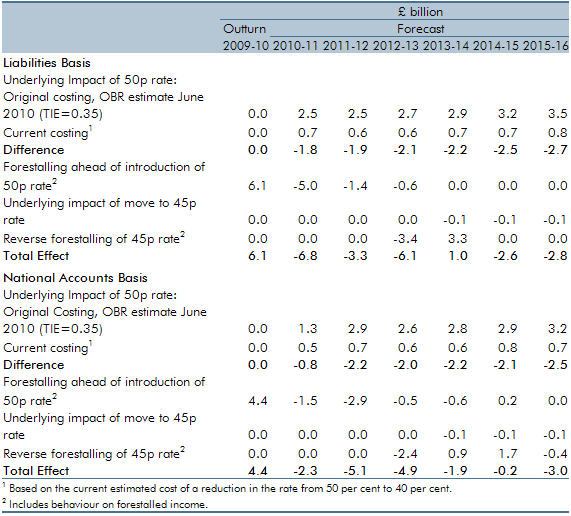
An additional rate of income tax of 50p for incomes over £150,000 was introduced in April 2010. Budget 2012 announced that this rate would be reduced to 45p from April 2013. This box explored how the incomes of those affected by this change evolved over this period - in particular the significance of forestalling and income shifting.
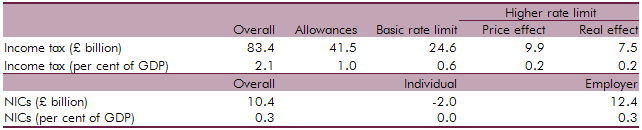
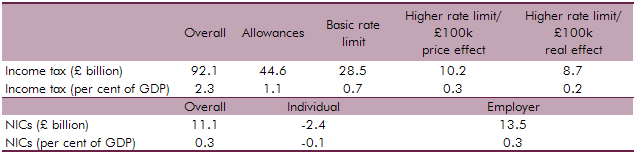
We updated our July 2013 analysis of fiscal drag on income tax and NICs to reflect new data, our latest assumptions and the effect of measures announced over the past year. This box outlined how fiscal drag effects income tax and NICs receipts and the long-term assumptions used.
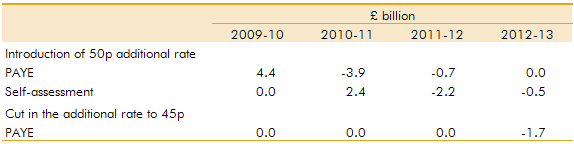
An additional rate of income tax of 50p for incomes over £150,000 was introduced in April 2010. Budget 2012 announced that this rate would be reduced to 45p from April 2013. This box explored how incomes were shifted (forestalled) in response to these policy changes
We updated our 2012 analysis of fiscal drag on income tax and NICs to reflect new data, our latest assumptions and the effect of measures announced over the past year. This box outlined how fiscal drag effects income tax and NICs receipts and the long-term assumptions used.
In each Economic and fiscal outlook we publish a box that summarises the effects of the Government’s new policy measures on our economy forecast. These include the overall effect of the package of measures and any specific effects of individual measures that we deem to be sufficiently material to have wider indirect effects on the economy. In our March 2013 Economic and Fiscal Outlook, we made adjustments to our forecasts of real GDP, business investment and inflation
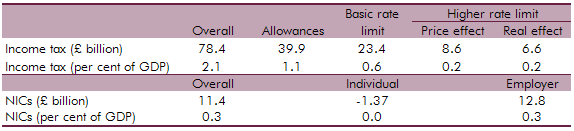
We updated our 2011 analysis of fiscal drag on income tax and NICs to reflect new data, our latest assumptions and the effect of measures announced over the past year. This box outlined how fiscal drag effects income tax and NICs receipts and the long-term assumptions used.
In each Economic and fiscal outlook we publish a box that summarises the effects of the Government’s new policy measures on our economy forecast. These include the overall effect of the package of measures and any specific effects of individual measures that we deem to be sufficiently material to have wider indirect effects on the economy. In our March 2012 Economic and Fiscal Outlook, we made adjustments to our forecasts of real GDP, business investment and inflation.
An additional rate of income tax of 50 per cent for incomes over £150,000 was introduced in April 2010. Budget 2012 announced that this rate would be reduced to 45 per cent from April 2013. This box set out how the Budget 2012 measure was costed, in particular the assumptions we made around behavioural responses and income shifting. Box 3.2 of our 2014 Forecast evaluation report reviewed this costing in detail.
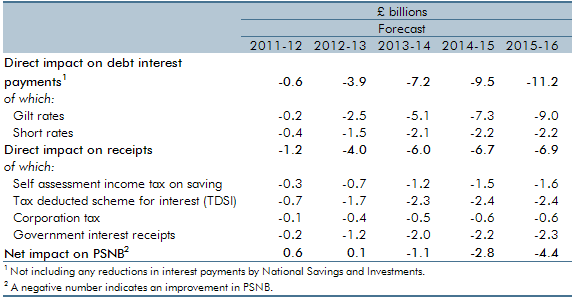
This box set out the impact of changes in interest rates on our public finances forecast, including debt interest spending and income tax receipts. Updated versions of our ready reckoners can be found on our website.
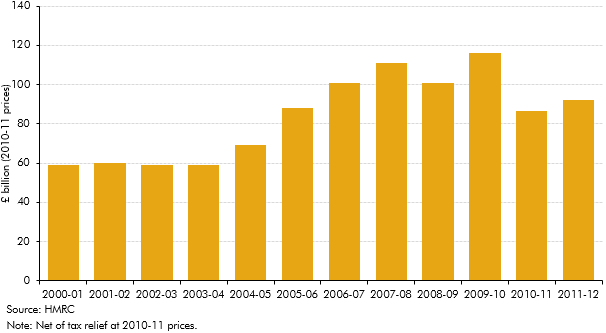
The sectoral landscape of the economy had changed markedly with the financial sector becoming increasing important. This box examined implications for tax revenue arising from the financial sector.
In each Economic and fiscal outlook we publish a box that summarises the effects of the Government’s new policy measures on our economy forecast. These include the overall effect of the package of measures and any specific effects of individual measures that we deem to be sufficiently material to have wider indirect effects on the economy. In our March 2011 Economic and Fiscal Outlook, we made adjustments to our forecast of inflation.
This box set out the various impacts that higher inflation has on the public finances. These include direct effects (e.g. on income tax and debt interest spending), the impact on nominal tax bases (such as household consumption) and the impact on departmental spending.