The sectoral landscape of the economy had changed markedly with the financial sector becoming increasing important. This box examined implications for tax revenue arising from the financial sector.
This box is based on ONS income and HMRC effect tax (sector) data from June 2011 and June 2011 respectively.
The sectoral composition of the economy matters for the public finances since the tax burden varies between sectors, depending on factors such as productivity and profitability. The sectoral landscape of the UK economy has changed markedly in the last 30 years. The share of manufacturing in total output has fallen while business services and the real estate sectors have experienced sharp growth.a The financial sector’s share of GVA doubled from 2000 to 2008.
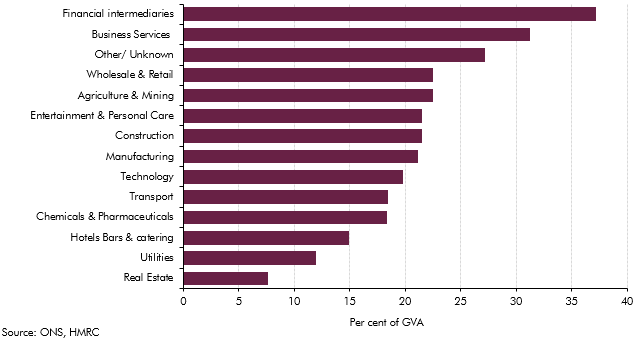
Chart A: Effective tax burden by sector, income and corporate tax, as a share of GVAb

Chart A shows that in 2007-08 the effective tax burden from corporate and income tax, as a share of GVA, was the highest for financial intermediaries (although measuring financial sector GVA is not straightforward). This partly reflects relatively high profits in the sector compared to its contribution to GVA. In 2007-08 gross trading profits in banking, finance and insurance accounted for around 21 per cent of total profits.c
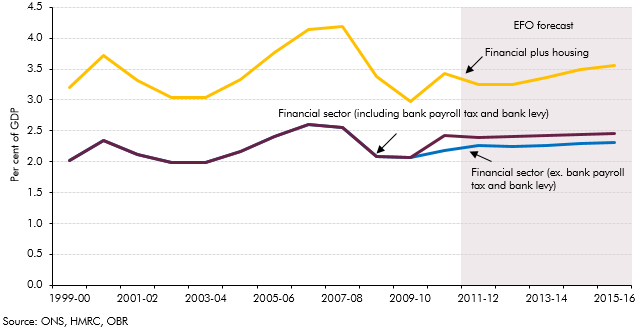
The financial crisis then led to revenues from this sector and the related housing sector falling sharply, as shown in Chart B. This was one of the primary drivers of the severe deterioration in the UK public finances in recent years, exposing the risks to sustainability of reliance on revenue from these sectors.
The long-term projections in this report do not make any assumptions on future sectoral trends. They therefore implicitly assume that the sectoral contribution to tax receipts in 2015-16, at the end of our latest medium-term forecast, holds throughout the projection period. As the chart shows, our latest medium-term forecast is for the share of receipts from the financial and housing sectors to rise from its trough in 2009-10, but not to return to the peak levels seen in 2007-08. Looking at the taxes paid by the financial sector such as PAYE, NICs and corporation tax, these remain below their pre-recession peak as a share of GDP through the forecast period. This remains the case if the bank levy is included. This is effectively locked in for the long-term so that our projections do not rely on further increases in revenue from the sector as a share of national income.
Chart B: Financial and housing sector receiptsd

More generally, if in the future the economy were to experience another sectoral shift, such as that seen over the past 30 years, it would potentially have important implications for tax revenue. However this is very difficult to predict. And its implications for tax revenue would depend on a range of factors such as sectoral productivity and profits.
