
PAYE income tax is the Government’s single most important source of revenue, and one where our forecasts since 2010 have tended to be revised down over time. In this box from our March 2017 Economic and fiscal outlook, we explored the role that changes in the distribution of earnings might have played in explaining the shortfalls in income tax receipts.
This box is based on Low Pay Commission annual report and ONS earnings data from October 2016 and August 2016 respectively.
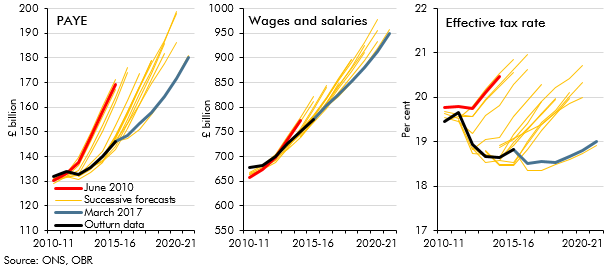
PAYE income tax is the Government’s single most important source of revenue. But, as Chart A illustrates, our forecasts since 2010 have tended to be over-optimistic and we have revised them down over time. The shortfalls have reflected weakness in average growth in wages and salaries and in the amount of tax raised per pound of wages and salaries – the effective tax rate.
Weakness in total wages has reflected weak earnings growth, itself reflecting weak productivity growth. This was partly offset by stronger employment growth, but that has weighed on the effective tax rate because an additional pound of wages due to earnings growth is taxed at the marginal rate (20, 40 or 45 per cent), but an additional pound from employment growth at the average rate (less than 19 per cent in 2015-16, including the effect of the personal allowance).
Chart A: Successive forecasts for PAYE income tax receipts, wages and salaries and the effective tax rate
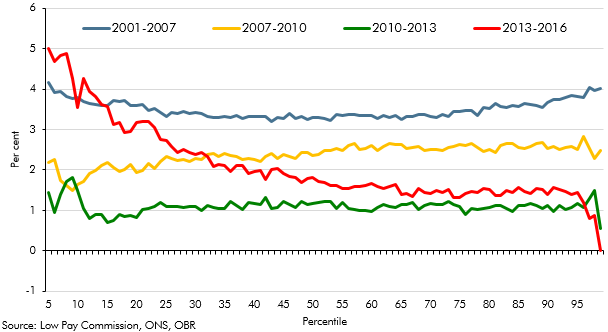
Differences in wage growth at different points in the income distribution are also likely to have contributed to errors in our effective tax rate forecasts. Chart B shows how earnings growth has changed across the distribution for employees aged 22 and over, using ASHE data. These relate to a single pay period in April each year, so will not necessarily be a good guide to changes in income subject to PAYE through the whole year. It suggests four distinct periods since 2001:
- between 2001 and 2007, wage growth was around 3½ per cent a year at both mean and median earnings (where the mean tends to be just above the 60th percentile), but higher at both the bottom of the distribution (thanks in part to the National Minimum Wage (NMW)) and the top (continuing the trend of the 1980s and 1990s);
- between 2007 and 2010, wage growth in the top half of the distribution was stronger (at around 2½ per cent a year) than in the bottom half;
- between 2010 and 2013, wage growth was much slower (at a little over 1 per cent a year) and broadly stable between the 20th and the 95th percentiles. There was slightly higher growth at the very bottom of the distribution; and
- since 2013, thanks to relatively large increases in the NMW and, in 2016, the introduction of the National Living Wage (NLW), the pattern looks very different. Earnings growth picked up a little to roughly 1½ per cent a year from the mean to around the 95th percentile, but was stronger throughout the bottom half.
We moved to assuming a relatively even distribution of earnings growth (before NLW effects) in recent forecasts, reducing the extent to which it pushed up the effective tax rate. The pattern since 2013 may help explain why receipts have been weaker than expected recently.
Chart B: Weekly earnings growth by percentile
Earnings growth lower in the distribution yields less revenue than it used to because the personal allowance was increased around eight times faster than average earnings between 2010-11 and 2015-16, narrowing the tax base. As well as reducing the number of income taxpayers by moving the personal allowance up the earnings distribution (by around 7 percentiles), this reduces the effective tax rate further up the distribution. A basic rate taxpayer working 36 hours a week at median hourly earnings would have paid 13.7 per cent of their wages in income tax in 2010-11, but 10.4 per cent in 2015-16 because of the higher personal allowance.
PAYE receipts will also have been depressed by the lack of earnings growth at the top of the distribution, which is particularly marked since 2013. This is likely to reflect a number of factors, including previously high-paid employees choosing to incorporate (see Box 4.1 of our November EFO) and compositional effects – e.g. post-war baby-boomers retiring or leaving full-time employment to be replaced by younger less well-paid people. We have noted similar compositional effects in our public service pensions forecast, including for teachers and GPs
Looking ahead, our PAYE forecasts assume relatively uniform earnings growth across the distribution, but that the top end will be disproportionately hit by the UK exiting the EU (due to effects on higher-paying sectors, including financial services). Changes in the distribution are therefore expected to deliver a small drag on the effective tax rate over the next five years.
This box was originally published in Economic and fiscal outlook – March 2017