
This box considered the reasons for particular strength in income tax receipts since 2019. It covered the growth in aggregate pay across the income distribution using RTI data; looked at pay growth and effective tax rate by sector since 2019; and finally at how the freeze to tax thresholds from April 2022 will compound this strength in receipts.
This box is based on HMRC and ONS data from .
Between April and December 2021, £250.1 billion was raised in PAYE income tax and NICsa –up 11.7 per cent on the same period last year and up 11.6 per cent on the same period in 2019-20, before the pandemic, lockdowns, and furlough distorted the picture. Growth in these receipts has been much stronger than growth in nominal GDP (which is up just 4.0 per cent on the same period in 2019-20). Much of that is due to aggregate pay recorded in HMRC’s PAYEbased real-time information (RTI) system growing more strongly than GDP (up 9.4 per cent over the same two-year period, implying a higher labour share of income and a more tax-rich composition of nominal GDP given the higher tax rates levied on labour income). The implied effective tax rate on PAYE income has also risen from 33.2 per cent in the first three quarters of 2019-20 to 33.8 per cent in the first three quarters of 2021-22, so labour income itself has become more tax-rich too. This box explores the drivers of this higher effective tax rate.
Income tax rates are progressive – i.e. they rise with income – whereas employee NICs rates are regressive and employer NICs rates are constant. The progressiveness of the income tax schedule dominates, so that combined PAYE income tax and NICs paid per pound of earnings is higher for high earners than for low earners. The amount of tax this generates depends on how earnings growth varies relative to the thresholds in the tax system. Over the past two years, the 9.4 per cent growth in aggregate RTI pay compares with just a 0.5 per cent rise in most income tax thresholds (with the additional rate threshold frozen in cash terms at £150,000).
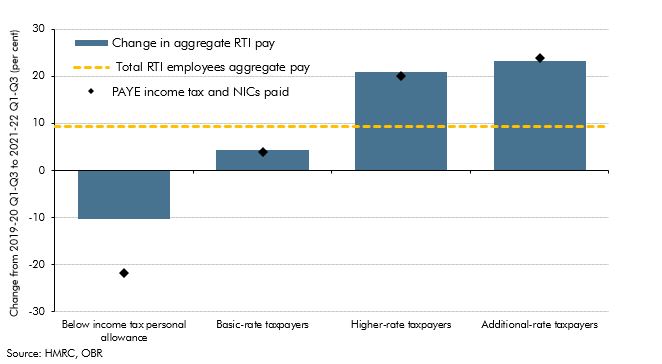
This helps explain why stronger aggregate pay growth among just 3.6 million taxpayers facing the higher or additional marginal tax rate (12 per cent of the total) accounts for almost all the rise in the effective tax rate relative to 2019-20 (Chart B). This aggregate growth reflects both increased numbers of employees in those tax brackets, as well as increases to individual pay:
- Aggregate pay among those earning less than the income tax personal allowance has fallen 10.3 per cent over the past two years, while that of basic-rate taxpayers has risen at less than half the rate of total pay at 4.4 per cent. These two groups averaged 25.5 million employees (88 per cent of total RTI employees) across the first three quarters of 2021-22, but accounted for less than a fifth of growth in PAYE income tax and NICs receipts compared to 2019-20.
- Aggregate pay among higher-rate taxpayers has risen by 21.0 per cent over two years – more than twice as fast than the total. This group averaged 3.3 million employees (11 per cent of RTI employees) but accounted for half of growth in receipts. But growth in tax paid by this group does not reflect faster average pay growth; rather it reflects fiscal drag bringing more basic-rate taxpayers into the higher-rate tax bracket. Indeed, the 20.0 per cent growth in tax paid by this group reflects 20.5 per cent growth in the number of employees with monthly pay between £4,167 and £12,500 offsetting an average 0.4 per cent fall in the average amount of tax paid per employee.
- Aggregate pay among additional-rate taxpayers has risen faster still – by 23.3 per cent over two years. This group averaged 0.3 million employees (just 1 per cent RTI employees) but accounted for over a third of growth in PAYE income tax and NICs receipts. Again fiscal drag bringing higher-rate taxpayers into the additional-rate tax bracket largely explains this growth. The 23.9 per cent rise in tax paid by this group reflects 22.3 per cent growth in the number of employees whose monthly pay is more than £12,500 and only 1.3 per cent growth in average tax paid per employee.
Chart B: Growth in aggregate pay and tax paid, by employees’ marginal tax rates
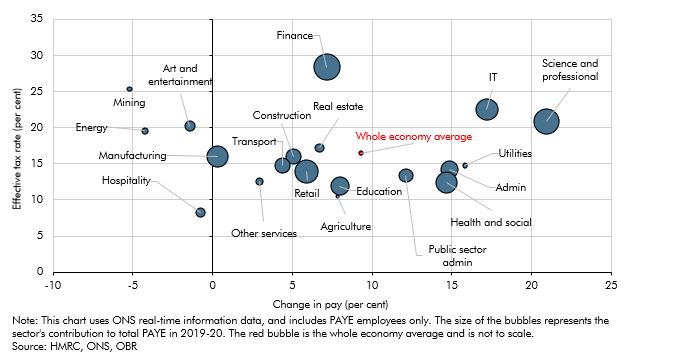
These differences in pay growth at different marginal tax rates during the pandemic may also reflect its differential impact across sectors of the economy. The pandemic hit employment and output in some sectors much harder than others, while the recovery has also been uneven. Some sectors have performed particularly well either because they could easily switch to remote working (such as financial and professional services) or because demand rotated towards their output (such as health, online retail, and IT services). As Chart C shows, the sectors that have fared worst in terms of aggregate pay growth were also those where effective tax rates and amounts of tax paid are relatively low – most clearly the hospitality and arts and entertainment sectors. By contrast, the sectors that have seen stronger aggregate pay growth – in particular IT and professional services – were also those where effective tax rates are relatively high. In the first three quarters of 2021-22, those two sectors accounted for 12 per cent of all PAYE employees, but more than twice that at 25 per cent of PAYE income tax, and 42 per cent of whole economy growth in PAYE income tax receipts relative to 2019-20.
Chart C: Aggregate two-year pay growth in the first three quarters of 2021-22 and average effective tax rates by sector
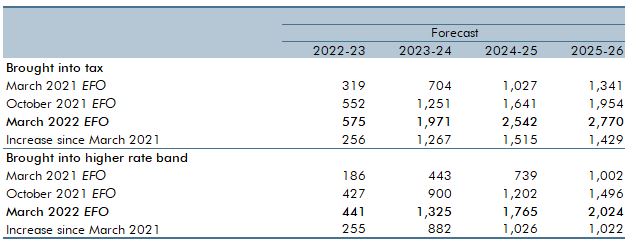
The strong growth in higher- and additional-rate taxpayers between 2019-20 and 2021-22 is set to be compounded by the four-year freeze on income tax thresholds that starts in April 2022. This will further increase the number of new taxpayers and higher-rate taxpayers. Upward revisions to our CPI inflation forecasts since we initially costed the threshold freeze in the March 2021 Budget have increased our estimate of the number of new income taxpayers created by the measure from 1.3 to 2.8 million by 2025-26 and the number of new higher-rate taxpayers (including all income, not just that paid via PAYE) from 1.0 to 2.0 million over the same period. That would represent 8.3 per cent more income taxpayers than would otherwise have been the case, and 42 per cent more higher-rate taxpayers (from 33.4 to 36.1 million and 4.8 to 6.8 million respectively).
Table B: Individuals brought into paying tax and taxpayers brought into the higher rate band by freeze on personal allowance and higher rate thresholds
This box was originally published in Economic and fiscal outlook – March 2022