
The impact of the pandemic and the national lockdowns has not been equal across the earnings distribution. While it was expected that income tax receipts would be significantly impacted, this box showed that the growth in receipts from higher earners has more than outweighed the fall in receipts from the lowest earners.
This box is based on HMRC and ONS data from November 2021 .
The resilience of income tax and NICs receipts in 2020-21 partly reflects the fact that pandemic-related
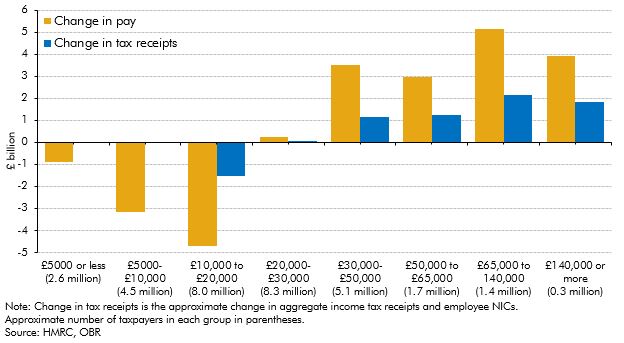
hits to incomes have been concentrated towards the lower end of the income distribution, where earnings are far less tax-rich. Chart A shows that on the basis of HMRC’s PAYE real-time information: employees earning less than £20,000 in 2019-20 on average saw total earnings fall in 2020-21; those earning between £20,000 and £30,000 saw them rise modestly; while those earning above £30,000 saw them rise more materially. This pattern is important for understanding the performance of tax receipts in 2020-21. For example:
- The £8.8 billion fall in total earnings for the roughly 15 million employees earning less than £20,000 in 2019-20 generated a £1.5 billion fall in receipts. This implies a low effective marginal tax rate of 17 per cent thanks to many in this bracket earning less than the personal allowance.
- The £256 million increase in total earnings for the roughly 8 million employees earning between £20,000 and £30,000 generated a modest £82 million increase in receipts. This implies a marginal effective tax rate of 32 per cent, reflecting the fact that each additional pound earnt in this bracket is liable to basic rate income tax plus employee NICs.
- The £15.6 billion rise in total earnings for the roughly 8½ million employees earning between £30,000 and £140,000 or more generated a £6.4 billion rise in receipts. This implies a higher effective marginal tax rate of 41 per cent as around two-fifths of employees in this bracket pay the higher rate of income tax, as well as paying NICs.
Chart A: Changes in pay and tax receipts across the employee earnings distribution between 2019-20 and 2020-21
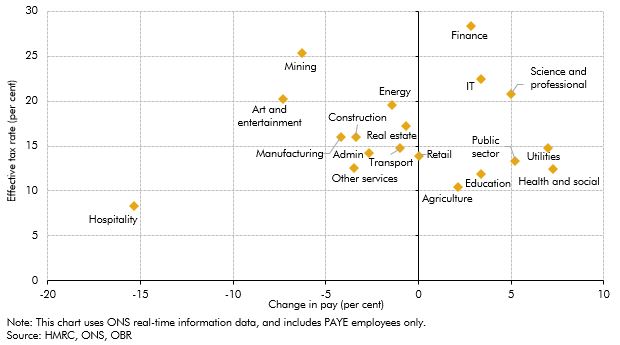
Part of the explanation for the pattern of earnings growth and tax paid across the income distribution is the sectoral impact of the pandemic. The majority of job losses and furloughing without pay top-ups from employers was concentrated in lower-paid sectors, which were hardest hit by the pandemic and so most reliant on furlough to support income. Although they make up a large proportion of the labour force, both their average pay and their effective tax rates are relatively low, meaning a smaller impact on receipts for a given loss of earnings. As Chart B shows, there was some (albeit weak) correlation between earnings growth and effective tax rates (ETRs) across sectors, with the low-ETR hospitality sector seeing total earnings hit particularly hard while the high-ETR financial and professional services sectors saw total earnings rise.
Chart B: Total pay growth in 2020-21 and average effective tax rate by sector
This box was originally published in Forecast evaluation report – December 2021