
Strong overall receipts growth in 2016-17 took receipts as a share of GDP to their highest since 1986-87. This box explored how the composition of the public sector’s income has changed over the three decades since receipts were last at the latest share of GDP.
This box is based on ONS and HMRC data from September 2017 .
Public sector receipts rose to 36.7 per cent of GDP in 2016-17, their highest level since 1986-87. National Accounts taxes (which exclude non-tax revenues, such as interest paid on the government’s assets and the operating surpluses of public corporations) reached 34.0 per cent of GDP, the highest level since 1981-82. Chart B illustrates these historical trends.
Chart B: Taxes and receipts as a share of GDP
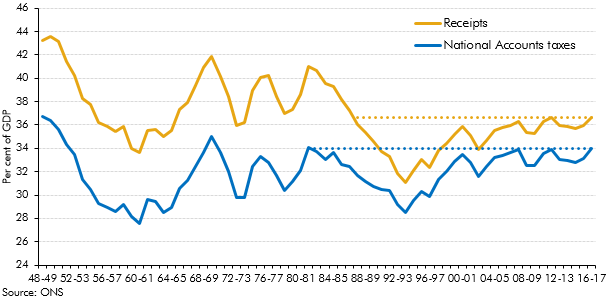
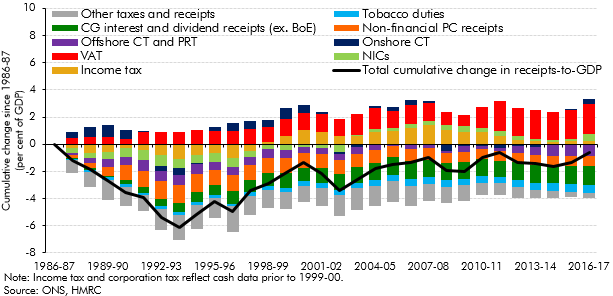
Chart C shows the different factors that have contributed to the fall and subsequent rise in the receipts-to-GDP ratio since 1986-87. Factors pushing the ratio higher include:
- VAT receipts have risen by 2.2 per cent of GDP. This largely reflects policy-driven rises in the effective tax rate: the standard rate of VAT was raised from 15 to 17½ per cent in 1991, cut to 15 per cent in late 2008 to support the economy through the recession, returned to 17½ per cent in 2010 and then raised again to 20 per cent in 2011. A disproportionate rise in the tax base has also helped, with consumer spending rising as a share of GDP by around 3.0 percentage points over the period.
- National Insurance contributions have risen by 0.5 per cent of GDP. This is more than explained by largely policy-driven increases in the effective tax rate. Over this period, the main employee rate has risen from 9 to 12 per cent and the employer’s rate has risen from 10.45 to 13.8 per cent. Receipts were actually below their 1986-87 level until 2002-03, but moved above it as Budget 2002 rises were implemented in 2003-04. Removing the NICs contracting out rebate boosted receipts by a further 0.3 per cent of GDP in 2016-17. Wages and salaries fell by less than half a per cent of GDP over the period, partly offsetting the contribution from a higher effective tax rate.a
- Onshore corporation tax receipts have risen by 0.4 per cent of GDP, despite the headline rate having been cut from 35 to 20 per cent. The effect of this lower rate has been offset to some extent by policy changes that restrict the use of reliefs and allowances, increasing the amount of profits subject to tax. Non-oil, non-financial profits have risen by 2.7 per cent of GDP from 2009 to 2016, boosting receipts despite the lower headline tax rate. Some of the rise will reflect the upward trend in incorporations. In 2016-17, receipts topped their pre-crisis level as a share of GDP for the first time, but remain below the peak they reached in 1989-90.
- Income tax receipts, although below their recent 2007-08 peak, are 0.3 per cent of GDP higher than in 1986-87. Again, this is explained by a higher effective tax rate, partly reflecting the fact that average earnings have risen faster than the higher rate threshold over the period, so that a rising proportion of earnings have been taxed at the higher rate of income tax. The recent weakness in earnings growth has placed greater downward pressure on income tax than NICs because of its more progressive rate structure.
Partly offsetting those positive contributions to leave total tax receipts 1.5 per cent of GDP higher than in 1986-87 were:
- Offshore corporation tax and petroleum revenue tax (PRT) receipts have fallen by 0.8 per cent of GDP. This fall mainly reflects declining oil and gas production from around 2000 onwards, as well as cuts to the main rates of tax. The PRT rate was cut to zero in 2016-17, having been as high as 75 per cent in 1986-87. More recently the drop in oil prices has further reduced receipts.
- Tobacco duty receipts have fallen by 0.6 per cent of GDP, reflecting a steady decline in tobacco consumption. The proportion of adults in Great Britain who smoke halved between 1986 and 2016 (from 33 to 16 per cent).
Despite higher tax receipts, overall receipts were 0.6 per cent of GDP lower than in 1986-87. This reflects central government interest and dividend receipts (excluding the intra-public sector receipts from the Bank of England) having fallen by 1.4 per cent of GDP. Interest rates have fallen significantly over the past three decades. For example, Bank Rate averaged 10.4 per cent during 1986-87, but was cut to 0.25 per cent mid-way through 2016-17. And receipts from non-financial public corporations have fallen by 0.8 per cent of GDP. This largely reflects privatisations in the late 1980s and early 1990s, reducing both public sector receipts and public spending.
Chart C: Change in the receipts-to-GDP ratio since 1986-87
This box was originally published in Forecast evaluation report – October 2017