
We have made a significant upward revision to our pre-measures receipts forecast. This box explored the drivers behind the revision, which taxes drive the revision and how much of this change is due to real GDP, inflation and the effective tax rate.
This box is based on ONS data from October 2023 .
In our pre-measures forecast, tax receipts have increased in all years relative to our March forecast, and by £57.0 billion in 2027-28 (this excludes fiscally-neutral VAT refunds and environmental levies). This improvement is spread across the main taxes with increases in income tax and national insurance contributions, onshore corporation tax, and VAT, offset by falls in smaller taxes Chart A.
Chart A: National accounts taxes (excluding PSNB neutral): Changes since March
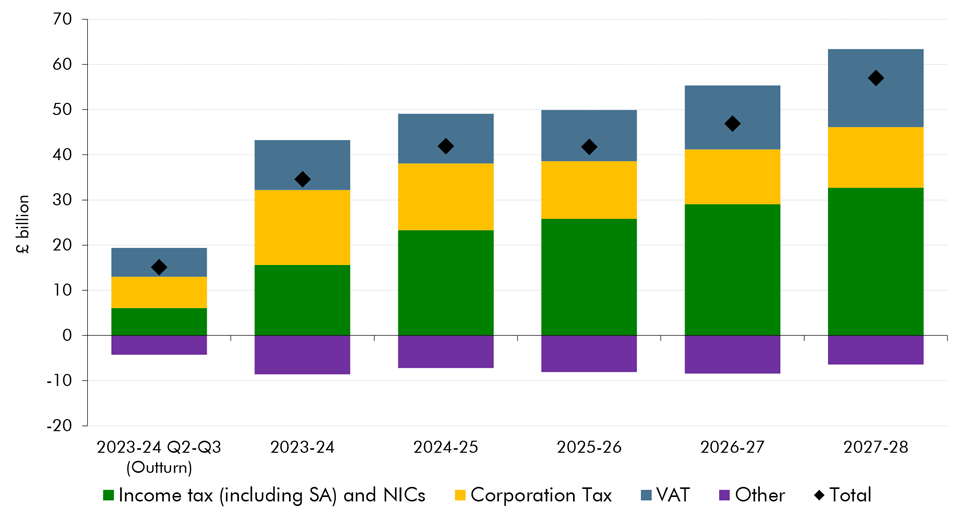
A large portion of the upside revision occurs this year, reflecting strength already seen in the outturn statistics. In the first half of this year, national accounts taxes, excluding fiscally neutral items, are £15.1 billion above our profile from the March forecast. This is largely due to the impact of higher-than-expected inflation on the main taxes but also reflects some more technical factors. In the first half of this year:
- Income tax and NICs are up £6.0 billion compared to our March profile. Stronger nominal earnings growth than anticipated in March, along with one-off payments and backdated pay awards in the NHS and the Civil Service, has boosted these receipts. In addition, strong growth in pension income (reflecting inflation or earnings-related rises) and greater use of pension flexibility have also boosted receipts.
- Corporation tax is up £7.0 billion compared to our March profile. In addition to higher-than-expected non-financial and financial sector profits, this also reflects what now looks like a pessimistic assumption in our March forecast that strength in 2022-23 would not be maintained. In addition, the sectors that are generally the bigger taxpayers (financial, retail and professional services) continue to perform well.
- VAT is up by £6.4 billion compared to our March profile. On top of higher inflation, this also reflects our overestimation of the negative impact of the cost-of-living crisis on VAT receipts, as both the level of consumption and the share of standard rated items have been higher-than-expected.
- All other taxes combined are down by £4.3 billion compared to the March profile, driven by offshore corporation tax, energy profits levy and electricity generators levy which are down by £1.0 billion, £1.1 billion and £0.9 billion, respectively, due to lower energy prices.
For the second half of this year our forecast implies continued upside strength, with taxes £19.5 billion higher than expected in our March forecast. Again, the continued impact of high inflation on the main tax bases is expected to be the key contributor to this strength. In the second half of the year:
- Income tax and NICs are expected to be £9.5 billion higher than our March profile. While earnings growth is expected to slow in the second half of the financial year, it remains stronger than we anticipated in March. Stronger bonus growth than assumed in March is also expected to boost receipts in the final months of the financial year.
- Corporation tax is forecast to be £9.7 billion higher than our March profile. While there may be some effect from slowing profit growth in the remainder of the year, recent cash receipts outturns have so far shown little sign of moderating. We also expect some upward revisions to accrued receipts for the first half of the year.a
- VAT receipts are forecast to be £4.6 billion above our March profile, as we expect the current strength to continue, albeit to a lesser degree as the growth of nominal consumption is forecast to slow in the second half of the year.
- All other taxes combined are forecast to be £4.3 billion below our March profile, continuing the weakness from the first half of this year.
Overall, due to these factors we forecast taxes in full-year 2023-24 will be £34.6 billion higher than in our March forecast. In addition to this strength in 2023-24, further upward revisions compared to our March forecast total an additional £22.4 billion in receipts by 2027-28. The drivers of this further strength between 2023-24 and 2027-28 are:
- IT and NICs improves by an additional £17.1 billion by 2027-28 relative to March. Nominal earnings growth is expected to be stronger through the forecast, particularly in 2024-25. Combined with income tax and NICs threshold freezes, this boosts fiscal drag significantly.
- VAT increases by an additional £6.3 billion by 2027-28. On top of a higher nominal GDP, driven by higher inflation, this reflects a shift to higher standard-rated consumption as the impacts of high inflation subside and consumption shifts away from the lower- or zero-rated necessities such as food, energy and rent.
- Other taxes add an extra £2.2 billion, as the deficit against our March forecast reduces from £8.6 billion this year to £6.4 billion in 2027-28.
- Offsetting this, onshore corporation tax surpluses relative to March fall by £3.2 billion by 2027-28, largely reflecting lower profit growth particularly in 2024.
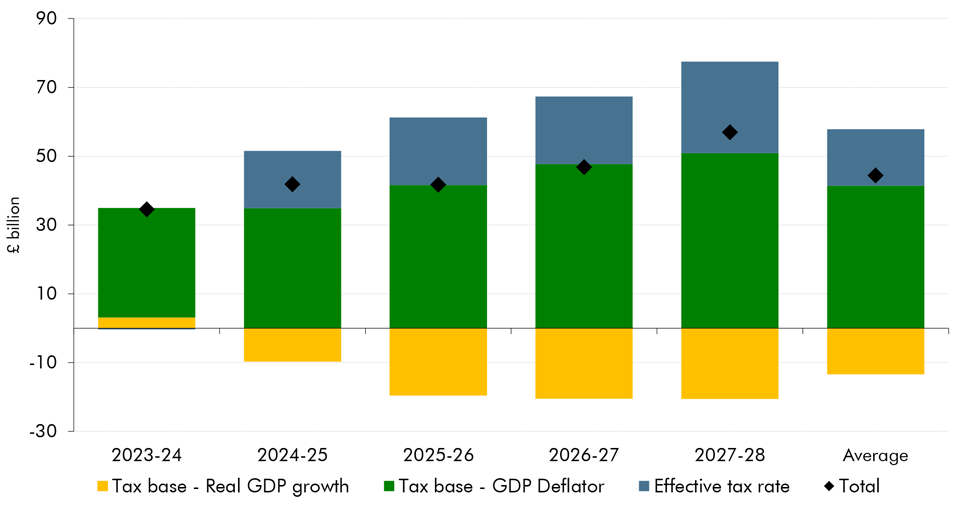
As shown in Chart B below, across all years of our forecast, higher and more persistent inflation is by far the largest driver of these upward revisions to taxes, by increasing the nominal tax base. The average upward revision since March in our pre-measures tax forecast is £44.4 billion a year (diamonds). Of this, £28.0 billion is explained by a larger tax base (nominal GDP). This is the net result of lower real GDP growth, which compared to our March forecast reduces receipts by £13.4 billion (yellow bars) and higher inflation, which increases receipts by £41.4 billion (green bars).b The rest is explained by a higher effective tax rate, which increases receipts by £16.4 billion (blue bars), about half of which is fiscal drag driven by strong earnings, and IT and NICs threshold freezes, which increase receipts by an average of £7.2 billion a year compared to our March forecast (explained in Box 3.1).
Chart B: National accounts taxes (excluding PSNB neutral): Changes since March
This box was originally published in Economic and fiscal outlook – March 2023