
Box sets » Receipts » Tax avoidance

The tax gap is the difference between taxes collected by HMRC and the theoretical liability, or what, in theory, should be collected. As a share of GDP, it has reduced from 2.3 per cent in 2005-06 to 1.5 per cent in 2021-22, two-thirds of which is explained by reductions in the VAT gap. In this box, we explored the recent drivers of changes in tax gaps, explained what assumptions we make about tax gaps in our forecast and outlined the associated uncertainties.
This box evaluated anti-avoidance measures implemented between 2011-12 and 2013-14. The exercise confirmed that while these costings were subject to significant uncertainty, there was no evidence of systematic bias.
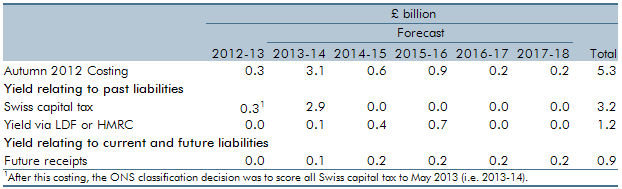
In recent years, the UK has entered into tax agreements with a number of offshore centres. This box evaluated the Autumn 2012 costing for the UK-Swiss tax agreement. More information can be found in Working paper No.8: Anti-avoidance costings: an evaluation
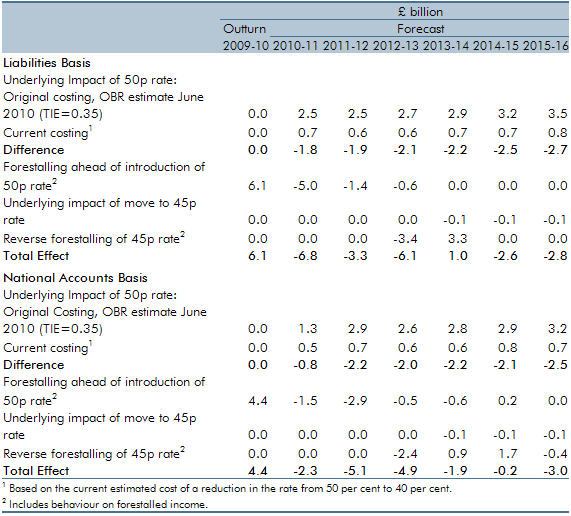
An additional rate of income tax of 50 per cent for incomes over £150,000 was introduced in April 2010. Budget 2012 announced that this rate would be reduced to 45 per cent from April 2013. This box set out how the Budget 2012 measure was costed, in particular the assumptions we made around behavioural responses and income shifting. Box 3.2 of our 2014 Forecast evaluation report reviewed this costing in detail.
Our forecasts for tax receipts do not generally include any explicit assumptions about changes in the level of tax compliance. This box highlighted why our VAT forecast is the one exception.