
Box sets » Uncertainty
Throughout a forecast process the OBR, in conjunction with other government departments, uses a number of approaches to understand uncertainty in our fiscal forecasts. This box set out these approaches in detail and looked at those taken when incorporating the fiscal impacts of new policy announcements.
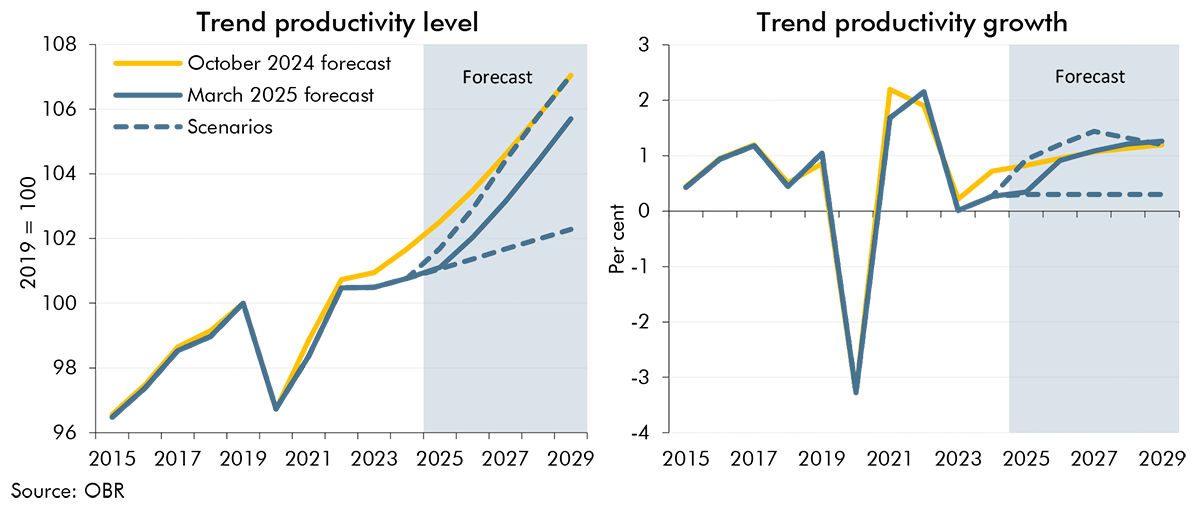
The outlook for trend productivity is one of the most important and uncertain forecast judgements. Successive past forecasts for trend productivity have proven to be too optimistic as productivity growth has continued to disappoint. In this box we explored two alternative scenarios for trend productivity: One where the recent weakness in trend productivity growth persists throughout the forecast period and one where it proves to be entirely cyclical and is offset by higher growth in the near-term.
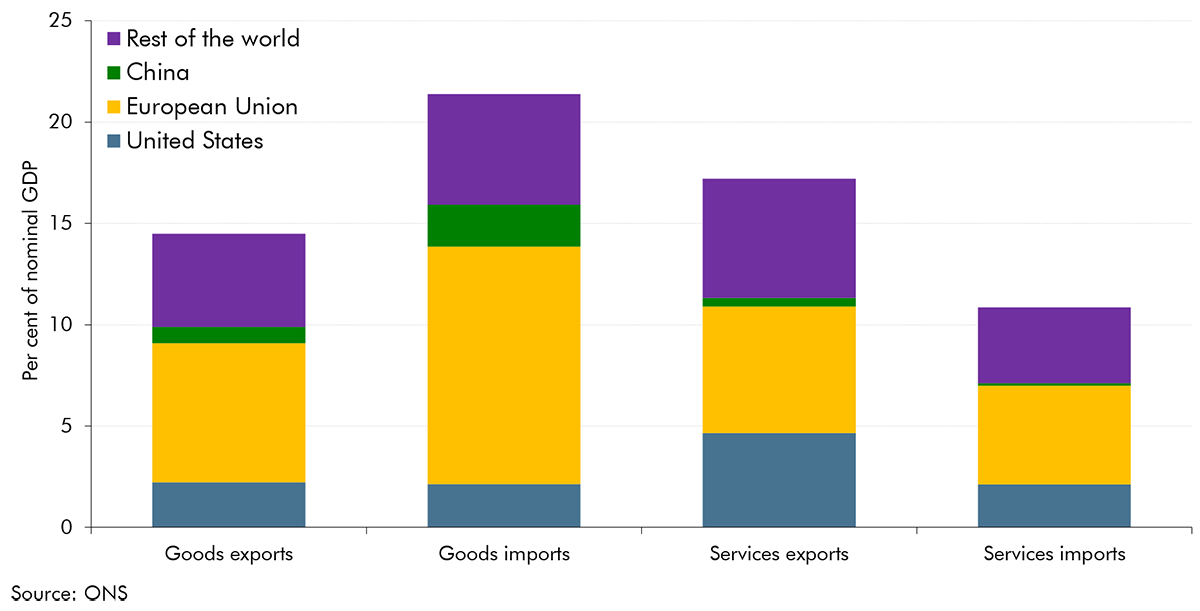
In the run-up to our March 2025 Economic and fiscal outlook, global trade policies had been subject to frequent changes and the future direction for trade policy was highly uncertain. In this box, we outlined three illustrative scenarios to show the potential impact of higher US and global tariffs on UK output and inflation, highlighting the primary transmission channels and their probable effects.
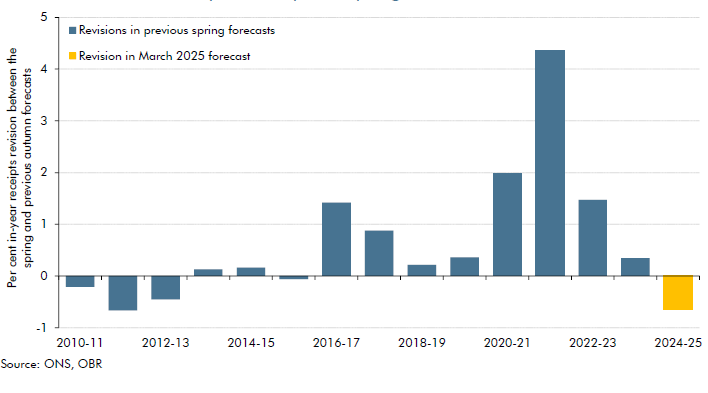
Our March 2025 forecast for 2024-25 receipts is £7.5 billion below our October 2024 forecast. This box compared this shortfall to past Autumn to Spring forecast changes, explained the reasons for this shortfall, and described its impacts on the forecast.
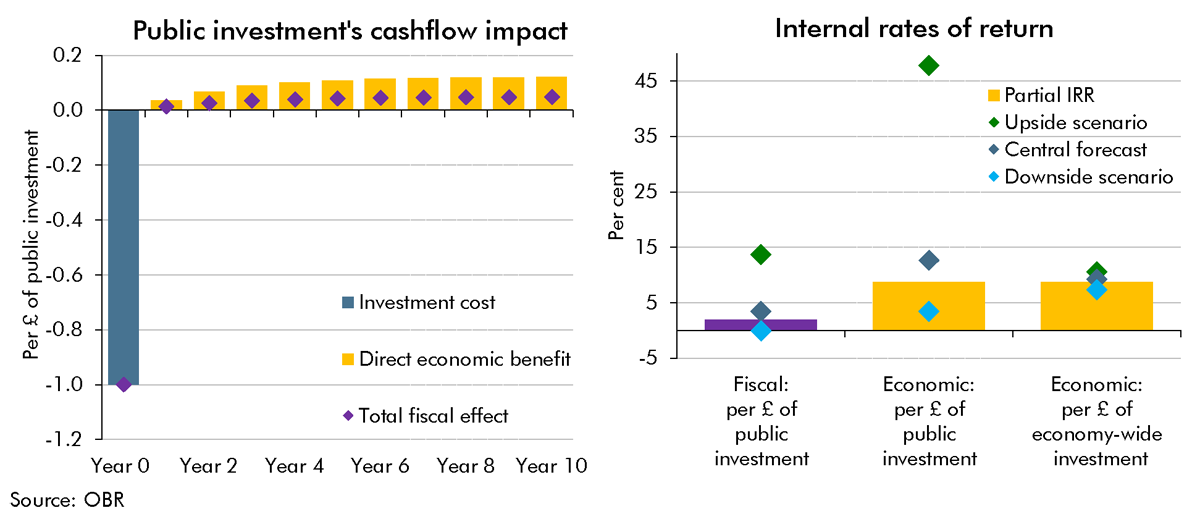
A key uncertainty around the long-run impact of the Budget's plans for higher public investment is the extent to which the public capital stock is a complement to (or substitute for) business investment. This Box provided scenarios in which the future business capital stock was higher or lower than we had assumed in our central forecast. We showed these scenarios' impacts on potential output in 50 years' time and the implications they had for different measures of the internal rate of return on investment.
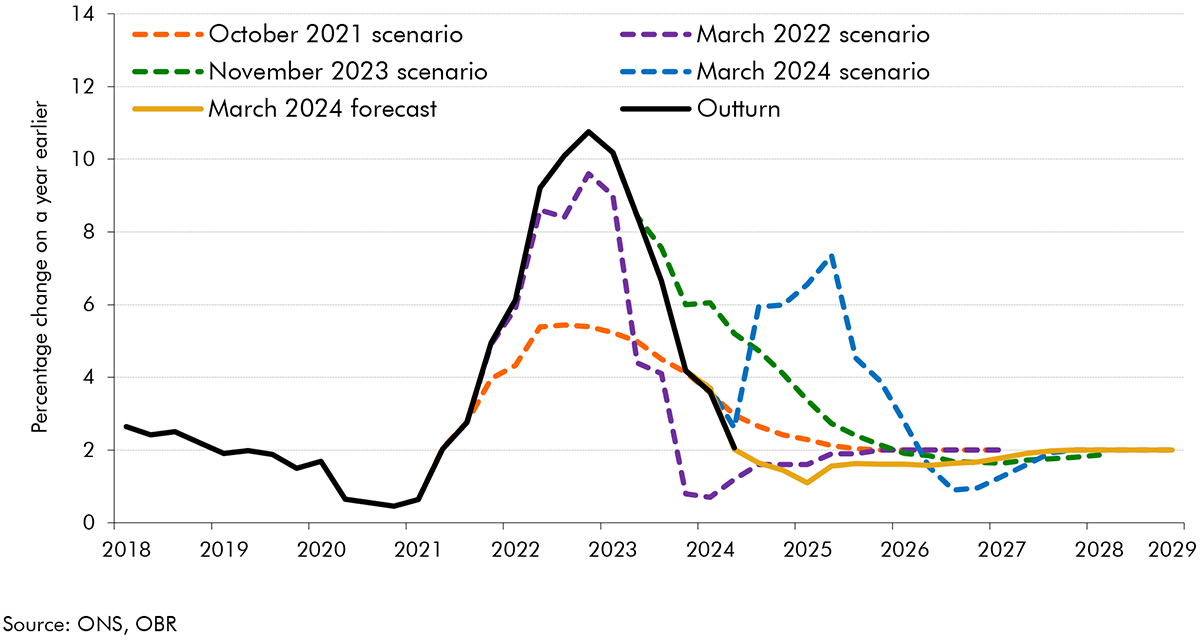
The outlook for inflation was highly uncertain at the time of our March 2023 forecast: the UK was experiencing the largest inflation shock since the 1980s, and the first significant shock in the era of independent inflation-targeting central banks. In this box, we reviewed the ways we have presented uncertainty in our successive EFOs, in particular our use of fan charts and scenarios.
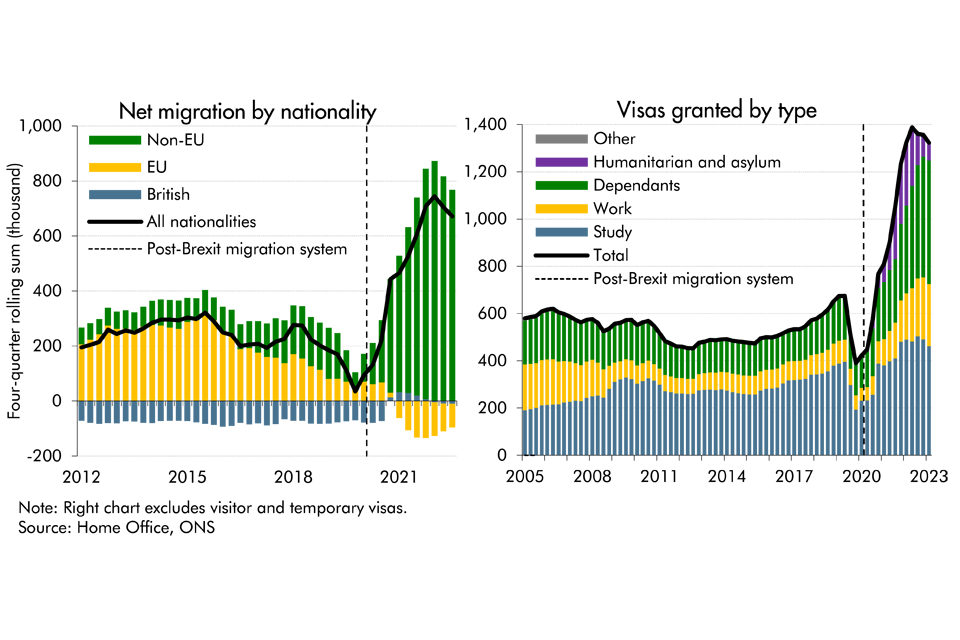
Latest data from the ONS suggest that net migration to the UK was higher than previously thought in recent years, while it's also projected to be higher than previously expected. In this box, we presented our migration forecast and its impact on labour supply. As there is considerable uncertainty around the outlook, we also considered alternative scenarios for net migration and its economic impact.

The tax gap is the difference between taxes collected by HMRC and the theoretical liability, or what, in theory, should be collected. As a share of GDP, it has reduced from 2.3 per cent in 2005-06 to 1.5 per cent in 2021-22, two-thirds of which is explained by reductions in the VAT gap. In this box, we explored the recent drivers of changes in tax gaps, explained what assumptions we make about tax gaps in our forecast and outlined the associated uncertainties.

Debt interest spending has reached post-war records as a per cent of revenue and GDP in recent years and has also proved to be incredibly volatile and subject to large revisions between our forecasts. In this box we looked at the reasons for this elevated spending and volatility and how the process of quantitative tightening by the Bank of England will impact the maturity of this debt.
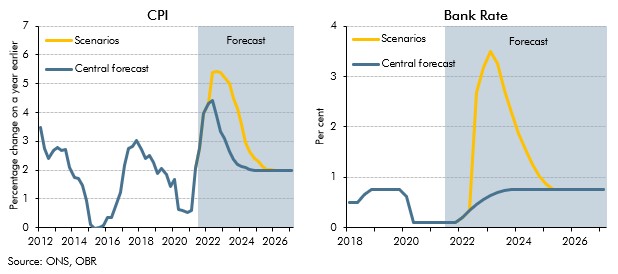
Inflation risks intensified after we closed our pre-measures forecast for the October 2021 Budget. This box showed two stylised scenarios embodying higher and more persistent inflation than in our central forecast to highlight the uncertainty surrounding the outlook. In one scenario inflation was driven mainly by pressures in the product market, and the other mainly pressures in the labour market, which had different implications for wages and consumption.
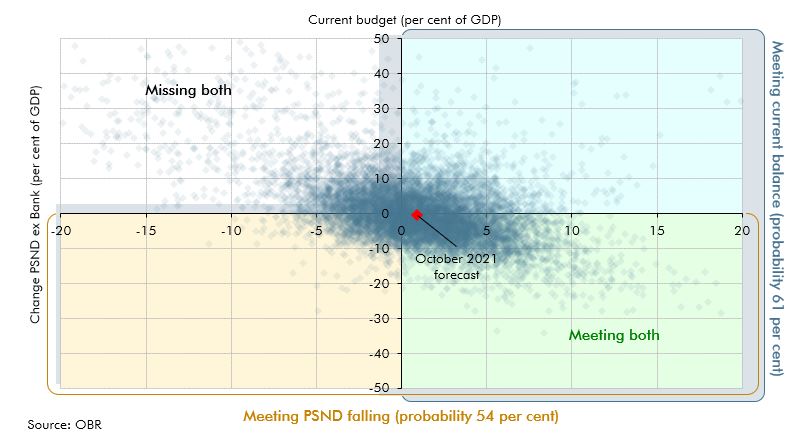
We illustrate the uncertainty around our forecasts using a variety of approaches. This box described using stochastic simulations to produce fan charts, which could be used to enhance presentation of uncertainty in future EFOs, and showed some experimental results.