
Latest data from the ONS suggest that net migration to the UK was higher than previously thought in recent years, while it's also projected to be higher than previously expected. In this box, we presented our migration forecast and its impact on labour supply. As there is considerable uncertainty around the outlook, we also considered alternative scenarios for net migration and its economic impact.
This box is based on Home Office and ONS data from November 2023, February 2024 and January 2024 .
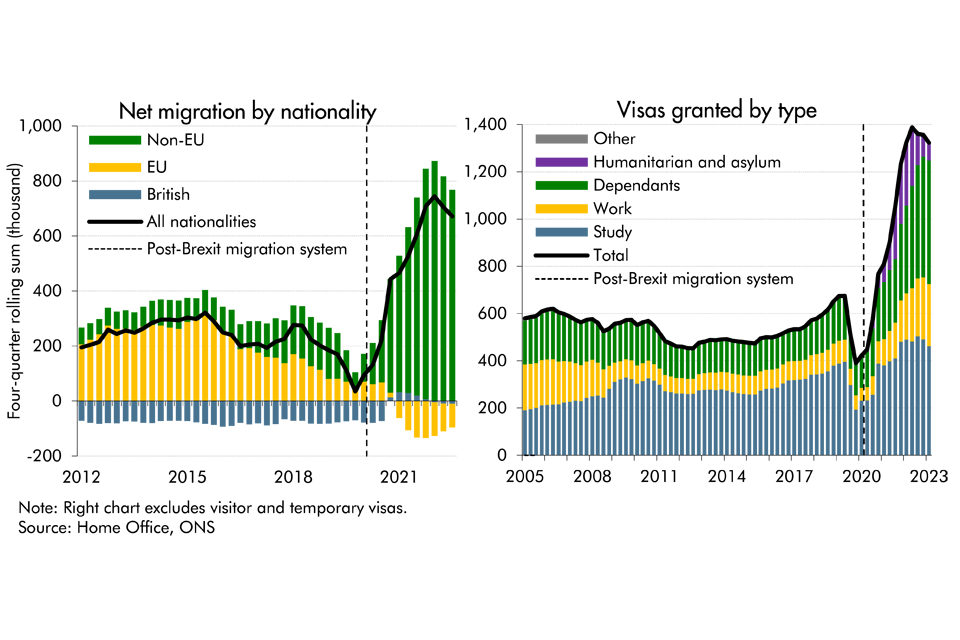
Updated ONS data published shortly after our November 2023 forecast showed large upward revisions to net migration – now estimated to have peaked at 745,000 in 2022, 140,000 higher than the initial estimate. The latest Home Office data show that visas granted (excluding visitors and temporary visas) peaked at around 1.4 million in the year to the first quarter of 2023, then fell back somewhat over the rest of the year (right panel, Chart C). Within this, work and especially dependant visas continued to grow in 2023, while student visas came down slightly and humanitarian visas fell sharply. New migrants come largely from non-EU countries, with EU net migration having fallen from over 250,000 in 2016 to turn negative in 2021 (left panel, Chart C). The large numbers and varying dynamics for types of visas create uncertainty for the path of net migration, whose potential effects we quantify in our scenarios below.
Chart C: Net migration by nationality and visas granted by type
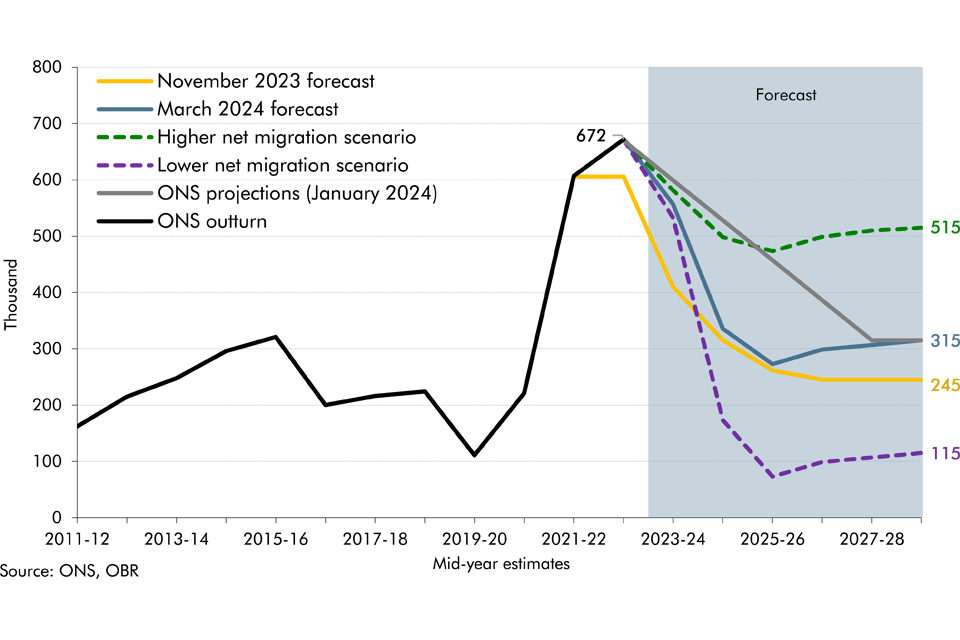
In January, the ONS published updated net migration projections which assume net inflows follow a linear path downward from the latest outturn of around 670,000 in the year to mid-2023 to a medium-term level of 315,000 from 2027-28. This is 70,000 higher than the steady state level of 245,000 assumed in their last set of projections and used in our November 2023 forecast. The ONS based this new assumption on a 10-year historical average to mid-2023, with the choice of horizon reflecting consultation with an expert panel.a
We use the new ONS medium-term net migration projection as the end point of our five-year forecast. While there remains considerable uncertainty about this projection, we judge that it is a reasonable estimate of the steady state level of net migration informed by consultation with migration experts. However, we have adjusted the near-term path of net inflows to incorporate a sharper short-term decline than the ONS straight-line path (Chart D). This reflects two factors:
- First, the recent rise in immigration, especially among students, should lead to higher emigration in the short term.b
- Second, immigration policy changes announced shortly after our November 2023 EFO will likely significantly reduce inflows in the near term.c The Home Office estimated those policies, together with those previously announced in May 2023, would cut immigration by 300,000 (mostly among dependants) under a hypothetical scenario where they were applied in the year to September 2023.d Most of the policies will have been introduced by April 2024, so we expect significantly reduced immigration levels from that point.
This means we now expect net migration to average around 350,000 a year over the forecast period, up from 290,000 in our November forecast. Cumulatively, this adds a further 350,000 people (around 300,000 adults) to the UK population over the next five years. However, these estimates are highly sensitive to alternative assumptions for future immigration levels, the share of previous immigrants that stay in the UK and the impact of government policy.
Chart D: Net migration forecast and scenarios
In constructing our economic forecast, we estimate that migrants coming to the UK over our forecast period have a slightly higher average participation rate than the adult UK resident population over our five-year forecast. This reflects a combination of three factors:
- Age: Migrants are more likely to be of working age (16-64) when they arrive.
- Composition: The post-Brexit composition of migrants has shifted more towards groups that have historically had lower participation rates (e.g. students and dependants). However, those groups have seen rising participation rates under the new migration system. For example, LFS data suggest that migrants coming to the UK to study are now more likely to be economically active, with their participation rate increasing from 30 per cent in 2019 to 48 per cent in the year to June 2023.e This is likely the result of the graduate route making it easier for students to enter the labour market after their studies.
- Dynamics: In the medium term, the longer migrants stay, the more likely they are to participate. While this tends to reverse after 10 years, that is beyond our forecast horizon.
Given the uncertainty around future migration flows, we explore two alternative scenarios where net migration is 200,000 higher or lower in the medium term and the total population in 2028-29 is one million higher or lower than in our central forecast (Chart D).f In each scenario, we explore the implications of alternative assumptions for migrants’ productivity and participation in the labour force.
In the high migration scenario, net migration falls by around 160,000 from its current level to settle at 515,000 a year in 2028-29. Looking at its potential economic implications:
- The blue bars assume the additional migrants have the same productivity per hour worked as the existing population.g This could reflect either investment responding so capital per worker is unchanged, or lower capital per worker offset by higher TFP growth. We also assume additional migrants have the same participation rate as the existing population. Based on these assumptions, GDP is 1.5 per cent higher in 2028-29, but GDP per person is largely unchanged.
- The yellow triangles show what would happen if the capital stock did not adjust at all in response to higher migration, making less capital available per worker and reducing overall productivity. GDP in 2028-29 is still higher but by a smaller amount (1 per cent), but GDP per person is then 0.4 per cent below our central forecast.
- The green diamonds show the impact of assuming additional migrants have a much higher participation rate than the adult UK population (around 90 rather than 63 per cent), consistent with a scenario where almost all adults arrive on work visas. This boosts the impact on GDP to 2.2 per cent in 2028-29 and raises GDP per person 0.8 per cent above our forecast.
The impacts in the lower migration scenario, in which net migration settles at 115,000 in 2028-29, are symmetric. These scenarios show that while additional (fewer) migrants generally boost (reduce) the level of aggregate output in the economy, the size of this impact and the effect on per person living standards is highly uncertain. The age, education, skill level, and participation rate of migrants, alongside the investment response of businesses, are all factors that determine the impact of migration on per person output. We explore the fiscal implications of net migration in Chapter 4.
Chart E: Real GDP and real GDP per person differences from our central forecast

This box was originally published in Economic and fiscal outlook – March 2024