
Box sets » Labour market » participation
The Pathways to Work Green Paper announced a range of welfare measures, some of which we have not incorporated in this forecast. In this box, we explained why some measures were not included, and indicated what risks they pose to our welfare spending and labour supply forecasts.
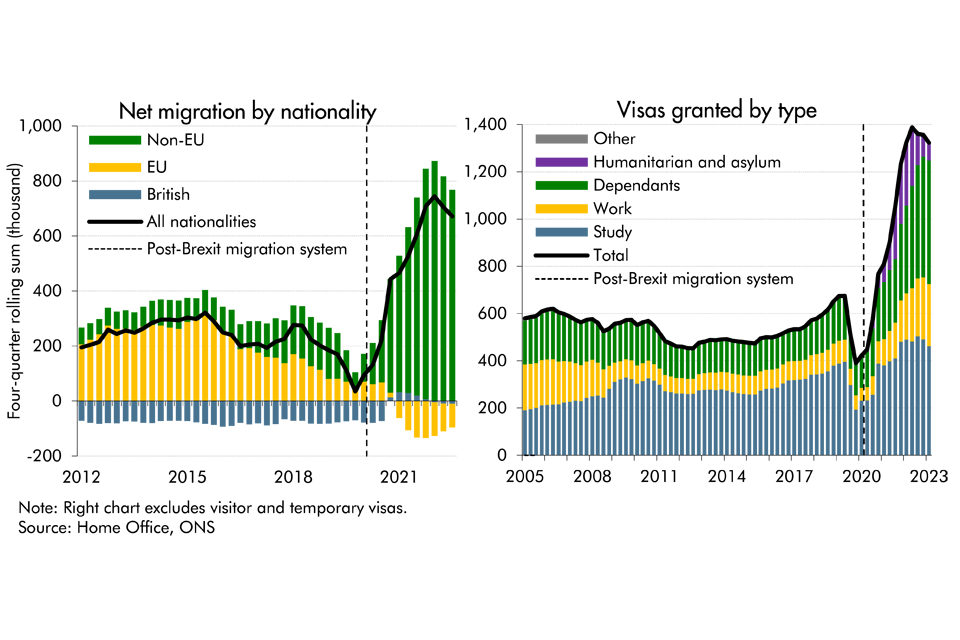
Latest data from the ONS suggest that net migration to the UK was higher than previously thought in recent years, while it's also projected to be higher than previously expected. In this box, we presented our migration forecast and its impact on labour supply. As there is considerable uncertainty around the outlook, we also considered alternative scenarios for net migration and its economic impact.
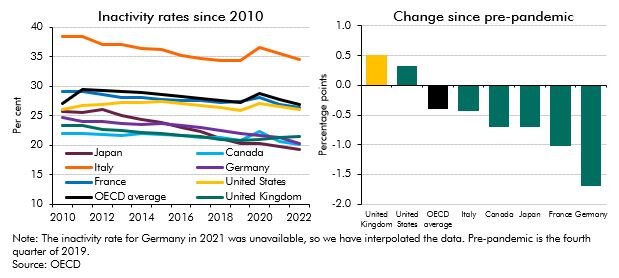
Inactivity fell across the G7 countries in the years prior to the onset of the pandemic and the UK consistently had one of the lowest inactivity rates. Since then inactivity has risen in the UK and US, but fallen across the rest of the G7 countries. This box detailed these changes and looked at ill-health as a driver of inactivity across the G7.
The referral to elective treatment waiting list in England has risen steadily since the onset of the pandemic, to 7.4 million treatments in April 2023. This box used waiting list and LFS data to estimate the effect on employment and inactivity of halving the waiting list by 2027-28.
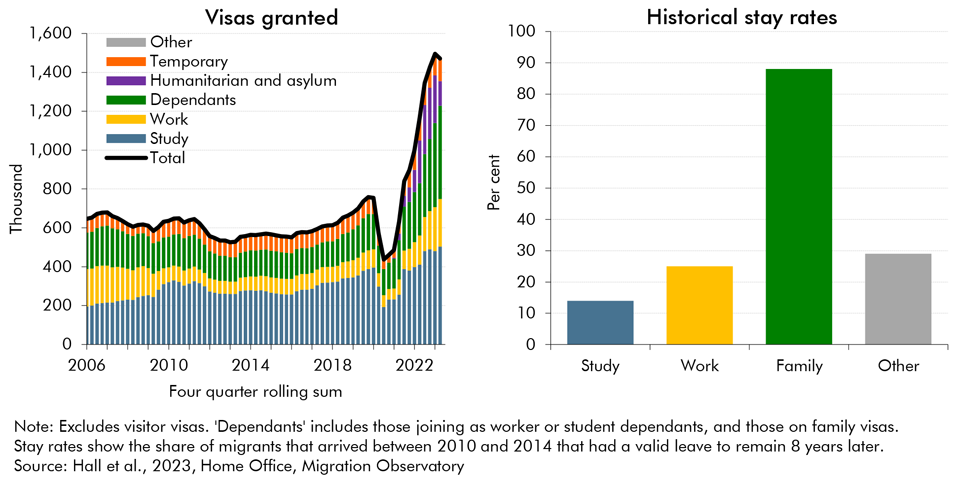
Net migration to the UK increased substantially in recent years but the ONS's population projections, that normally underpin our forecast, did not fully account for that rise at the time. In this box, we explored recent trends in migration and outlined our revised near-term migration forecast. We also examined how likely the migrants were to participate in the labour market.