
Inactivity fell across the G7 countries in the years prior to the onset of the pandemic and the UK consistently had one of the lowest inactivity rates. Since then inactivity has risen in the UK and US, but fallen across the rest of the G7 countries. This box detailed these changes and looked at ill-health as a driver of inactivity across the G7.
This box is based on OECD data from July 2023 .
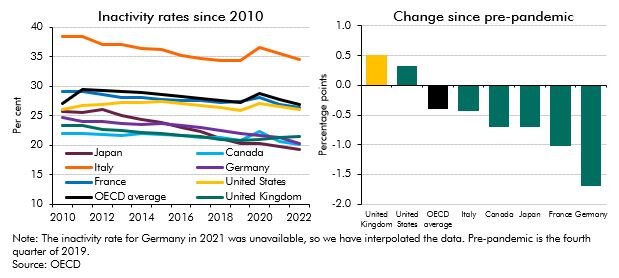
Between 2010 and the onset of the pandemic in early 2020, the UK consistently had one of the lowest 15-64-year-old inactivity rates among G7 economies, with only Japan recording a lower rate in late 2019 (left panel of Chart A). The initial phase of the pandemic saw inactivity rise everywhere bar Germany, before falling everywhere but the UK in 2021 and 2022. This means that since the pandemic, the 15-64-year-old inactivity rate has increased in the UK by 0.5 percentage points and by 0.3 percentage points in the US (where modest falls in inactivity in 2021 and 2022 have not offset the rise in 2020), but fallen in the other five G7 economies (as shown in the right panel of Chart A). As a result, the UK’s inactivity rate has moved above that of Canada and Germany over this period, but remains below the OECD average.
Chart A: 15-64-year-old inactivity rates across G7 economies
Comparable data on the reasons why people are inactive across advanced economies is much more limited, although most countries run similar labour force surveys that provide some self-reported information, including a measure of illness or disability as the main driver. Pre-pandemic analysis showed that illness or disability consistently made up a larger proportion of inactivity in the UK than in European economies, although not to the degree that it did in the US. In the mid-2010s, the proportion of the working-age population inactive due to illness or disability stood at just under 6 per cent in the UK, compared to around 4 per cent in the euro area and around 7 per cent in the US.a More up-to-date data are available for European economies but focus only on the subset of economically inactive people who say that they want a job (a small minority in the UK – around one-fifth of working-age inactive people). Similarly, this shows that the proportion of both the younger and older working-age populations inactive due to ‘own illness or disability’ and wanting a job has been persistently higher in the UK than in Germany, France and Italy over the course of the 21st century. And these gaps widened between 2019 and 2021 thanks to rates in the UK staying flat or rising, while they fell in Germany and France.b
In conclusion, the available international evidence suggests that while the UK has consistently been a strong performer internationally in terms of working-age participation, its post-pandemic rise in inactivity stands out. And ill-health has consistently been a bigger factor behind inactivity in the UK than in most other advanced economies, with post-pandemic trends likely to have amplified these differences.
This box was originally published in Fiscal risks and sustainability – July 2023