
Net migration to the UK increased substantially in recent years but the ONS's population projections, that normally underpin our forecast, did not fully account for that rise at the time. In this box, we explored recent trends in migration and outlined our revised near-term migration forecast. We also examined how likely the migrants were to participate in the labour market.
This box is based on Home Office, Migration Observatory and ONS data from August 2023, October 2023 and May 2023 .
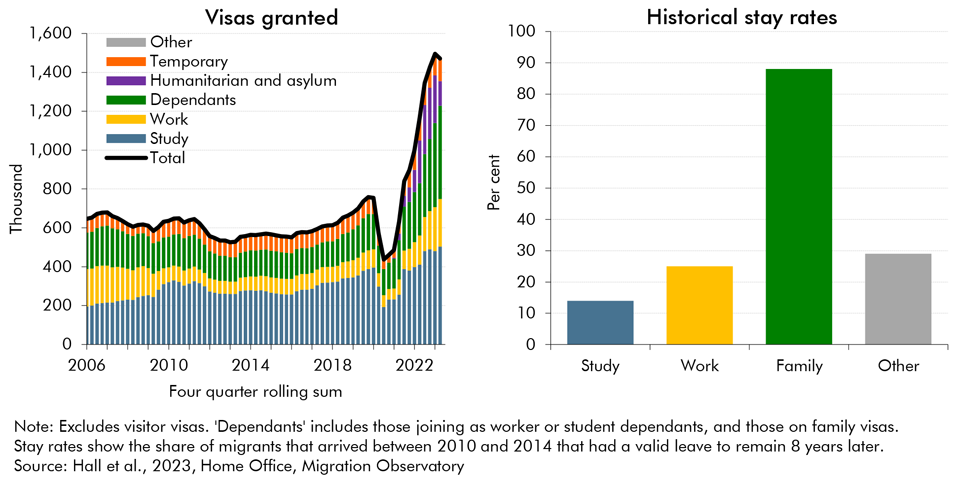
Net migration has increased substantially in the wake of the pandemic, mainly driven by an increase in humanitarian visas, international students, and dependants. The latest ONS data show net migration was more than 600,000 in 2022,a compared to around 220,000 in 2019. This was entirely driven by an increase in non-EU immigration. EU net migration has turned negative under the new post-Brexit immigration regime and stood at -50,000 in 2022. Home Office data show visas granted continued rising in the first half of 2023, on a rolling annual basis, with humanitarian visa issuance falling but the remaining categories continuing to rise (left panel, Chart D). In terms of sub-categories, visas for health and care workers showed a substantial pickup, growing by more than 150 per cent in the year to June 2023.
Future migration levels are highly uncertain and difficult to forecast, but high recent immigration levels should also result in higher levels of emigration in the coming years. This is especially likely for students, as most tend to leave a few years after their arrival when they have completed their studies. However, international students are now likely to stay for longer, as the new Graduate Visa route allows them to stay for 2 years after their graduation. The medium-term stay rate of (non-temporary) workers has also historically been fairly low, though the recent inflow of migrants come from countries and work visa subtypes that have traditionally had higher ‘stay rates’. Accounting for those changes in the composition of migration, Hall et al (2023) estimate workers’ average stay rate will increase from 25 per cent between 2010 and 2014 to 57 per cent under the new regime. A summary of historical ‘stay rates’ for some visa groups is shown in the right panel of Chart D.
Chart D: Visas granted by category and migrants’ stay rates 8 years after arrival
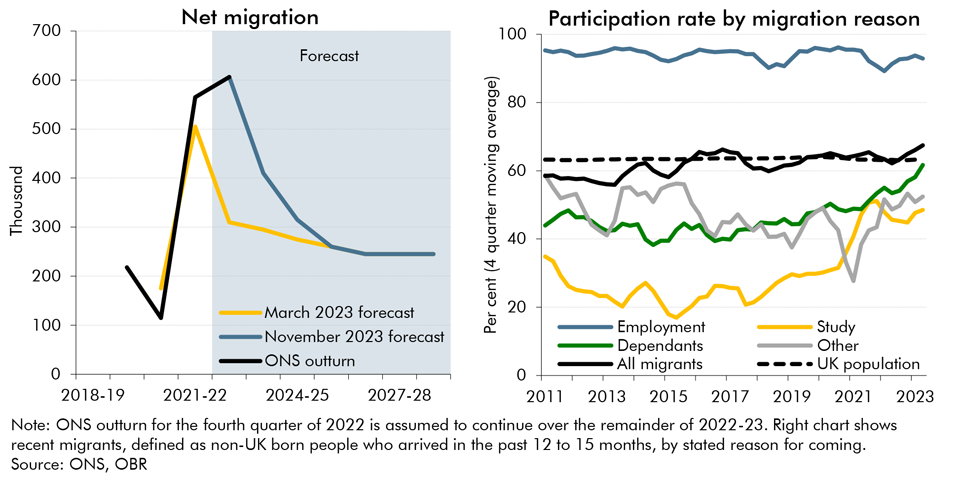
This likely increase in emigration, alongside recent changes in government policy, means that we assume net migration will gradually fall from current high levels. In the absence of updated population projections, we retained the ONS’s 2020-based projections for long-term net migration settling at 245,000,b which is also broadly consistent with the Government’s ambition to bring net migration back to pre-pandemic levels. Since March, the Government has taken several measures to tighten the migration regime including the increase in visa fees, the immigration health surcharge and restrictions on student dependants, which support this trajectory. Taking account of the impact of government policy as well as recent studies of post-Brexit migration flows,c we have assumed a transition path from the higher recent migration outturns to the ONS’s long-term population projection from 2025-26. This results in a higher near-term path for net migration than forecast in March (left panel, Chart E) and adds 150,000 more people to the population over the next five years.
To forecast the impact of this higher near-term net migration on total labour supply, we assume that migrants have the same labour market participation rate as the UK resident population. This is consistent with ONS time-series data on the participation rates of different migrant groups and the overall composition of recent arrivals under the post-Brexit migration regime. The LFS suggests that the average participation rate of the UK adult population was around 63 per cent in the year to June 2023, while that of recently arrived migrants was 67 per cent (right panel, Chart E). Those migrants who arrive for work reasons tend to have the highest participation rates of over 90 per cent. Those that arrive as students, dependants, or for other reasons tend to have below average labour participation rates, albeit with some convergence in recent years. As the LFS sampling is likely under-representing students and dependants, who have lower participation rates than workers, the average participation rate for all migrants is probably an overestimate. Over time, this may be partly offset by migrants, on average, becoming increasingly likely to participate in the labour market the longer they stay and settle in the UK.
Chart E: Net migration and the participation rate of recent migrants by reason
Based on these assumptions, the increase in our migration forecast relative to March adds 70,000 people to the labour force over the next five years. While these assumptions are highly uncertain, we judge the risks around them to be balanced. Future net migration levels could be higher than assumed in our forecast, if work or student visa issuance remains high or if a larger share of new migrants end up staying in the UK. On the other hand, recent humanitarian arrivals from Ukraine, Hong Kong, and other countries could leave in greater numbers, either to return home or move to a third country. Similarly, there is considerable uncertainty around the participation rate of inward migrants, which could be higher or lower than we have assumed. We will continue to review these judgements in light of upcoming ONS data releases on population and the labour market.
This box was originally published in Economic and fiscal outlook – November 2023