
Box sets » Fiscal risks and sustainability - July 2023
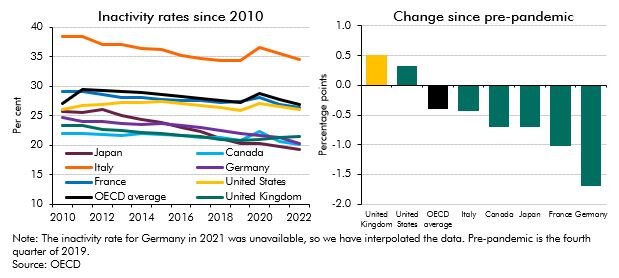
Inactivity fell across the G7 countries in the years prior to the onset of the pandemic and the UK consistently had one of the lowest inactivity rates. Since then inactivity has risen in the UK and US, but fallen across the rest of the G7 countries. This box detailed these changes and looked at ill-health as a driver of inactivity across the G7.
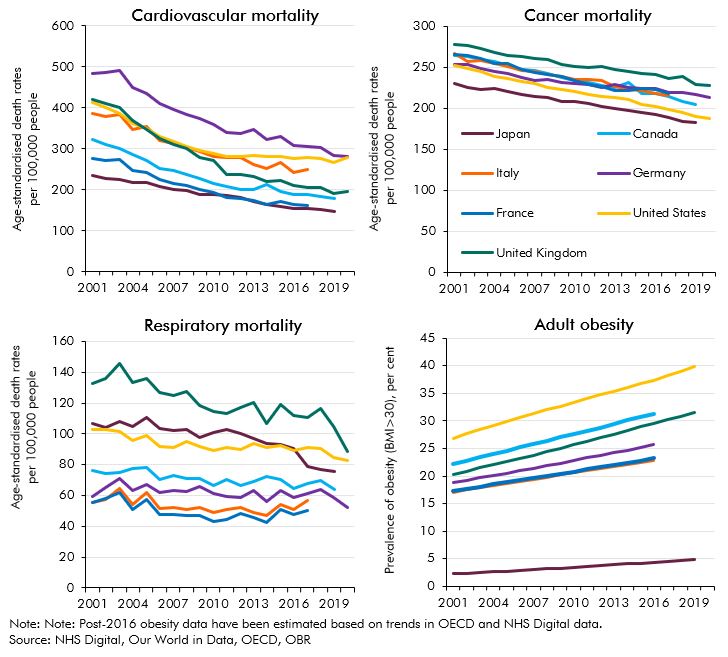
The improvements seen in life expectancy and a variety of other health indicators in the UK over a period of several decades have slowed down and - in some cases - partially reversed. This box detailed these changes and compares them to trends in other G7 countries.
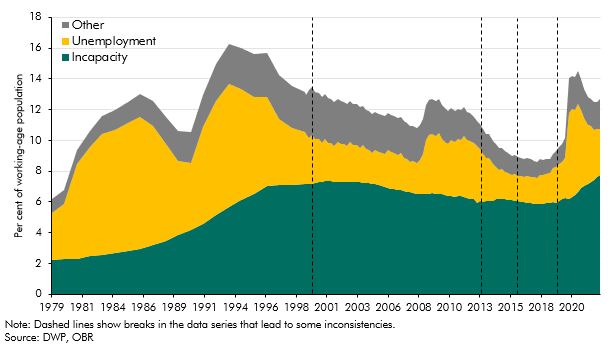
Benefits for working-age claimants with health problems have changed significantly over the last thirty years through the introduction of new benefits and assessments. This box described how the UK welfare system operates for working age claimants with and without health problems, and how this has changed over time.
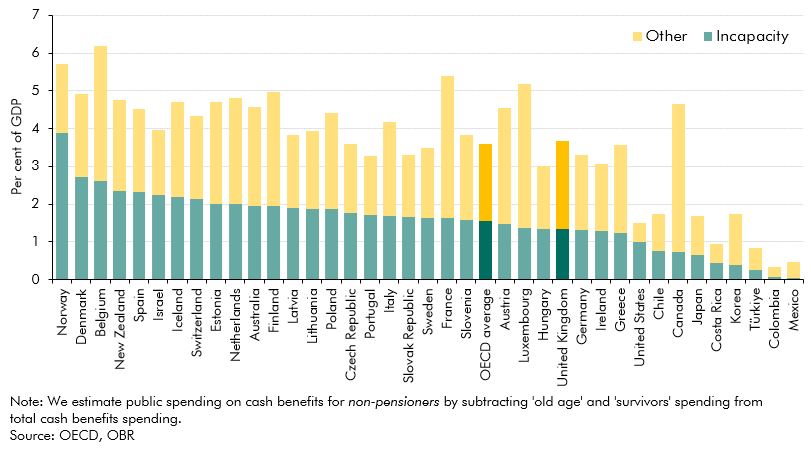
The UK spent close to the OECD average on non-pensioner cash benefits in 2019. This box compared the provision and generosity of health-related welfare across countries, drawing on several international studies.
The referral to elective treatment waiting list in England has risen steadily since the onset of the pandemic, to 7.4 million treatments in April 2023. This box used waiting list and LFS data to estimate the effect on employment and inactivity of halving the waiting list by 2027-28.
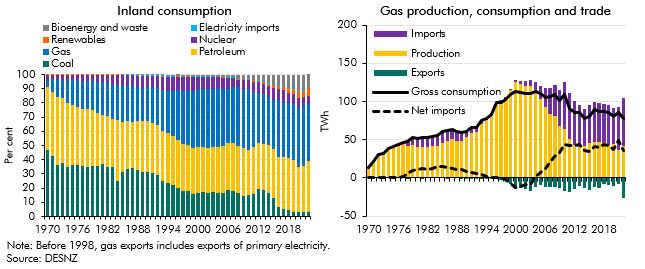
Since 1970 the UK's energy sector has undergone significant shifts following the discovery of oil and gas in the North Sea and the energy shocks of the 1970s. In this box we summarised the historical events and changes that has led to the UK has become increasingly dependent on imported gas.
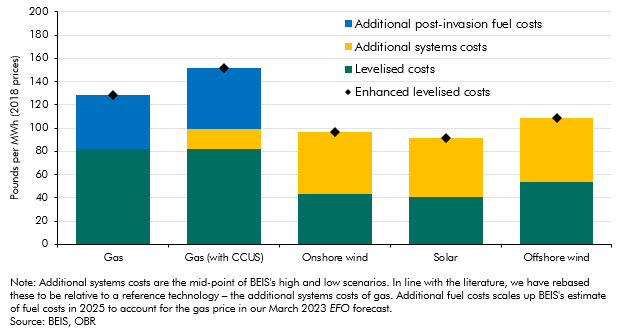
An estimate of the full cost of different energy sources to the power system needs to reflect more than just the construction and operating costs of energy generators that are captured in the levelised cost of electricity (LCOE). In this box we explored enhanced measures of levelised costs of energy.
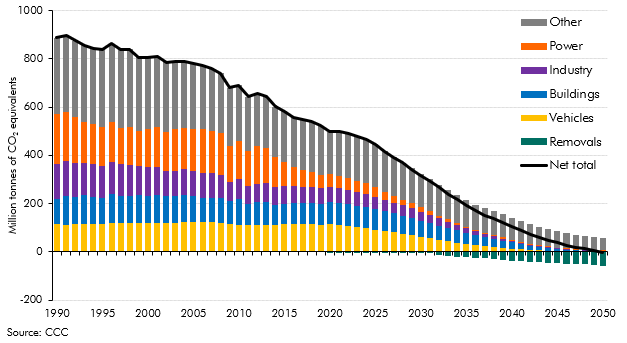
Since our 2021 Fiscal risks report - which showed that reaching net zero carbon emissions will have significant impacts on the public finances in the UK - estimates of the fiscal impacts of reducing emissions in other countries have begun to be produced. In this box we recapped our 2021 work and discussed how IMF and French analysis compared to it.
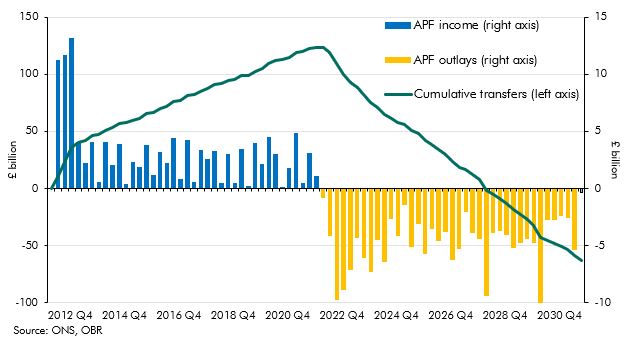
Up to July 2022 the Bank of England's quantitative easing (QE) activities had made large profits resulting in large transfers to the Treasury but since then flows have reversed. This box described what the whole lifetime direct costs of QE would be based on our March EFO assumptions.
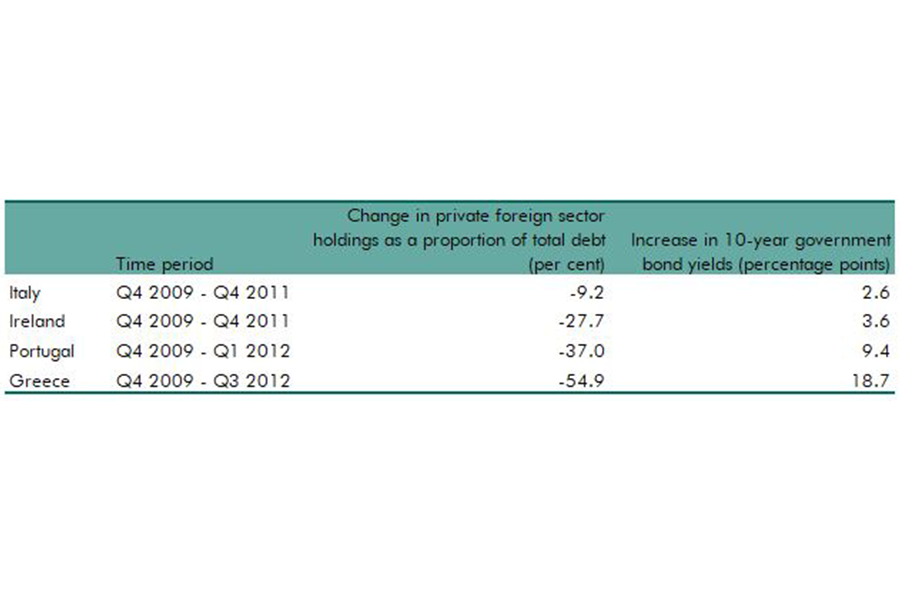
As the stock of foreign holdings of UK debt has risen this century, so have questions about the risks of increasing, relatively high, levels of these holdings. This box looked at the why holdings of debt by foreign investors may lead to greater market volatility.
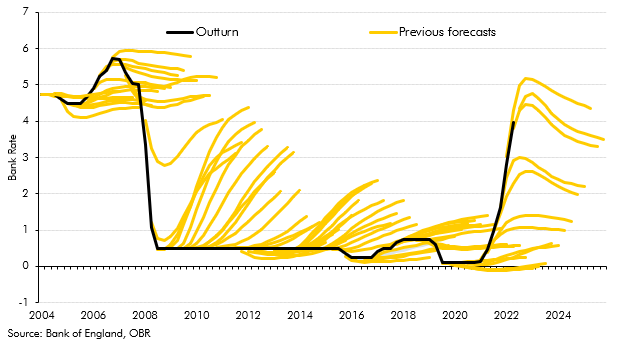
There has been a notable shift in the environment of interest rates over the past 18 months in the UK. This box looked at the extent of surprise for rate rises relative to market implied expectations and the increase in capital adequacy ratios of UK banks since the global financial crisis.