
The UK spent close to the OECD average on non-pensioner cash benefits in 2019. This box compared the provision and generosity of health-related welfare across countries, drawing on several international studies.
This box is based on OECD and OBR data from July 2023 .
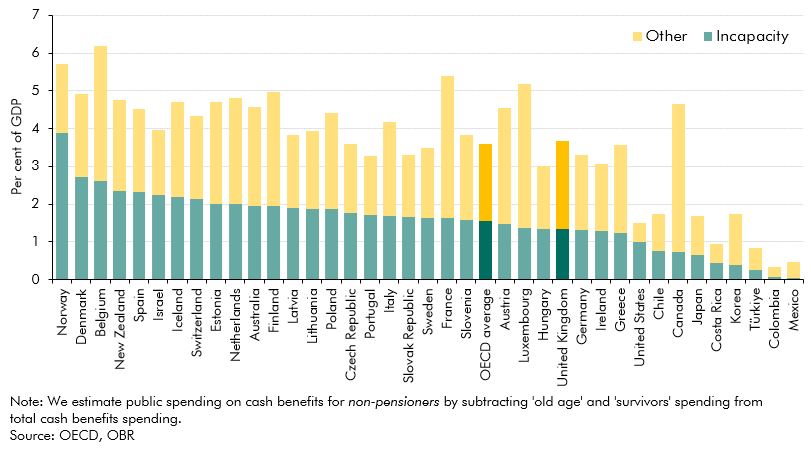
Immediately prior to the pandemic in 2019, the UK’s spending on total non-pensioner cash welfare benefits was similar to the average across OECD countries, at 3.7 and 3.6 per cent of GDP respectively (Chart F). Within this, the UK’s spending on incapacity-related benefits (1.3 percent of GDP) was slightly below the OECD average (1.6 per cent of GDP), by a margin that has remained broadly consistent since 2010 (when these figures were 1.5 and 1.7 per cent of GDP, respectively).
Chart F: Spending on non-pensioner cash benefits across OECD countries, 2019
Of course, health-related cash benefit spending as a share of GDP is only a rough proxy for the relative generosity of different aspects of a country’s welfare system. It is difficult to make more granular comparisons across countries due to large differences in the way their health-related welfare systems operate, particularly in terms of the respective roles of the social security system itself, broader public service provision and employers. For example, some countries provide cash payments to meet extra costs (as with PIP in the UK), while others, such as the Nordic countries, provide services in kind instead.a And some – such as the Netherlands and Spain – place heavy obligations on employers to support employees who fall ill or meet the associated welfare costs; which partly explains the more extensive occupational health systems available in many European economies than the relatively fragmented and voluntary one in the UK.b All that said, comprehensive OECD studies produced before the pandemic found that the generosity of health-related benefits in the UK is close to average both as a share of average earnings and as a share of unemployment benefits.c
This box was originally published in Fiscal risks and sustainability – July 2023