
Box sets » Economic and fiscal outlook - March 2024
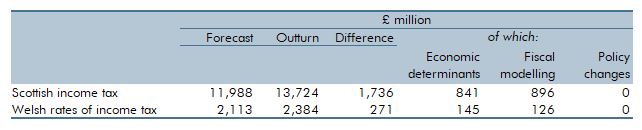
Income tax was devolved to the Scottish Parliament in 2016 and the Welsh Senedd in 2019. In this box we evaluated our March 2021 forecasts for 2021-22, and how they compared to the eventual outturn data. This was a particularly difficult period to forecast given the economy was recovering from the unprecedented impact of the Covid-19 pandemic. The double-digit difference between our initial forecast and the final outturn, for both Scotland and Wales, is largely explained by the faster-than-expected post-pandemic recovery.
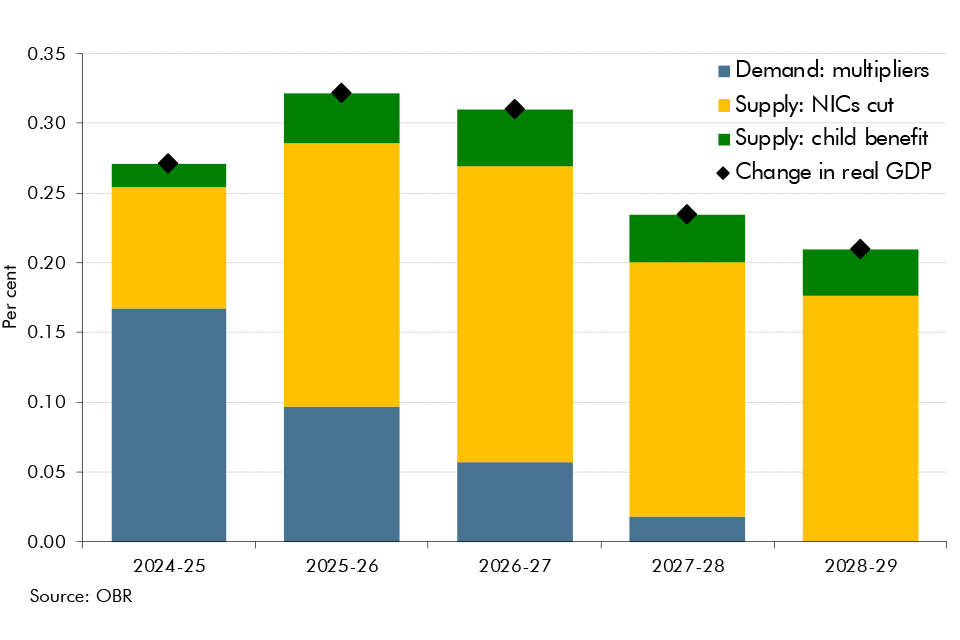
In each Economic and fiscal outlook we publish a box that summarises the effects of the Government’s new policy measures on our economy forecast. These include the overall effect of the package of measures and any specific effects of individual measures that we deem to be sufficiently material to have wider indirect effects on the economy. In our March 2024 Economic and fiscal outlook, we adjusted our forecast to account for fiscal loosening and considered the effects of policy to boost employment on our potential output forecast.
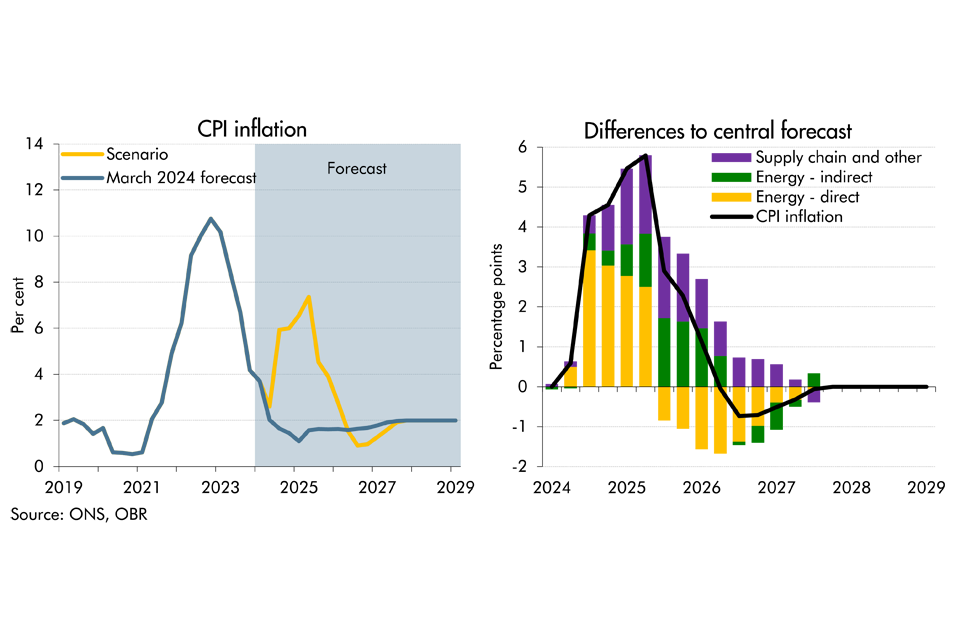
As tensions have risen in the Middle East, there has been increasing concern over the possibility of a wider escalation in the region and its implications on the UK economy. In this box we considered the economic growth and inflationary implications of an adverse scenario. In this scenario, supply chain disruption reaches levels not seen since the pandemic levels and energy costs rise sharply for a second time since the pandemic.
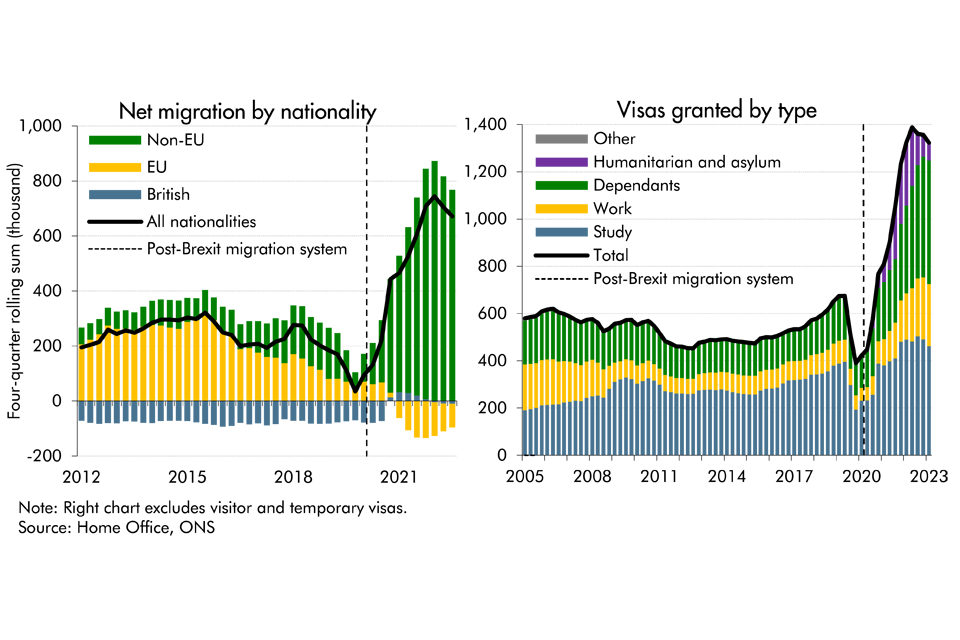
Latest data from the ONS suggest that net migration to the UK was higher than previously thought in recent years, while it's also projected to be higher than previously expected. In this box, we presented our migration forecast and its impact on labour supply. As there is considerable uncertainty around the outlook, we also considered alternative scenarios for net migration and its economic impact.
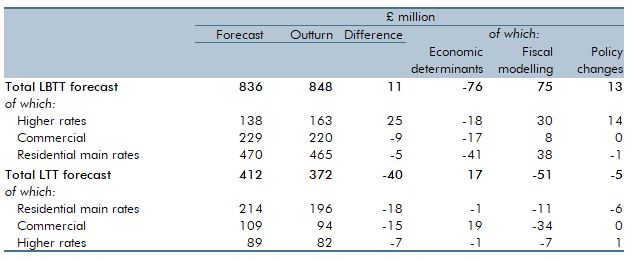
The land and buildings transaction tax (LBTT) was implemented in Scotland on April 1 2015 while the land transactions tax (LTT) began in April 1 2018. Both taxes replaced the UK Government’s stamp duty land tax but operate in similar ways. In this box we evaluated our March 2022 forecasts for 2022-23, and how they compared to the eventual outturn data. We explained the reasons behind the 1.4 per cent surplus for LBTT and the 9.6 per cent shortfall for LTT.
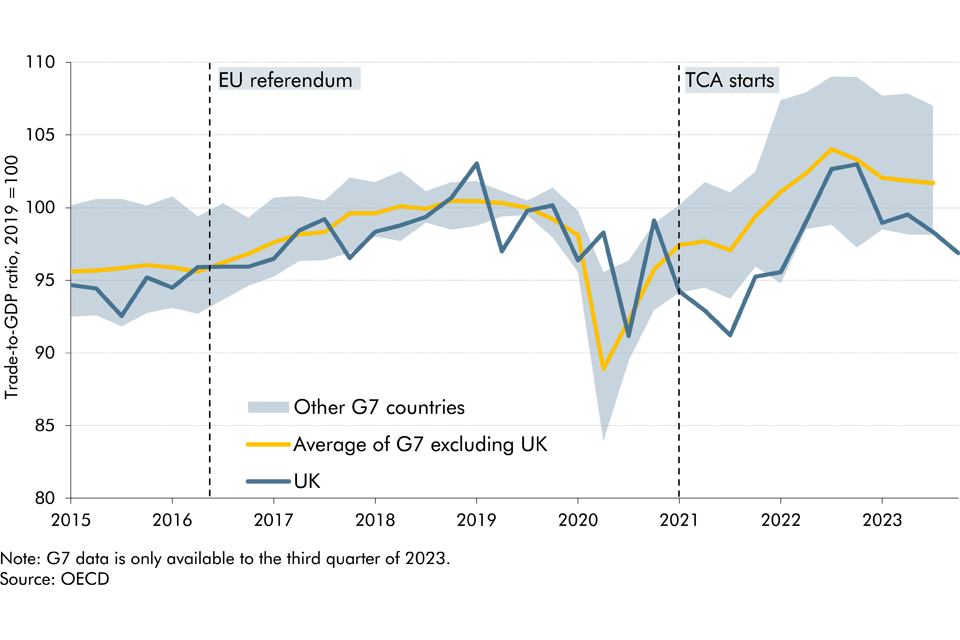
Since the June 2016 EU referendum, our forecasts have incorporated a set of assumptions about the economic impact of Brexit on trade, productivity, investment, and migration. In this box, we assessed our current assumptions on trade against the latest evidence.
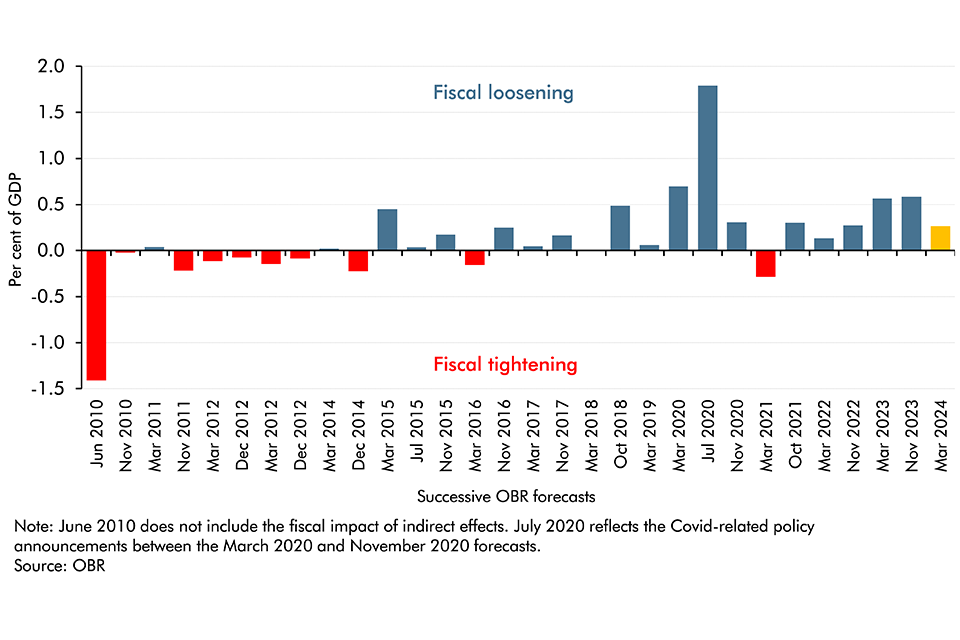
In Budget 2024, the Chancellor has chosen to loosen fiscal policy following the improvement in the underlying fiscal outlook. This continues the consistent pattern of expansionary fiscal policy packages that have been announced in recent years. Since 2010, in every instance of good news on the underlying fiscal position, the policy response has been to spend at least some of the windfall.
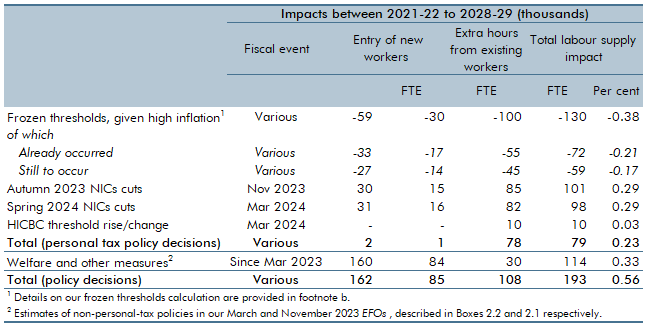
Between March 2021 and November 2022, almost all the main allowances and thresholds in income tax and national insurance contributions (NICs) were frozen rather than indexed to inflation, as is the default in nearly all cases, up to and including 2027-28. The Chancellor has subsequently announced personal tax cuts that are due to offset around a half of the resulting impact on the personal tax burden by 2028-29. In this box, we showed estimates for total effects of these policy decisions on work incentives, given high inflation, over the period from 2021-22 to 2028-29.
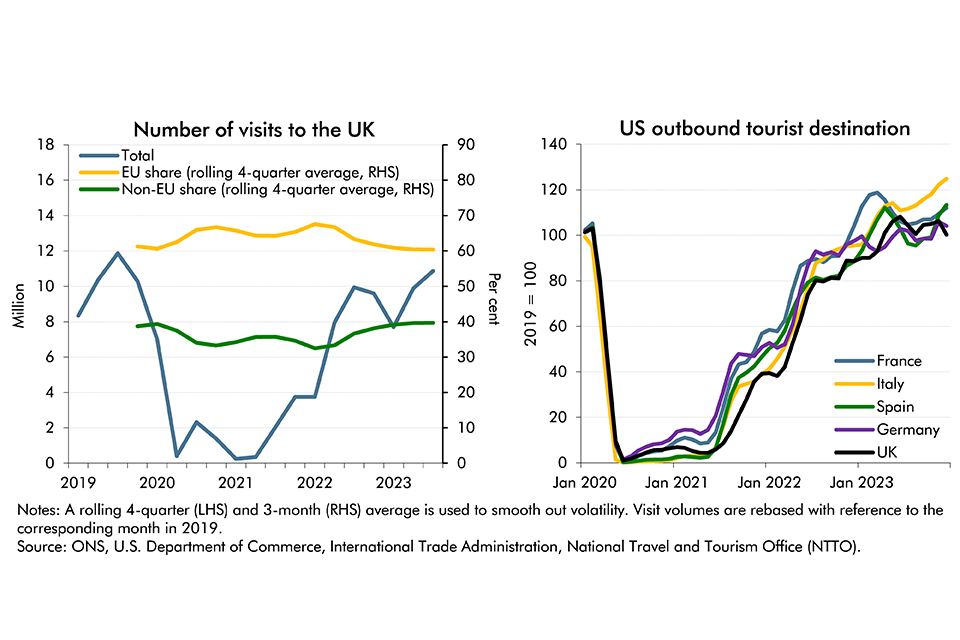
The VAT Retail Export Scheme enabled non-EU visitors to the UK to reclaim the VAT incurred in purchasing goods from participating retailers. It was abolished following the UK’s exit from the EU in January 2021. In reviewing our November 2020 costing in this box, we concluded that its methodology still appears reasonable and that the costing was a central estimate. We updated that estimate to account for the impacts of visitors’ wider spending, but continued to believe that this measure is unlikely to significantly affect the productive capacity of the economy.

The tax gap is the difference between taxes collected by HMRC and the theoretical liability, or what, in theory, should be collected. As a share of GDP, it has reduced from 2.3 per cent in 2005-06 to 1.5 per cent in 2021-22, two-thirds of which is explained by reductions in the VAT gap. In this box, we explored the recent drivers of changes in tax gaps, explained what assumptions we make about tax gaps in our forecast and outlined the associated uncertainties.

In the final four years of our March 2024 forecast, departmental spending follows an overall envelope set by the Government because the detailed departmental spending plans set at the last Spending Review only extend to March 2025. In this box, we explored the implications of these plans for different departments, and how past governments have revised departmental spending at Spending Reviews.

Debt interest spending has reached post-war records as a per cent of revenue and GDP in recent years and has also proved to be incredibly volatile and subject to large revisions between our forecasts. In this box we looked at the reasons for this elevated spending and volatility and how the process of quantitative tightening by the Bank of England will impact the maturity of this debt.
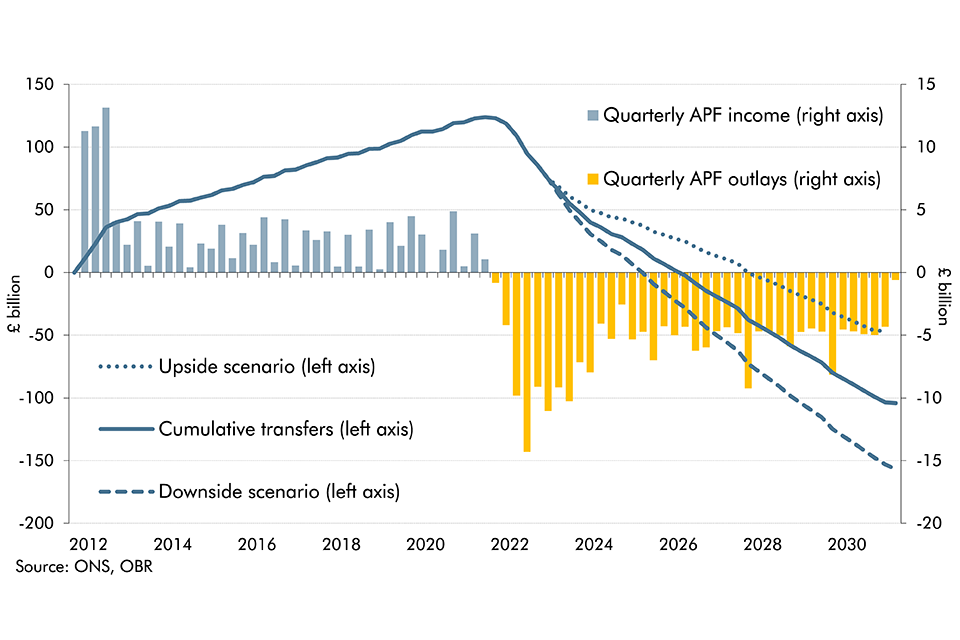
The Bank of England's Asset Purchase Facility (APF) conducts the Bank's operations for quantitative easing and tightening. In this box we updated our estimate of the lifetime direct costs of the APF and scenario analysis looked at the impact of changes in interest rates on this lifetime cost.

Following the upwards revision to our migration forecast, this box explored the implications of higher migration on our central forecasts for tax revenues, spending and borrowing. We also drew on alternative scenarios for migration to illustrate how uncertainty in the migration forecast translates into the fiscal forecast.

Public sector net debt (excluding the Bank of England) as a share of GDP has tripled since the beginning of this century. This box explored the drivers of the rise and its evolution over the forecast.