
In Budget 2024, the Chancellor has chosen to loosen fiscal policy following the improvement in the underlying fiscal outlook. This continues the consistent pattern of expansionary fiscal policy packages that have been announced in recent years. Since 2010, in every instance of good news on the underlying fiscal position, the policy response has been to spend at least some of the windfall.
This box is based on OBR data from March 2024 .
In this Budget, the Chancellor has chosen to loosen fiscal policy by 0.3 per cent of GDP per year on average over the next 5 years, in response to an 0.1 per cent of GDP improvement in the underlying (pre-measures) fiscal outlook over that same period.a As Chart A shows, this continues the consistent pattern of expansionary fiscal policy packages that have been announced in recent years. Since December 2014, fiscal policy has been tightened in only two out of twenty fiscal events. This pattern is partially explained by the Government using fiscal policy to support the economy in the face of the series of shocks it has faced during that time. It contrasts sharply with the persistent tightening of fiscal policy between 2010 and 2014.
Chart A: Cumulative size of fiscal policy packages, 2010 to 2024
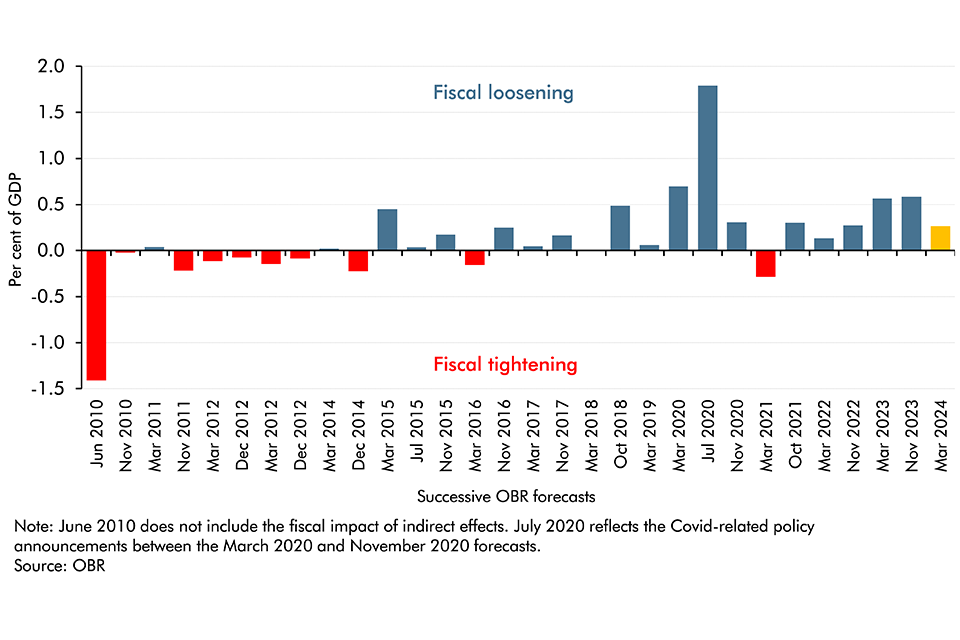
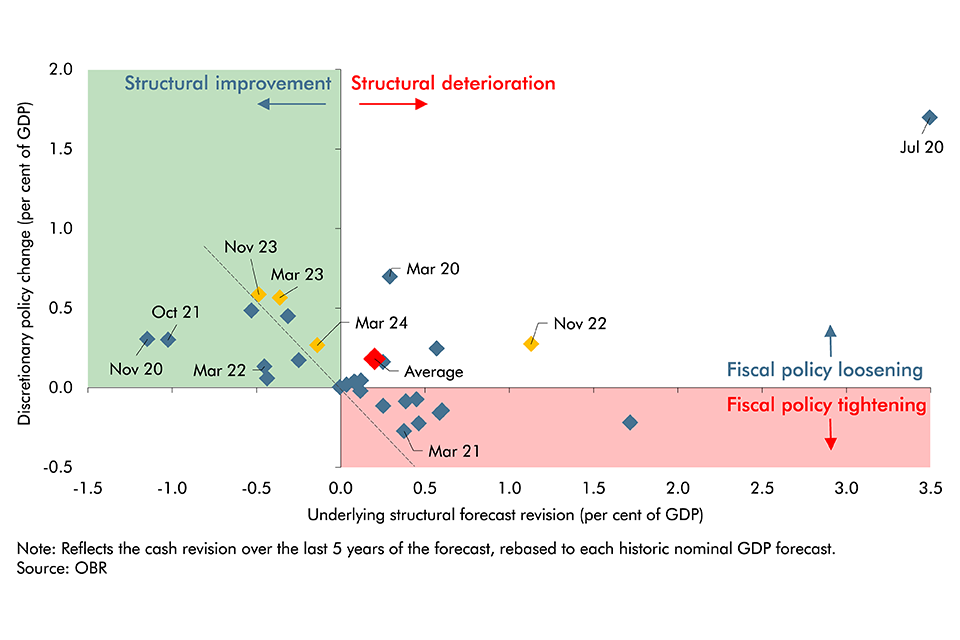
Chart B shows how policy decisions since 2010 have responded to forecast changes in the underlying fiscal position. Our forecast is conditioned on stated Government policy and so asymmetric policy responses to future shocks introduce a potential source of bias. The chart plots the aggregate size of discretionary policy packages in each fiscal event (vertical axis) against the size and direction of the underlying forecast revision (horizontal axis).b It shows that:
- In every instance of good news on the underlying fiscal position, the policy response has been to spend at least some of the windfall (top left quadrant). Typically, less has been spent than the underlying fiscal improvement (most of the dots in the top left quadrant are below the 45-degree dashed line that signifies a one-for-one change).
- The responses to deteriorations in the underlying fiscal position have been more varied – with a mixture of fiscal tightening (bottom right quadrant), fiscal loosening (top right quadrant) and several instances of a relatively neutral fiscal package. In no case has the tightening of fiscal policy been equal to or greater than the underlying forecast deterioration (there are no dots below the 45-degree line in the bottom right quadrant).
- This Budget falls into the top left quadrant, meaning that the response to the improvement in the pre-measures fiscal position (by 0.1 per cent of GDP) since our November forecast, has been to loosen fiscal policy (by 0.3 per cent of GDP).
Chart B: Policy responses to underlying fiscal forecast revisions
This box was originally published in Economic and fiscal outlook – March 2024
a A ‘loosening’ of fiscal policy is defined as when the cumulative 5-year fiscal impact of a policy package increases borrowing. A ‘tightening’ of fiscal policy is the reverse. This analysis excludes the cyclical component of our forecast revisions.
b The cumulative effect of policy decisions across each forecast period are shown on the vertical axis and are measured as the total cash effect on borrowing over the five-year period, as a share of total nominal GDP over the same period. This expresses the typical ‘£ billion’ effect of a fiscal loosening or tightening in units that do not rise over time simply because the cash size of the economy is growing. Our pre-measures forecast changes are shown on the horizontal axis using the same metric. The effect of major classification changes has been stripped out.