
The VAT Retail Export Scheme enabled non-EU visitors to the UK to reclaim the VAT incurred in purchasing goods from participating retailers. It was abolished following the UK’s exit from the EU in January 2021. In reviewing our November 2020 costing in this box, we concluded that its methodology still appears reasonable and that the costing was a central estimate. We updated that estimate to account for the impacts of visitors’ wider spending, but continued to believe that this measure is unlikely to significantly affect the productive capacity of the economy.
This box is based on ONS, U.S. Department of Commerce and OBR data from January 2024 and March 2024 .
In November 2020, the Government announced that the VAT Retail Export Scheme (RES) was to be closed from 1 January 2021, following the UK’s departure from the EU. The scheme allowed non-EU visitors to the UK to claim back the VAT incurred on the purchase of certain goods in the UK from participating retailers, subject to conditions. These included that the goods must be purchased from a participating UK retailer, the purchaser needed to complete and submit a paper form, and the goods needed to be exported from the EU within three months of purchase. In practice, the vast majority of claims were processed at departing airports.a
The scheme’s refunds largely related to spending in a relatively small number of luxury stores, such as those located in central London and Bicester Village. Closing the scheme aligned the VAT treatment of non-EU visitors with those from the EU, complying with WTO rules on non-discrimination. In this review we look back at the original November 2020 costing with the benefit of the latest available data and report our revised estimate of the fiscal impact in 2025-26, which was the final year of the scorecard costing. Table B provides a side-by-side Economic and fiscal outlook 72 comparison of the main costing elements from the 2020 estimate and our current view, both relating to 2025-26.
Table B: Comparing the original and revised estimates of the costing
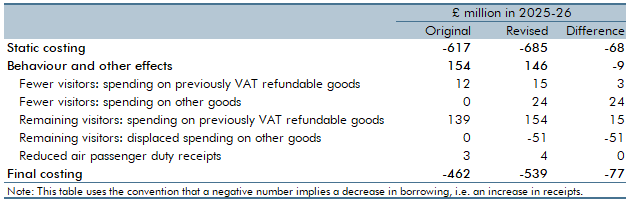
The costing can be broken down into three main elements:b
- The static costing is simply the Exchequer saving from no longer incurring the cost of the VAT refunds.
- Some non-EU visitors will be deterred from visiting the UK following the abolition of the scheme. This direct behavioural effect was captured in the original costing, with the post-measure
VAT RES spending (and associated tax receipts) from this group dropping to zero. The original costing did not include any indirect behavioural effects, namely that there would be a further loss in receipts from the non-VAT RES spending that this group would otherwise have undertaken. - For those VAT RES shoppers that do still come to the UK, the effective rise in price leads them to spend less on these goods, lowering tax receipts. This direct behavioural response from this group is included in the original costing. But it did not factor in the indirect behavioural effect, which in this case refers to previous VAT RES spending by this group that is diverted to non-VAT RES items, which partially offsets the impact of lower VAT RES spending.
- A further potential channel for indirect effects is the possibility that lower external demand for VAT RES goods might reduce employment and long-run potential output.
Reviewing the static costing
The tax base for this costing is the pre-measure level of spending on VAT RES goods by non-EU visitors. The static costing is estimated using HMRC evidence on 2019 refunds, which suggests that just over £520 million of VAT was refunded that year to 1.2 million visitors, implying that spending on VAT RES goods was around £2,700 per person who claimed a refund.c
This is projected over the forecast period using RPI-inflation and the expected number of non-EU visitors. The measure was introduced during the pandemic, when visitor numbers were historically low, so the relatively slow expected uptick in visitors meant the original static costing only returned to £535 million from 2023-24, rising to £617 million by 2025-26.
In the event, the pandemic suppressed visitor numbers for longer than we expected but numbers then rebounded more sharply so that, in cumulative terms, visitor numbers are now expected to be slightly higher (4 per cent) by 2025-26 than we thought in November 2020. By contrast, cumulative CPI inflation (which we decided to switch to for this review since we think it is a more appropriate measure) to 2025-26 is materially higher (16 per cent) than our November 2020 forecast.d This higher inflation is the main reason that in the reviewed costing we raise our estimate of the static costing to £685 million.
Reviewing the direct behavioural impact from non-EU visitors no longer travelling to the UK
The 2020 costing estimated that the policy change would result in 30,000 fewer visitors travelling to the UK in 2025-26. Of the 1.2 million visitors that submitted VAT RES forms in 2019, it was assumed that just under 50 per cent were holiday travellers (with the majority of the remainder visiting for business or family reasons).e For travellers from the rest of the world, the costing estimated an increase in the overall cost of their UK visit of around 3 per cent,f then applied a price elasticity to derive the reduction in visitor numbers.
The elasticity was based on the one UK-specific tourism estimate known to us at the time, which estimated an elasticity of -1.28.g To reflect that VAT RES travellers will see larger changes in visit costs and may be more price sensitive, we scaled up the elasticity by around 50 per cent to -1.9, though this was an uncertain judgement. The tax receipts that would have accrued from this group’s spending on VAT RES goods reduces the savings from the measure in the 2020 costing by £12 million in 2025-26.
In reviewing this direct behavioural assumption, we have considered trends in actual visitor numbers since the policy was introduced. We have also reviewed external estimates of the price sensitivity of travel and tourist expenditure.
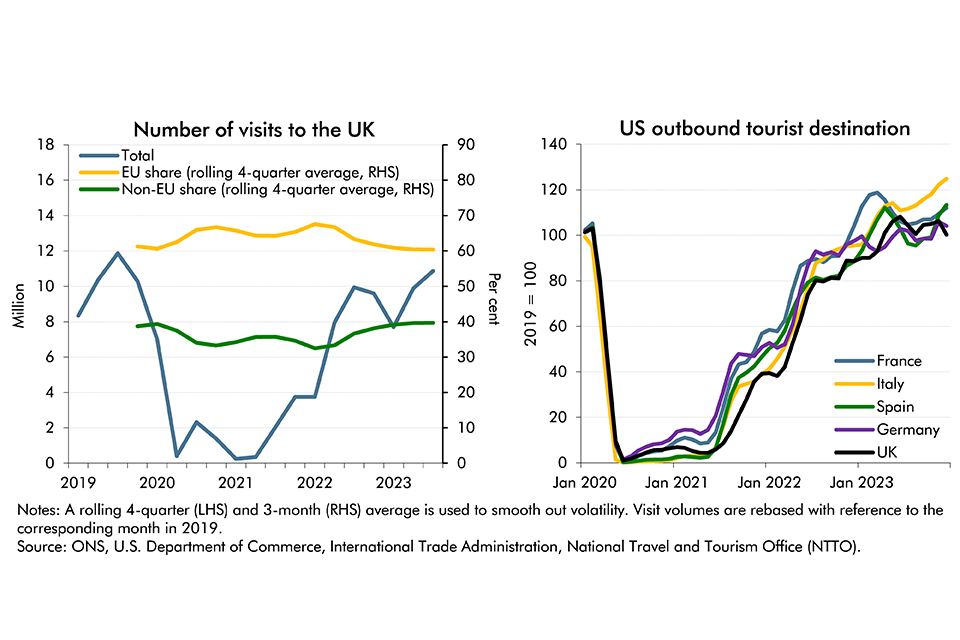
Visitor numbers are driven by a wide range of factors, and the uncertainties during this period are amplified by both the pandemic and the UK’s exit from the EU. The total number of UK visitors has now returned to close to pre-pandemic levels, as has the share from both EU and non-EU visitors (Chart C (left panel)). There has been a moderately bigger bounce-back in the number of visitors from the United States to some other European countries (Chart C right panel). However, the overall difference is not large, and we have not seen a significant change in the composition of UK visitors (between country of origin or reason for travel).
Our review of external estimates of the price sensitivity of international travellers points to a range of -2.1 to -0.4, so the elasticity used in the 2020 costing is toward the top of the range.h We have made a small adjustment to account for those visitors who, though stating they were primarily travelling for non-holiday reasons, might have also been motivated by VAT RES shopping – this takes that proportion from just under 50 per cent to just over. Our revised estimate therefore is that the policy leads to 34,000 fewer VAT RES claimants by 2025-26 and this lowers receipts by £15 million in 2025-26, £3 million more than in the 2020 costing. As groups of VAT RES travellers will see proportionally greater changes in visit costs than other travellers from the rest of the world, there is particularly significant uncertainty around this figure. So, while the data has not cast doubt on our original assumption, there is significant uncertainty around it, and it is possible that the number of deterred visitors could be higher or lower than we assumed. For the resulting behavioural cost to the Government to outweigh the policy’s static savings, this group’s responsiveness would need to be very significantly higher than is suggested by any of the evidence we have considered.
Chart C: Number of visits to the UK by overseas residents
Reviewing the indirect behavioural impact from non-EU visitors no longer travelling to the UK
There is also a loss of tax that would have been collected on spending by deterred visitors on non-VAT RES goods and services. We did not explicitly account for the fiscal impact of this indirect effect of the policy in our November 2020 forecast. However, as in every forecast, the effect on overall aggregate demand of the full policy package (including VAT RES abolition) would have been captured in our economy forecast (via the fiscal multiplier framework discussed in Box 2.1). We would not normally separately quantify the indirect demand effect of a measure such as this, which is relatively small in terms of the UK economy, but we have done so for this review to illustrate its scale.
To do so, we assume that, on average, each deterred visitor was travelling with one companion and that, based on the 2019 data, spending on non-VAT RES items that year was around £1,750 per person (though this estimate is very uncertain). Taking these together, and growing them in line with CPI-inflation and passenger numbers over the forecast period, we estimate that reduced spending by deterred visitors on non-VAT RES goods reduces tax receipts by a further £24 million in 2025-26.
Reviewing the behavioural impact from reduced spending by non-EU visitors that still travel to the UK
The policy raises the net effective price of VAT RES goods for those non-EU visitors that still travel to the UK. The 2020 costing expected this group to respond by reducing the amount they spend on these items. The methodology used to estimate this assumed that VAT RES spending by this group would fall by 29 per cent (around a £785 per-person drop in 2019 terms), closer to (but still above) EU-visitor spending levels. This resulted in a £139 million loss in receipts in 2025-26.
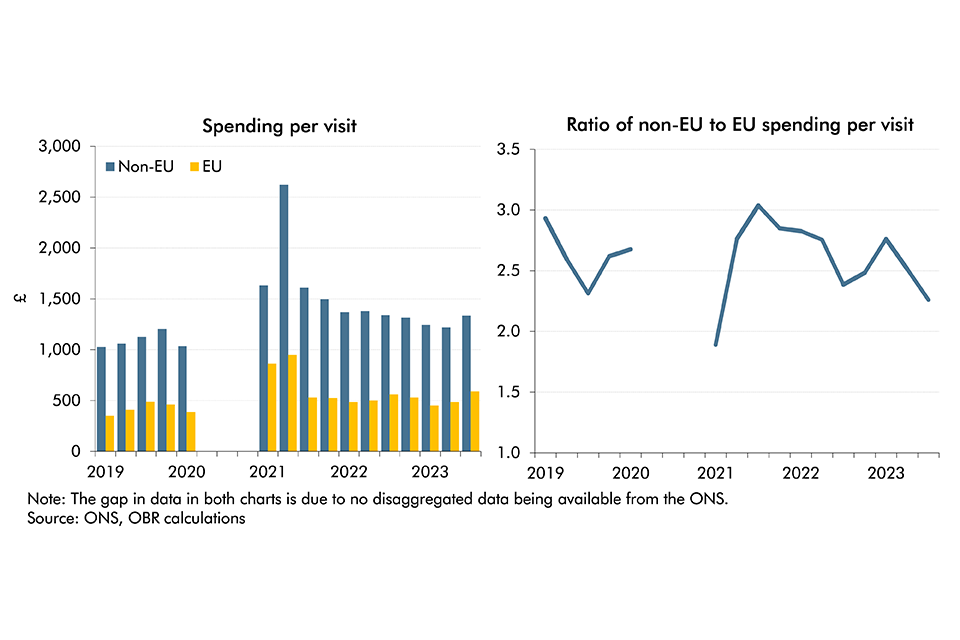
Chart D shows that the ratio of non-EU to EU spending has indeed fallen since 2021, though the extent to which this is a direct consequence of the policy, rather than due to other factors, is not determinable from the data.
A price elasticity of demand approach is a more appropriate way to estimate this behavioural response. The VAT RES demand response from this (undeterred) group should more accurately reflect the change in the price of tourism goods, rather than the overall cost of their trip. Based on the available literature,i the -1.8 intensive margin elasticity implied by a 29 per cent reduction in spending is arguably high. But the literature does not generally consider luxury shoppers explicitly who we would expect to be relatively more price sensitive. And the price rise due to the policy will lead some shoppers to switch from VAT RES to non-VAT RES spending (this effect was not explicitly accounted for in the 2020 costing).
There is little empirical evidence to determine what proportion of this spending will be displaced. But as many luxury goods are not close substitutes for other goods and services consumed by holidaymakers, we have made the judgement that only a third of the 29 per cent reduction in VAT RES spending will be diverted elsewhere. This lowers the implied elasticity to -1.2 which we believe is more central. Overall, we have revised down the total loss in receipts from those non-EU visitors that still travel to the UK to £102 million in 2025-26, £36 million lower than the 2020 costing, largely due to including the impact of spending that is displaced to non-VAT RES sectors.
Chart D: Per-visit spending levels of all UK visitors
Potential wider demand and supply-side indirect behavioural effects
This measure has clearly had significant impacts on the gross sales of affected businesses. As mentioned above, to assess the potential wider demand impact of policy measures on our economy forecast in November 2020 we used our ‘fiscal multipliers’. These assume that any near-term changes in demand from tax increases (like this one) taper away to zero as exchange rates, monetary policy, and real wages adjust to bring output back in line with its potential level and inflation back to target. To fully account for the transmission of changes to the gross sales of affected businesses to the wider economy we would also need adjust for the high import content of many luxury goods, which would significantly reduce the impact on net external demand.
We would only assume changes in fiscal policy have permanent impacts on the level of real potential GDP, the supply side of the economy, when strong evidence suggests that the effects on the value added in the UK are significant, durable, and additional.j With unemployment having remained broadly in line with our estimate of its neutral rate and with vacancies high, this measure is more likely to have reallocated employment and activity between the UK’s sectors and regions.
Conclusion
On review, our 2020 methodology still appears reasonable, and our costing to have been a central estimate (although one surrounded by considerable uncertainty). We have updated it to account for the impacts of visitors’ spending on non-VAT RES spending, but continue to believe that this measure is unlikely to affect significantly the productive capacity of the economy.
We have focused on VAT RES rather than airside shopping because of its greater fiscal costs. Based on our own assessment and from responses received from external stakeholders the behavioural uncertainties around VAT RES are more significant for our forecast than those surrounding airside shopping. But both measures operate via similar channels, and so our main analytical conclusions are also likely to also be relevant for airside shopping.
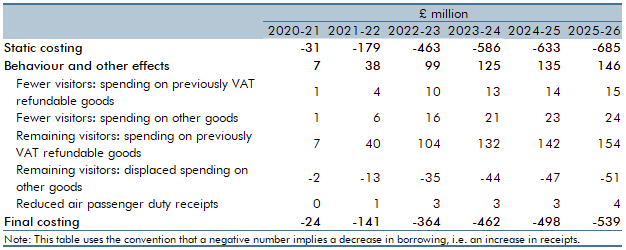
Table C: Revised costing of the abolition of VAT RES
This box was originally published in Economic and fiscal outlook – March 2024