
Debt interest spending has reached post-war records as a per cent of revenue and GDP in recent years and has also proved to be incredibly volatile and subject to large revisions between our forecasts. In this box we looked at the reasons for this elevated spending and volatility and how the process of quantitative tightening by the Bank of England will impact the maturity of this debt.
This box is based on ONS and OBR data from March 2024 .
In the decade prior to the pandemic, debt interest costs were remarkably stable at around £40 billion per year. Interest costs were often a source of ‘upside’ surprises to the fiscal outlook – as outturn interest rates typically turned out to be lower than our forecasts derived from market expectations (Chart E). As a result of this and the fiscal savings from the Bank of England’s quantitative easing (QE) operations (which swapped relatively higher yielding gilts for lower yielding bank reserves), actual debt interest costs were around £27 billion on average below our five-year-ahead forecast between our June 2010 and March 2016 forecasts.
Chart E: Successive OBR debt interest spending forecasts

The rapid rise in global interest rates over the last two years means that interest costs have soared and market expectations of future interest rates have become more volatile, with large revisions, both upwards and downwards, between forecasts. With Bank Rate and gilt yields spiking to over 15-year highs and RPI inflation reaching a 40-year high in 2022-23, debt interest spending tripled in cash terms to over £100 billion and reached a post-war record of 10.8 per cent of government revenue. This increase in debt interest costs was exacerbated by the higher stock of debt, its shorter maturity, and the prevalence of index-linked debt in the UK’s public liabilities.
The stock of debt is forecast to remain above 90 per cent of GDP which, when combined with the potential for continued volatility in interest rate expectations, means that interest spending is likely to remain a major source of risk to the fiscal outlook. By way of illustration, our forecast for debt interest spending in 2027-28 increased by £18.7 billion when interest rate expectations rose between March and November 2023, but has fallen back by £12.8 billion in this forecast as those expectations moderated. In both cases, this volatility in interest costs has been more than the headroom the Chancellor has set aside against his fiscal mandate.
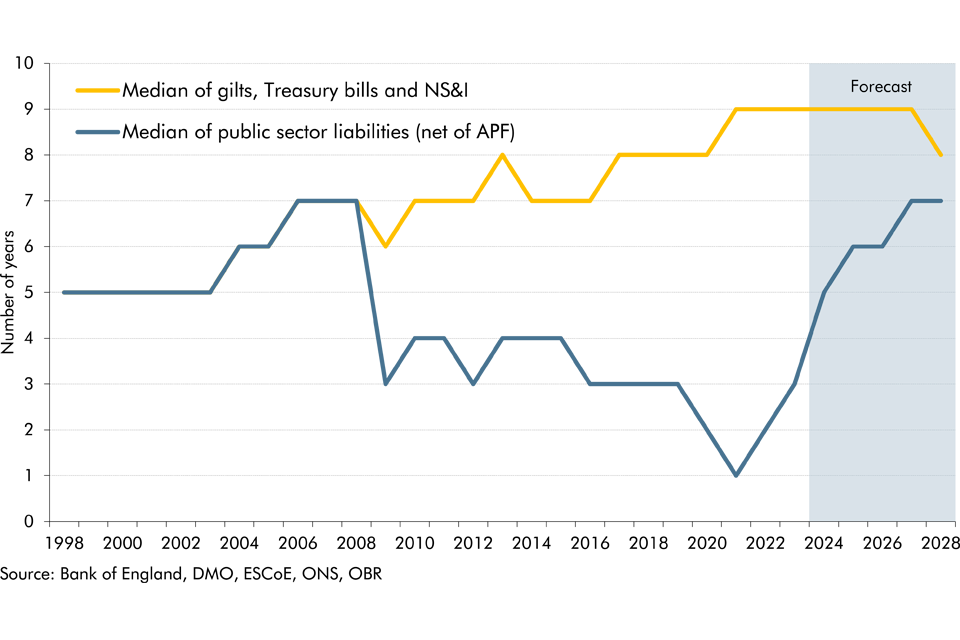
Previous EFOs and Fiscal risks and sustainability reports have explored how the Bank’s QE operations have shortened the effective maturity of the consolidated liabilities of the public sector.a Since then, the steady unwinding of the Bank’s gilt holdings via quantitative tightening has begun to reverse some of that effect. As shown in Chart F, the unwinding of 15 per cent of the Bank’s peak gilt holdings has extended the median maturity of the UK’s consolidated public liabilities from 1 year in 2021 to 3 years by the end of 2023. By 2028, when we assume 71 per cent of gilts will have been returned to the market, the effective maturity will have reached 7 years. This is the same as its pre-QE level, reflecting the relatively long effective maturity of gilts, Treasury bills, and National Savings and Investment products whose combined maturity has remained relatively stable between 7 and 9 years since 2010. This steady re-extension of maturities will help to partially re-insulate the public finances from future changes in borrowing
costs. But both the UK’s higher debt stock and the potential for continued volatility in interest rates are likely to continue to drive large changes in debt servicing costs from one forecast to the next.
Chart F: Changes in maturity of UK debt stock
This box was originally published in Economic and fiscal outlook – March 2024