
In the final four years of our March 2024 forecast, departmental spending follows an overall envelope set by the Government because the detailed departmental spending plans set at the last Spending Review only extend to March 2025. In this box, we explored the implications of these plans for different departments, and how past governments have revised departmental spending at Spending Reviews.
This box is based on HMT, IFS and OBR data from October 2021 and March 2024 .
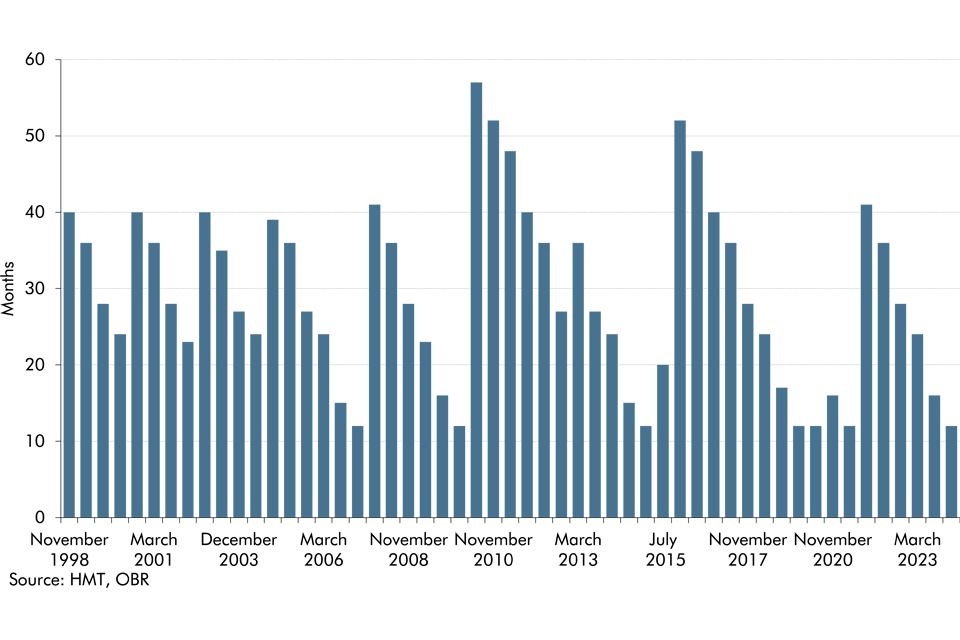
The plans for the Departmental Expenditure Limits (DELs) which the Government set in the October 2021 Spending Review (SR21) run to the end of 2024-25. This means that, for the over 40 per cent of public spending within DEL, the Government currently only has detailed, department-by-department spending plans covering one year of our five-year fiscal forecast. This shrinking of the departmental financial planning horizon down to one year or less has been a feature of the UK’s public spending framework since 2007.
Chart B: Months covered by departmental spending plans
In the absence of detailed departmental spending plans after 2024-25, departmental spending follows two overall envelopes set by the Government: that day-to-day spending (RDEL) grows by an average of 1.0 per cent a year in real terms; while capital spending (CDEL) is broadly flat in cash terms. Taken together, these assumptions imply total DEL falls as a share of GDP by 1.0 percentage points over the final four years of the forecast, though in 2028-29 DEL is still 1.1 percentage points above its pre-pandemic share of GDP).
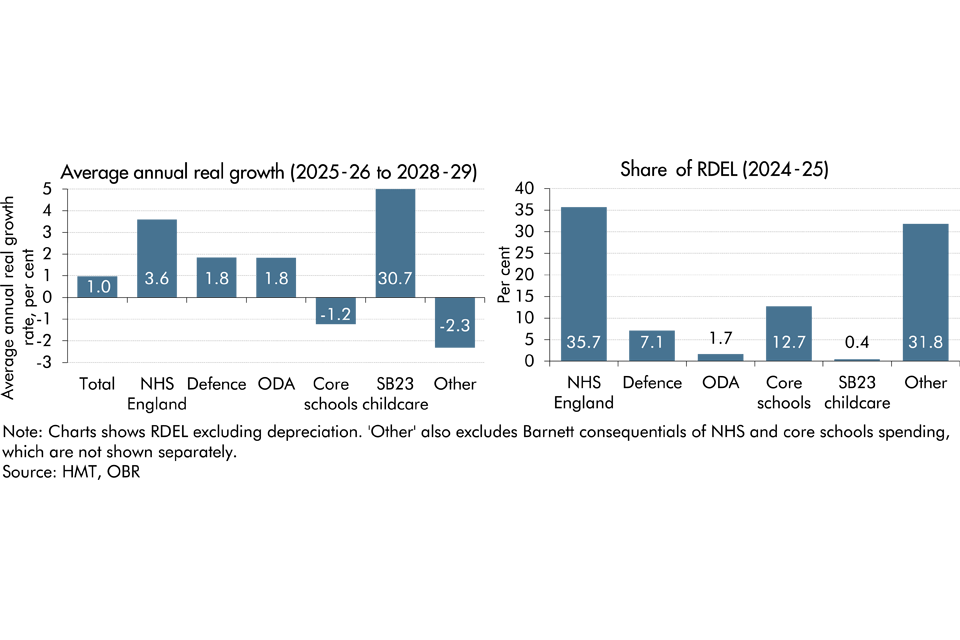
While these spending envelopes are not yet allocated to departments, we can still explore their implications by considering what existing input targets and commitments in some areas of spending imply for growth in spending in areas not covered by such targets – often called ‘unprotected’ spending. Looking at day-to-day departmental spending, we assume (Chart C):
- Spending on the NHS in England grows by 3.6 per cent a year in real terms, using the IFS’ central scenario for the Government’s Long-Term NHS Workforce Plana. This is in line with the long-run (1949–50 to 2022–23) average real terms growth rate of UK health spending, though above real terms growth in recent years. The government’s public sector productivity package could increase NHS productivity and partially offset the spending growth required to deliver the NHS Workforce Plan.
- Defence spending is held flat as a share of GDP, consistent with the Government’s commitment to keep such spending above the NATO minimum of 2 per cent of GDP. Meeting the Government’s ambition to increase defence spending to 2.5 per cent of GDP would increase the pressure on unprotected spending.
- Spending on Official Development Assistance (ODA) is maintained at 0.5 per cent of gross national income (GNI) throughout the forecast. If the Government were to return ODA spending to 0.7 per cent of GNI – as they have committed to when the fiscal situation allowsb – this would also increase the pressure on unprotected spending.
- Core schools spending is held flat in per-pupil real terms, reflecting the Government’s statement that SR21restored per pupil spending to 2010 levels in real terms.c
- The additional £3.9 billion per year announced in the March 2023 Budget to fund the extension of 30 hours of free childcare to parents of nine-month- to two-year-olds is protected in cash terms.
- The consequences of our NHS and schools spending assumptions for devolved administrations are captured using the Barnett formula.
With the post-SR21 envelope for total RDEL spending provided by the Treasury, these assumptions would leave other ‘unprotected’ RDEL spending (accounting for just under a third of day-to-day departmental spending) needing to fall by 2.3 per cent a year in real terms from 2025-26. If defence and ODA spending increased in line with the Government’s ambitions outlined above, this would lead to unprotected spending needing to fall by an average of 3.6 per cent a year.d Delivering a 2.3 per cent a year real terms fall in day-to-day spending would present challenges. Performance indicators for public services continue to show signs of straine and there are other near-term fiscal risks, such as the potential need for countries to provide a greater amount of aid to Ukraine and alleviate funding pressures on local authorities. Longer-term pressures on public spending, such as from climate change and an ageing population, are also building, as discussed in our Fiscal risks and sustainability reports.
Chart C: Implied post-SR21 breakdown of real RDEL spending and share of RDEL
The implementation of these assumptions for departmental spending therefore remain a significant risk to our forecast. As Spending Reviews have approached, governments since 1998 have increased the annual real growth in day-to-day spending by an average of 1.1 per cent. In the run-up to the two Spending Reviews in November 2015 and October 2021, governments topped up the RDEL envelope by an average of £39 billion and £32 billion per year respectively. Such increases have been a major cause of the differences between our past borrowing forecasts and outturn, explaining around half of the difference on average between 2011-12 and 2021-22.f
Chart D: Change in real RDEL envelope growth rate at Spending Reviews

This box was originally published in Economic and fiscal outlook – March 2024