
In the final four years of our November 2023 , departmental spending follows an overall envelope set by the Government because the detailed, department-by-department plans set at the last Spending Review only extend to 2024-25. In this box, we explored the implications of these plans for different departments.
This box is based on HMT data from November 2023 .
In the final four years of our forecast, departmental spending follows an overall envelope set by the Government because the detailed, department-by-department plans set in the 2021 Spending Review (SR21) only extend to 2024-25. For day-to-day spending (RDEL), this envelope grows by an average of 0.9 per cent a year in real terms. This is lower than the 1.1 per cent a year growth at our last forecast in March, though a higher starting point in 2024-25 and higher forecast inflation mean spending in cash terms is higher by £4.8 billion a year on average. For capital departmental investment spending (CDEL), the Government’s envelope implies total spending in cash terms is broadly unchanged since our last forecast. Taken together, these two assumptions imply total DEL falling as a share of GDP by 1.1 percentage points over the final four years of the forecast (though in 2028-29 DEL is still 1.2 percentage points above its pre-pandemic share of GDP). And by 2027-28, higher inflation means real total DEL spending in the same year is £19.1 billion lower than our March forecast.
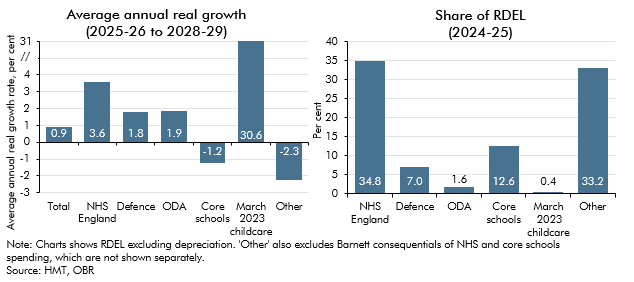
While these spending envelopes are not yet allocated to departments, we can still explore their implications by considering what existing input targets and commitments in some areas of spending imply for growth in spending in areas not covered by such targets – often called ‘unprotected’ spending. Looking at day-to-day departmental spending, we assume (Chart D):
- Spending on the NHS in England grows by 3.6 per cent a year in real terms, using the IFS’ central scenario for the Government’s Long-Term NHS Workforce Plan.a This is in line with the long-run (1949–50 to 2022–23) average real terms growth rate of UK health spending, though above real terms growth in recent years.
- Defence spending is held flat as a share of GDP, consistent with the Government’s commitment to keep such spending above the NATO minimum of 2 per cent of GDP. Meeting the Government’s ambition to increase defence spending to 2.5 per cent of GDP would increase the pressure on unprotected spending.
- Spending on Official Development Assistance (ODA) is maintained at 0.5 per cent of gross national income (GNI) throughout the forecast. If the Government were to return ODA spending to 0.7 per cent of GNI – as they have committed to when the fiscal situation allowsb – this would also increase the pressure on unprotected spending.
- Core schools spending is held flat in per-pupil real terms, reflecting then Chancellor Sunak’s statement that SR21 restored per pupil spending to 2010 levels in real terms.c Prime Minister Sunak’s conference speech commitment to more teachers would need to be accommodated within this flat real spending per pupil and falling pupil numbers, to avoid further squeezing unprotected spending.
- Spending on the Government’s March 2023 Budget childcare policy to expand 30 hours of free childcare to parents of nine-month- to two-year-olds is protected in cash terms.
- The consequences of our NHS and schools spending assumptions for devolved administrations are captured using the Barnett formula.
With the post-SR21 envelope for total RDEL spending provided by the Treasury, these assumptions would leave other ‘unprotected’ RDEL spending (accounting for a third of day-to-day departmental spending) needing to fall by 2.3 per cent a year in real terms from 2025-26. If defence and ODA spending increased in line with the Government’s ambitions outlined above, this would lead to unprotected spending needing to fall by an average of 4.1 per cent a year.d
Delivering a 2.3 per cent a year real terms fall in day-to-day spending would present challenges. Performance indicators for public services continue to show signs of strain, for example the backlog in crown courts reached a record high of 65,000 in August 2023 and eleven ‘section 114s’ notices have been issued by local authorities since 2018, compared to two in the preceding 18 years. The Institute for Government’s recent report found that performance in eight out of nine major public services has declined since 2010, with schools the exception.e Longer-term pressures on public spending, such as from climate change and an ageing population, are also building, as discussed in our Fiscal risks and sustainability reports.
Chart D: Implied post-SR21 breakdown of real RDEL spending and share of RDEL
Delivering these spending plans while maintaining or improving public services would require significant improvements in public sector productivity (i.e. producing the same outputs with fewer inputs). Measured public sector productivity fell sharply during the pandemic and, while it has recovered since, remains around 5 per cent below pre-pandemic levels. Raising public sector productivity by 5 per cent would be the equivalent of around £20 billion extra in funding, more than the £13.6 billion fall in ‘unprotected’ spending shown in Chart D. However, to turn such productivity improvements into lower spending, the Government would have to reduce spending on inputs, which would be likely to require dropping some of the input targets for staff and funding described above. An update to the Treasury’s Public Sector Productivity Programme, published alongside this Autumn Statement, has identified areas for potential future productivity improvements, such as by using AI and cutting administrative tasks for frontline workers.
Overall, the Government’s post-Spending Review plans present a significant risk to our forecast. As recent Spending Reviews have approached, governments have topped up annual day-to-day spending envelopes significantly: by £39 billion (14 per cent) on average in the year up to the November 2015 Spending Review, and by £32 billion (8 per cent) in the October 2021 Spending Review. Such increases have been a major cause of the differences between our past borrowing forecasts and outturn, explaining around half of the difference on average between 2011-12 and 2021-22.f
This box was originally published in Economic and fiscal outlook – November 2023