
Since the June 2016 EU referendum, our forecasts have incorporated a set of assumptions about the economic impact of Brexit on trade, productivity, investment, and migration. In this box, we assessed our current assumptions on trade against the latest evidence.
This box is based on OECD and ONS data from February 2024 .
Since the June 2016 EU referendum, our forecasts have assumed that the volume of UK imports and exports will both be 15 per cent lower than if we had remained in the EU. We assume that the resulting reduction in the trade intensity of GDP will lead to a 4 per cent reduction in the potential productivity of the UK economy (relative to remaining in the EU), with the full effect felt after 15 years. A decline in trade intensity plausibly lowers productivity because trade, among other channels, fosters competition and allows countries to specialise in activities where they are relatively more efficient.a This box assesses these assumptions against the latest evidence.b
The Trade and Cooperation Agreement (TCA), signed in December 2020, set the terms of the post-Brexit trading relationship between the UK and EU. However, the application of the TCA remains ongoing, with the UK implementing physical inspections on imports from the EU from April 2024 and further declaration requirements from October 2024.
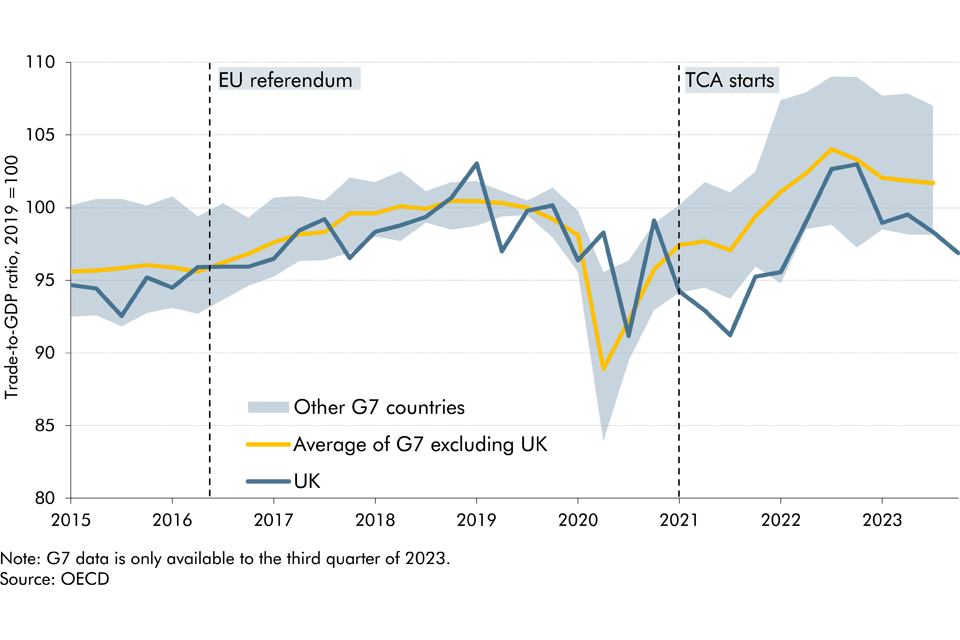
Overall trade intensity in the UK and the rest of the G7
Trade volumes in all advanced economies declined sharply at the height of the pandemic in 2020. However, UK trade intensity (exports plus imports as a share of GDP) has not recovered in line with other G7 countries since then (Chart F). In the third quarter of 2023, UK trade intensity remained 1.7 per cent below its pre-pandemic level from 2019. By contrast, it had risen 1.7 per cent above pre-pandemic levels on average in the rest of the G7.
Chart F: Trade intensity in the UK and rest of the G7
More stringent regulation of trade flows, the expectation of further regulatory tightening, and uncertainty over future trade policy may all have weighed on trade between the UK and EU over this period. Goods trade between EU countries and goods trade between the EU and the rest of the world grew more than a third between 2019 and 2022 in current prices. Meanwhile, goods trade between the UK and EU only grew by only around 10 per cent over the same period. An ONS survey of businesses from early 2024 indicates around half of exporting firms and two thirds of importing firms have reported extra costs associated with the changes in regulation since the end of the transition period. Similarly, the Bank of England Agents’ survey suggests EU trade frictions have weighed on export demand and may compound as new UK-EU regulations come into operation this year.c
Composition of trade in the UK and the rest of the G7
Within UK trade, there has been a significant and growing divergence between the performance of goods and services since the pandemic (Chart G).
- Growth in UK goods trade (exports plus imports) has fallen well behind the rest of the G7. At the end of 2023, UK goods trade was around 10 per cent below 2019 levels, while it was around 5 higher on average for the rest of the G7 in the third quarter.
- Meanwhile, UK services trade growth has been the strongest in the G7. It reached around 12 per cent above 2019 levels at the end of 2023, versus around 9 per cent above in the rest of the G7 in the third quarter.
The UK’s differential performance between goods and services trade post-Brexit likely reflects several factors. First, global trade in services, where the UK has a relative comparative advantage, has grown faster than global goods trades since 2008. Second, post-Brexit trade barriers have created more significant frictions for goods than services. Third, the UK is less dependent on the EU for services exports than goods exports – around a third of UK service exports go to the EU, compared to roughly half for goods.d Fourth, digitalisation makes trade in some services easier and less dependent on physical proximity than in the past.e
Chart G: Goods and services trade in the UK and rest of the G7

What is driving the growth in UK services trade?
UK services trade has continued to grow strongly, including with the EU, despite the increase in trade barriers post-Brexit. Looking at its sectoral composition, around two thirds of the growth in services trade volumes since 2019 has been driven by the ‘other business services’ sector, which includes management consulting, research & development, and advertising (Chart H). By contrast, exports of financial services and transport have lagged other sectors, declining 5.9 per cent and 2.0 per cent respectively. These are also sectors which are more likely to have been impacted by Brexit frictions.f
The recent strong growth in the UK’s exports in ‘other business services’ could reflect several factors. First, trade barriers with the EU may be lower for these kinds of services than goods or other, more highly regulated, services such as banking.g Second, there has been particularly strong growth in service exports to the US, possibly capturing US firms outsourcing work to the UK, supported by the recent weakness in the pound.h Finally, there is some evidence that services firms may have circumvented trade barriers by selling through foreign affiliates.i
Chart H: Breakdown of growth in UK service exports since 2016

Overall, our assumptions about the impact of Brexit appear to be broadly on track and recently published studies are also broadly consistent with these estimates.j However, it remains hard to draw firm conclusions given the challenges of disentangling the simultaneous impacts of Brexit, the pandemic, and other geopolitical developments affecting UK and global trade. Trade data are also volatile and prone to revision, particularly trade in services. Moreover, the full implementation of the TCA will further increase barriers to trade in goods with the EU. We expect the total impact of Brexit to be realised several years after full implementation of these barriers. In the meantime, we will keep our Brexit assumptions under review.
This box was originally published in Economic and fiscal outlook – March 2024