
Box sets » Economic and fiscal outlook - March 2025
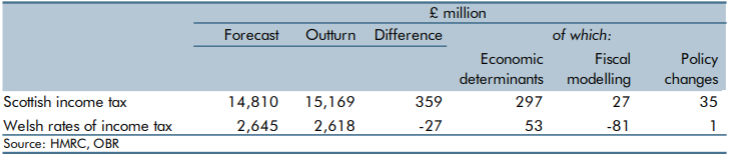
Income tax was devolved to the Scottish Parliament in 2016 and the Welsh Senedd in 2019. In this box we evaluated our March 2022 forecasts for 2022-23, and how they compared to the eventual outturn data. We explained the drivers behind the differences between our inital forcasts and final outturn behind the 2.4 per cent surplus for Scotland and 1.0 per cent shortfall in Wales. This was a particularly difficult period to forecast given the economy was recovering from the unprecedented impact of the Covid-19 pandemic.
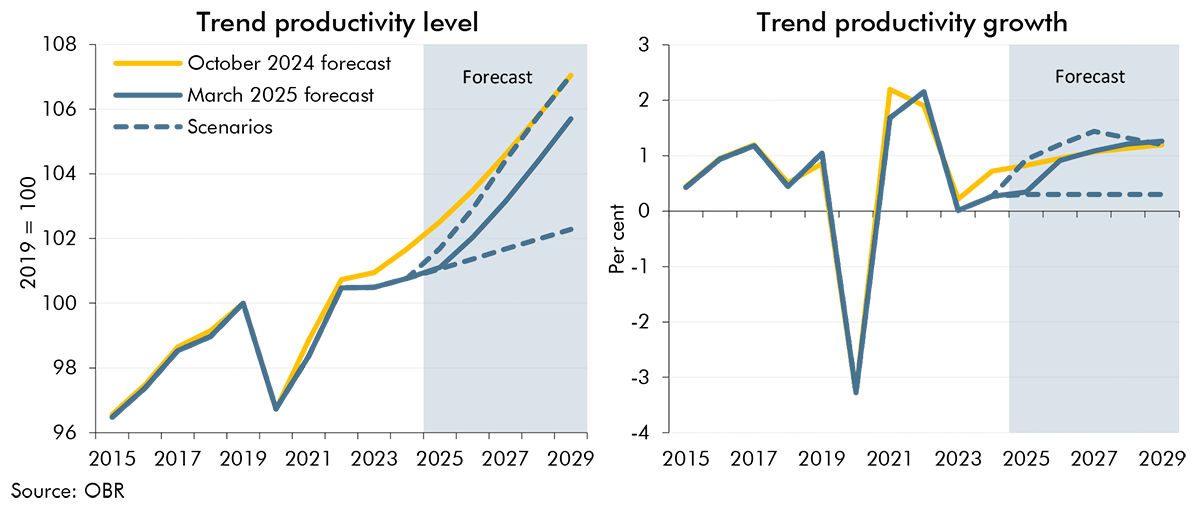
The outlook for trend productivity is one of the most important and uncertain forecast judgements. Successive past forecasts for trend productivity have proven to be too optimistic as productivity growth has continued to disappoint. In this box we explored two alternative scenarios for trend productivity: One where the recent weakness in trend productivity growth persists throughout the forecast period and one where it proves to be entirely cyclical and is offset by higher growth in the near-term.
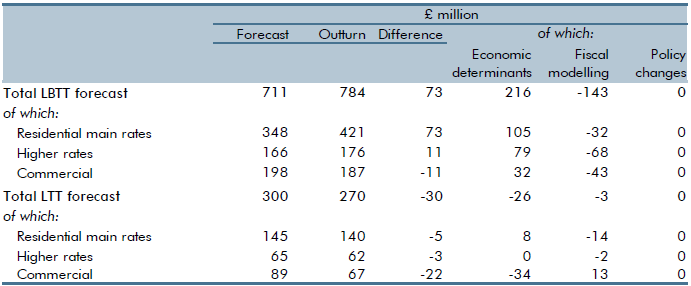
The land and buildings transaction tax (LBTT) was implemented in Scotland on April 1 2015 while the land transactions tax (LTT) began in April 1 2018. Both taxes replaced the UK Government’s stamp duty land tax but operate in similar ways. In this box we evaluated our March 2023 forecasts for 2023-24, and how they compared to the eventual outturn data. We explained the reasons behind the 10.3 per cent surplus for LBTT and the 9.9 per cent shortfall for LTT.
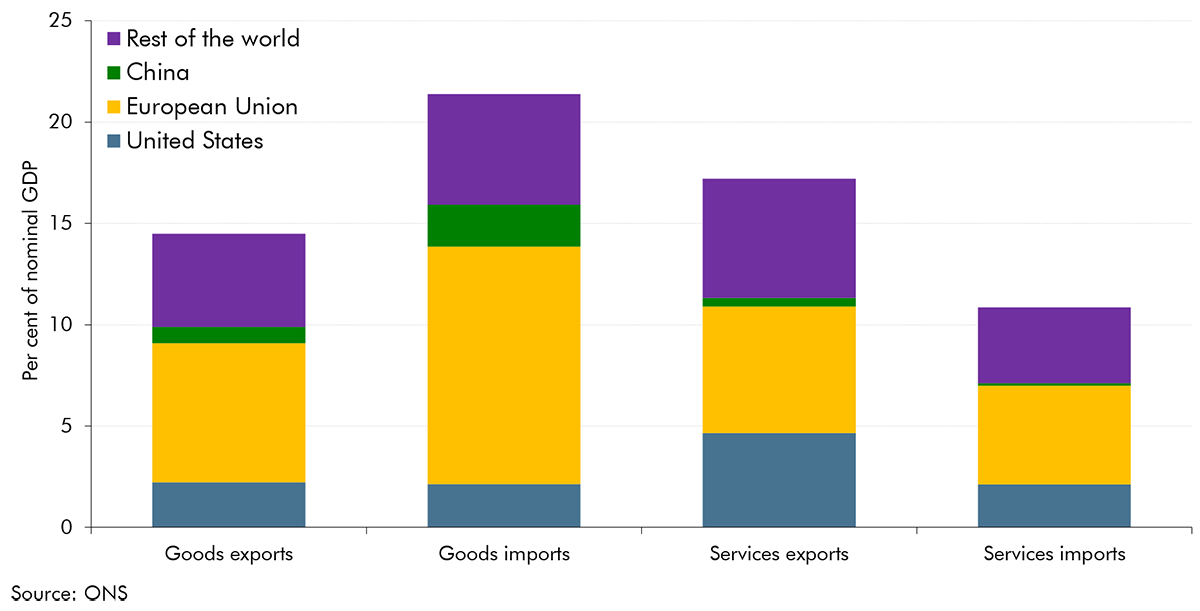
In the run-up to our March 2025 Economic and fiscal outlook, global trade policies had been subject to frequent changes and the future direction for trade policy was highly uncertain. In this box, we outlined three illustrative scenarios to show the potential impact of higher US and global tariffs on UK output and inflation, highlighting the primary transmission channels and their probable effects.
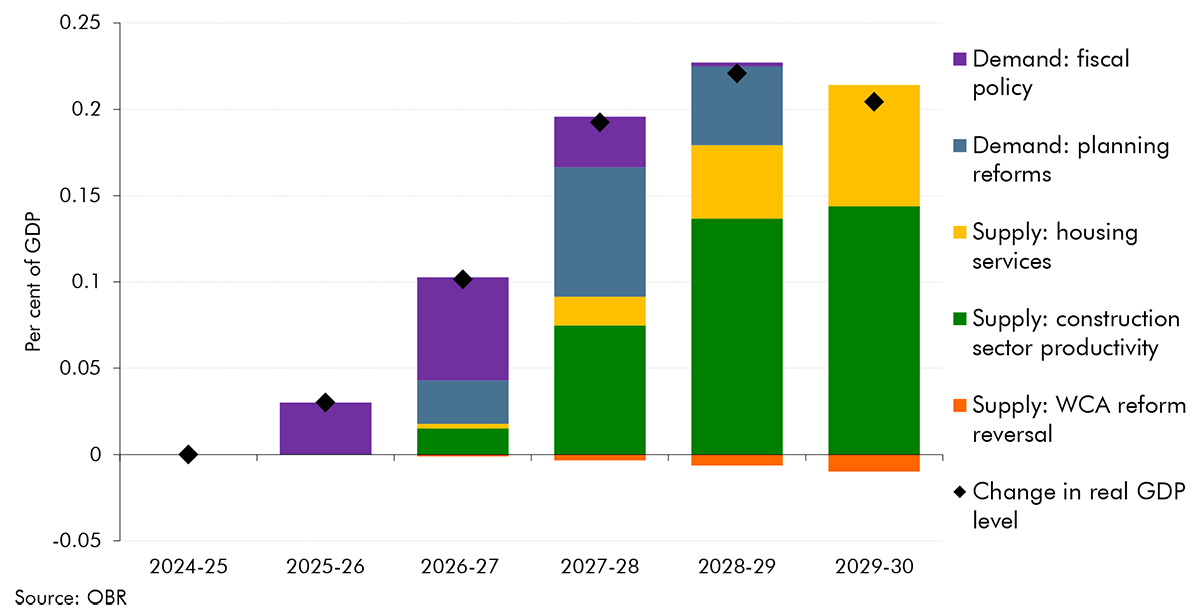
In this box, we discussed the impact that policy changes and announcements since October have on our economy forecast. Specifically, we looked at how the policy package and planning reforms affect real GDP and inflation, before also considering the impact of welfare reforms and its potential future impact.
The Pathways to Work Green Paper announced a range of welfare measures, some of which we have not incorporated in this forecast. In this box, we explained why some measures were not included, and indicated what risks they pose to our welfare spending and labour supply forecasts.
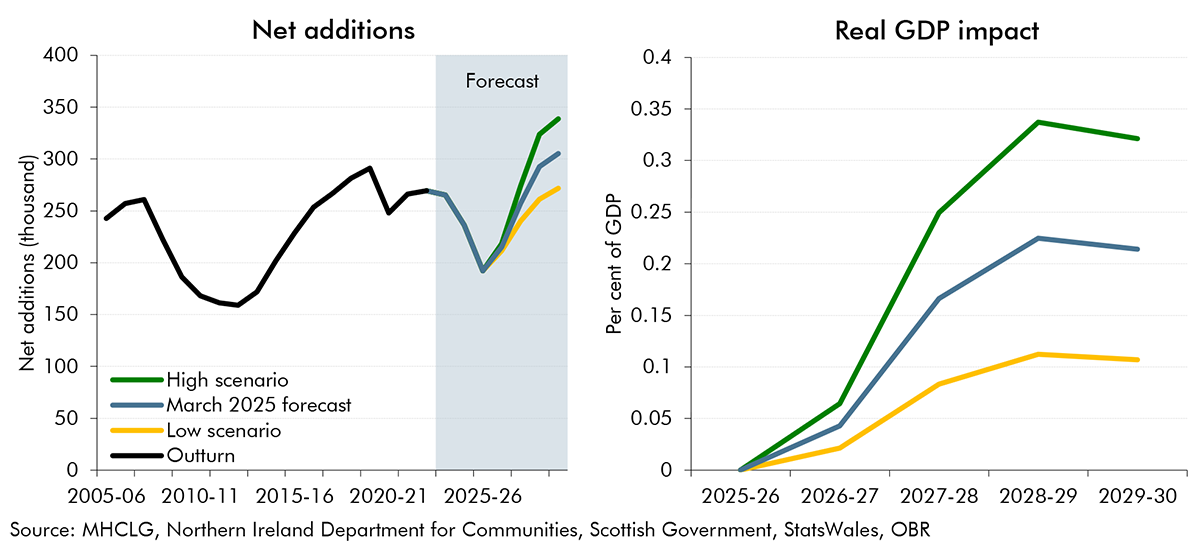
In our March 2025 forecast, we estimated that the Government's residential planning reforms will boost housebuilding by 170,000 and GDP by 0.2% by 2029-30. However, there are significant uncertainties around these estimates. In this box, we explored alternative scenarios for housebuilding and their corresponding impact on GDP.
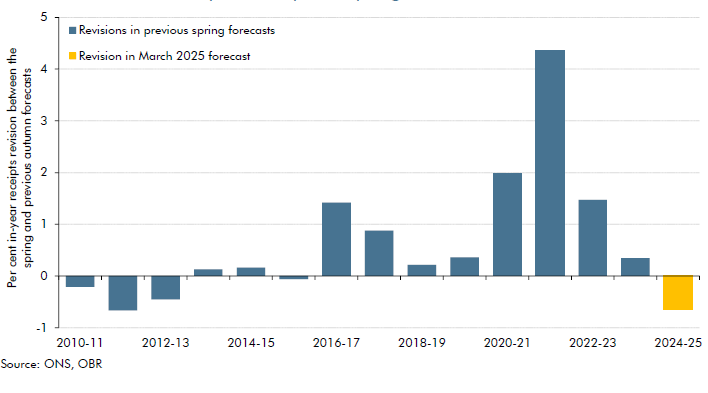
Our March 2025 forecast for 2024-25 receipts is £7.5 billion below our October 2024 forecast. This box compared this shortfall to past Autumn to Spring forecast changes, explained the reasons for this shortfall, and described its impacts on the forecast.
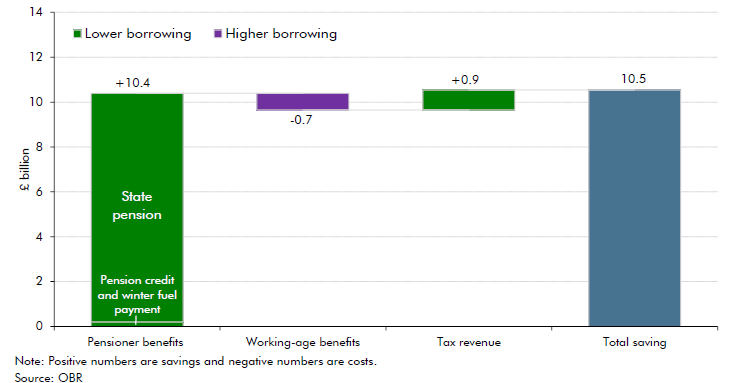
As life expectancy has increased, successive governments have increased the state pension age, and it next increases between 2026 and 2028 from 66 to 67. In this box, we estimated the impact of this increase on pensioner welfare spending, working-age welfare spending, and tax revenue.
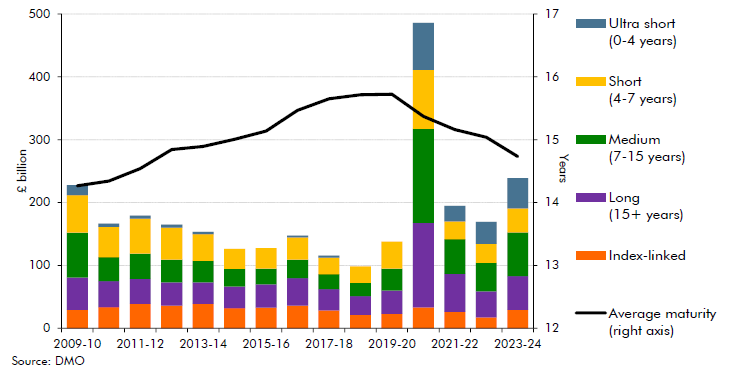
The UK government meets the bulk of its financing needs through issuing gilts across a variety of maturities. In recent years the average maturity of gilt issuance has fallen steadily, this box discussed the drivers of this change and the implications.