
Inflation risks intensified after we closed our pre-measures forecast for the October 2021 Budget. This box showed two stylised scenarios embodying higher and more persistent inflation than in our central forecast to highlight the uncertainty surrounding the outlook. In one scenario inflation was driven mainly by pressures in the product market, and the other mainly pressures in the labour market, which had different implications for wages and consumption.
Inflation risks have intensified since we closed our pre-measures forecast on 24 September. In our central forecast, CPI inflation peaks at 4.4 per cent in the second quarter of 2022, with above-target inflation due to higher utility prices and rebounding demand running up against supply bottlenecks (Box 2.3). Inflation then returns relatively quickly towards the Bank of England’s 2 per cent target as utility prices stabilise and these supply bottlenecks ease. But that judgement may prove too optimistic, and inflation may prove more durable, especially if people come to expect high inflation to continue and businesses raise prices to protect their profit margins or workers demand larger wage increases to maintain their purchasing power.
To highlight the uncertainty surrounding the outlook for inflation and its different effects on wages and consumption depending on its source, we show two stylised and deliberately stark scenarios, embodying higher and more persistent inflation than in our central forecast. While they have the same profile for CPI inflation, one is driven mainly by pressures emanating from the product market (including possibly higher utility prices) and the other by increased labour market pressures (reflecting an improved negotiating position for workers). The fiscal implications of sustained higher inflation also differ depending on its source – these are discussed in Box 3.2.
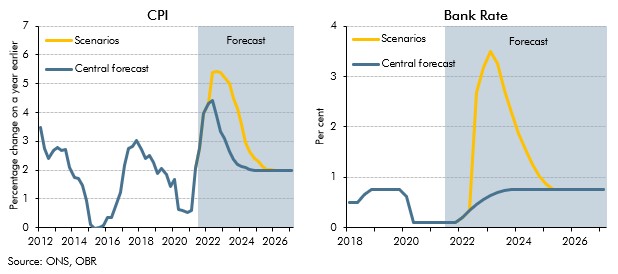
In both scenarios, a further sharp and persistent increase in costs means inflation peaks at 5.4 per cent (1 percentage point above our central forecast and the highest rate in three decades)
and then falls back more slowly than in our central forecast. Based on a simple monetary policy rule, Bank Rate in our scenario reaches 3.5 per cent (its highest since November 2008), thereby
suppressing demand and moderating inflationary pressures, but even so it still takes a year longer for inflation to return to the target than in our central forecast. At its peak, the impact of
this vigorous monetary tightening prevents a further 2 to 3 percentage point rise in inflation, and without it the price level would be some 6 to 8 per cent higher at the scenario horizon.
Chart G: CPI inflation and Bank Rate: central forecast versus alternative scenarios
In the product market scenario, the higher inflation is assumed to originate within the product market, with businesses imposing a higher mark-up over unit labour costs, possibly to cover their higher energy costs. Higher energy costs would also raise CPI inflation directly. Indeed, since we closed our pre-measures forecast, wholesale oil and gas prices for the coming six months have risen by 19 and 53 per cent respectively. If the increases were passed on to consumers through higher petrol and utility prices this would add around 0.5 percentage points to CPI inflation by the second quarter of next year relative to our central forecast.
In the labour market scenario, the higher inflation is driven by stronger wage growth than in our central forecast. This is consistent with workers demanding higher wage increases, either because of an increase in inflation expectations or because the tightness in some parts of the labour market allows workers to extract higher wages, setting in train a mild wage-price spiral.
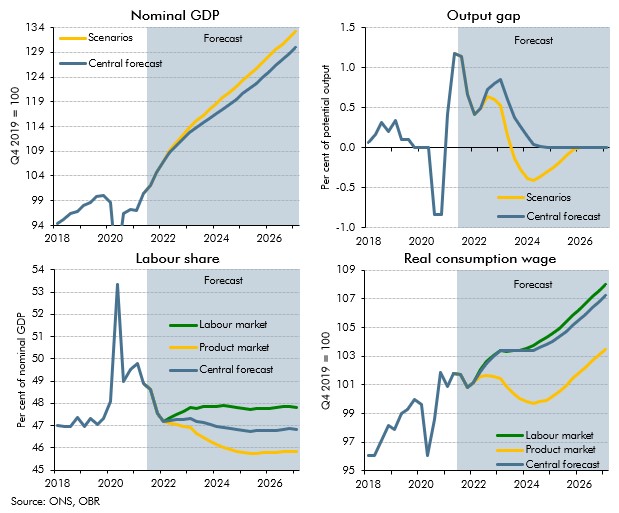
Both scenarios result in higher nominal GDP (and so nominal tax bases), up 2.5 per cent at the scenario horizon, with the key difference between them lying in the distribution of incomes:
- In the product market scenario, firms do not fully compensate workers for increased inflation, so that real wages are 3.5 per cent lower at the scenario horizon (with nominal wages and the consumption deflator higher by 0.3 per cent and 4 per cent respectively) and the labour share is 1 percentage point lower than in our central forecast.
- In the labour market scenario, firms’ profit margins are squeezed as a result of conceding higher nominal wage increases in the absence of higher productivity, so that real wages are 0.7 per cent higher at the scenario horizon (with nominal wages and the consumption deflator higher by 4.7 per cent and 4 per cent respectively) and the labour share is 1 percentage point higher than in our central forecast.
Wages are subject to a higher effective tax rate than other forms of income, so this has fiscal consequences. Higher real wage growth in the labour market scenario also boosts consumption compared to the product market scenario, and consumption is the second most important tax base. Finally, the differences in wages in the scenarios feed into house prices, leaving house prices 8 per cent lower in the product market scenario than the labour market scenario. In each case, the changes in house prices and mortgage rates (due to higher Bank Rate) also affect the ‘wedge’ between RPI and CPI inflation through their impact on the housing depreciation and mortgage interest payments components. This has fiscal consequences too given the large stock of debt that is linked to RPI inflation.
Chart H: Alternative scenarios for higher and more persistent inflation
This box was originally published in Economic and fiscal outlook – October 2021